Category Archives: Altimeter

Northwest Natural Gas (NWN) Altimeter

Today's altimeter is on Northwest Natural Gas (NWN) and there is a lot to appreciate when we exam the pattern that has been established so far. NWN has increased its dividend for 53 years in a row. With such a history of dividend increases, I think NWN will do everything it can to avoid cutting or leaving the dividend the same. At the price of $42.29, NWN is within 16% of the 52-week low.

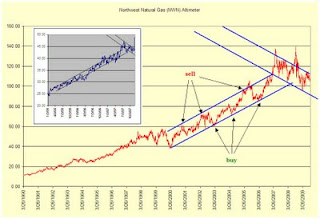
NWN has a challenging altimeter to decipher until you take a closer look. The pattern that has been established since 2000 until the present is an exact replication of the move from the period 1995 to 1997 (shown in the inset.) After the 1995 to 1997 moves we can see that the stock traded in a wide range until the ultimate low in 2000. From the 2000 low the stock traded in a narrow ascending range, offering several clear opportunities to buy and sell the stock.

Although I have taken artistic license on the interpretation of this altimeter, I do believe that the possibility may exist that NWN will not go materially below the March 2009 low. With the recent decline in natural gas prices, NWN offers a reasonable investment opportunity with a long history of dividend increases and a fair payout ratio. NWN is definitely worth investigating at the current levels. Let us hope that the stock price declines while you're doing the research on this company. Touc.

Please revisit Dividend Inc. for editing and revisions to this post.

Weyco (WEYS) Altimeter

Below is a chart of the Weyco (WEYS) altimeter. As we can see, WEYS trades in a range between 275 on the high end and just above 150 on the low end of the range. Given WEYS balance sheet and the products that it produces (Florsheim shoes) this company is worth investigating.

One consideration is the fact that WEYS has tremendously low trading volume. Additionally, this stock has only increased its dividend 10 years in a row which means that we can't be sure that the company can weather an true economic cycle. However, as mentioned before, this company has no debt and my be worth a second look. Touc.

Bank of Hawaii (BOH) Altimeter

The chart below is a representation of the Bank of Hawaii (BOH) altimeter. BOH has increased its dividend every year for 31 years in a row. As we can see, BOH's altimeter has been in a rising trend for quite some time.That trend was recently broken during the recent banking crisis.
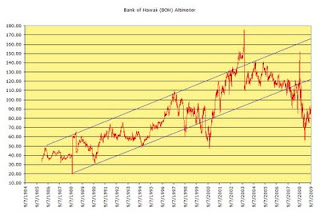
The channel that BOH has managed to fluctuate within suggests that the stock is overvalued at the high end and undervalued at the low end. The period of extreme overvaluation is reflected in 2003 and started to move in a declining trend to undervaluation when BOH increased the dividend from $0.19 to $0.30.

There are two periods of extreme undervaluation in the altimeter. The first level of extreme undervaluation hit bottom in October 2000. The second period was most recently in March of this year. If the stock were to go back to the "historical" low end of the range, BOH would be priced at $54 a share. Although we do not have an extensive history on the periods of extreme undervaluation, it could be inferred that, based on the altimeter, an investment in BOH while not risk free, could be considered low risk.

At least one hitch to my assessment on BOH, in terms of the altimeter, is the fact that the low in March 2009, around the 60 level, could be part of a normal low range that is being established for the stock. If the 60 level is the low end of a new long-term range, my best guess is that the 110 level is the upper end of the range. At the 110 level, BOH stock price would be $49.50.

Only time will tell whether the escalating failure of banks is going to spread even further. However, BOH has managed to fare better than most banks of a similar size. As a further indication of BOH's strength, the dividend increase in November 2008 suggests that management believes the company will survive through the present banking liquidation cycle. Regardless of BOH's strength, I wouldn't be surprised if BOH does not increase the dividend in November. However, if a cut in the dividend takes place then I would be more cautious on the company and the stock. Touc.

related articles:


Please revisit Dividend Inc. for editing and revisions to this post.

Wal-Mart (WMT) Altimeter

Below is a chart of Wal-Mart's altimeter. As mentioned before, the purpose of the altimeter, created by Edson Gould, is to determine the relative value of a company based on the quarterly dividend payment and the daily price of the stock or index.

Based on the above chart, we can see that WMT is traditionally overvalued between 1100 and 1200 level. Additionally, when WMT falls to the 550 level the company is considered undervalued. What should be noticed is the double bottom that took place in the 1995 to 1997 period. After that time, WMT took off like a rocket.

In the most recent period from 2007 to 2009, we can see that WMT is forming a similar double bottom. From this indication, we should look out for the stock to rise significantly over the next four years. The expected rise in WMT should be in spite of all the economic forecasts of a continued decline in the economy.

The chart below is my own interpretation of WMT if the company pursued a less aggressive policy of increasing the dividend at such a high rate.

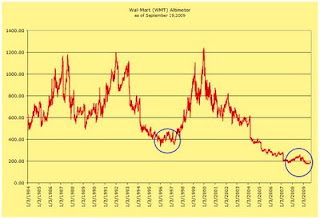
In the first chart, you can see that after 2004 WMT fell to an extreme level of undervaluation. The reason this occur is because WMT continued in increase the dividend at a high rate even though the company didn't have the earnings to support such increases. With diminished earnings, WMT issued more shares to raise capital to fund the dividend payments at the expense of per share earnings.
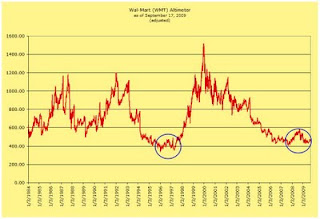
My model continues to increase the dividend every year but at a rate of 50% less than what WMT did from the period of 2004 to the present. This lowers the number of shares that need to be issued. In fact, my model would not have required the issuance of new shares to cover the dividend.

At the moment, we could consider WMT undervalued. However, keep in mind the fact that the continued issuance of shares in order to keep the dividend history intact undermines future earnings growth.

related article:

Please revisit Dividend Inc. for editing and revisions to this post.

Dow Jones Industrial Altimeter

When considering where we are it helps to see where we've been. Implicit in this thought is the idea that we use as many perspectives as possible in order to build context around our view. One such tool that is worth looking at is the Dow Jones Industrials Average Altimeter.

Historically, since 1871 (Cowles Commission Expectation of Individual Stocks), the altimeter has indicated that whenever the Dow Industrials went above the 30 range the market was overvalued and whenever the market was below 15 the market was undervalued. As illustrated in the chart below, since 1920 the Dow Industrials followed this pattern quite well until the breakout above 38.47 on June 13, 1995 (point X).

After the January 13, 1950 (point J) buy signal, the altimeter gave numerous sell signals from 1961 (point K) to 1972 (point R). At any point that the sell signals were given, except for 1961 (point K), you would have avoided the major market declines of the late 60's and throughout the 1970's. When the next buy signal was registered on December 13, 1974 (point S) the stock market was off to the races and never looked back.

From December 13, 1974 (point S) until the present we've been confronted with an unprecedented pattern change in the altimeter. Even though the pattern that was established no longer seems to fit previous indications, it is important to note that the indicator is giving us a massive head and shoulders technical pattern to watch for.

After the peak in the altimeter on August 25, 1987 at 38.24 (point V) and the subsequent crash that followed, the market bounced from the 1989 bottom (point W) at 21.14 to the 38.07 level in December 28, 1993. The declined that followed the 1993 peak signified that the 38 level was very important to watch for. Of course, after falling to the 1995 level of 32.88 (point X) the altimeter went to the unprecedented level of 68.13 in 1999.

Everything that has happened since 1999 has only cemented the significance of the 38 and 21 levels on a technical basis. The reversal of the decline from 1999 to 2003 at 36.06 (point X1; near 38) and the congestion, and subsequent crash, in 2007 led to the altimeter falling back down to 21 on March 9, 2009.

If we get lucky, we could see the Dow go back to the 38 level. This means that we could possibly reach the 10,901.44 on the index. After reaching the 38 level we should expect the stock market to decline at least to the 21 level again. However, the current trend is still indicating a downward trend since hitting the most recent peak of 33.53 on August 27, 2009.

Let's watch how closely the head and shoulders pattern is established. If we do complete a head and shoulder pattern, then we could expect that after reaching 10,901.44 the Dow will go back to 6024.48. If we go significantly beyond 10, 901. 44 then I'll have to reassess the situation at that time. Touc.


Please revisit Dividend Inc. for editing and revisions to this post.

Dow Industrials Altimeter

When considering where we are it helps to see where we've been. Implicit in this thought is the idea that we use as many perspectives as possible in order to build context around our view. One such tool that is worth looking at is the Dow Jones Industrials Average Altimeter.

Historically, since 1871 (Cowles Commission Expectation of Individual Stocks), the altimeter has indicated that whenever the Dow Industrials went above the 30 range the market was overvalued and whenever the market was below 15 the market was undervalued. As illustrated in the chart below, since 1920 the Dow Industrials followed this pattern quite well until the breakout above 38.47 on June 13, 1995 (point X).

After the January 13, 1950 (point J) buy signal, the altimeter gave numerous sell signals from 1961 (point K) to 1972 (point R). At any point that the sell signals were given, except for 1961 (point K), you would have avoided the major market declines of the late 60's and throughout the 1970's. When the next buy signal was registered on December 13, 1974 (point S) the stock market was off to the races and never looked back.

From December 13, 1974 (point S) until the present we've been confronted with an unprecedented pattern change in the altimeter. Even though the pattern that was established no longer seems to fit previous indications, it is important to note that the indicator is giving us a massive head and shoulders technical pattern to watch for.

After the peak in the altimeter on August 25, 1987 at 38.24 (point V) and the subsequent crash that followed, the market bounced from the 1989 bottom (point W) at 21.14 to the 38.07 level in December 28, 1993. The declined that followed the 1993 peak signified that the 38 level was very important to watch for. Of course, after falling to the 1995 level of 32.88 (point X) the altimeter went to the unprecedented level of 68.13 in 1999.

Everything that has happened since 1999 has only cemented the significance of the 38 and 21 levels on a technical basis. The reversal of the decline from 1999 to 2003 at 36.06 (point X1; near 38) and the congestion, and subsequent crash, in 2007 led to the altimeter falling back down to 21 on March 9, 2009.

If we get lucky, we could see the Dow go back to the 38 level. This means that we could possibly reach the 10,901.44 on the index. After reaching the 38 level we should expect the stock market to decline at least to the 21 level again. However, the current trend is still indicating a downward trend since hitting the most recent peak of 33.53 on August 27, 2009.

Let's watch how closely the head and shoulders pattern is established. If we do complete a head and shoulder pattern, then we could expect that after reaching 10,901.44 the Dow will go back to 6024.48. If we go significantly beyond 10, 901. 44 then I'll have to reassess the situation at that time. Touc.


Please revisit Dividend Inc. for editing and revisions to this post.