Below are the valuation targets for Hingham Institution for Savings (HIFS) for the next 10 years. Continue reading
- Japan
- Market Indicator
- Price Momentum Indicators
- Richard Russell
- Silver
- Speed Resistance Lines
- U.S. Dividend Watch List
Below are the valuation targets for Hingham Institution for Savings (HIFS) for the next 10 years. Continue reading
Below is the Coppock Curve for Hingham Institution for Savings (HIFS). Continue reading
The following is the breakdown of the Dogs of the TSX (here) in week 38, compared to other fundamental ratios. Continue reading
1940-2020: The Full Interest Rate Cycle
Reasonable assumption on interest rates should be done based on relative or comparable starting points. With interest rates at secular lows, we should only compare rate activity from the 1940 to 1980 period which was a secular rising trend while avoid comparing rate activity to the 1980 to 2008 period.
Fastest Rate Increase, From the Low
Below we compare the rate increase of the 3-Month Treasury from the secular low in 1940 at 0.01% to the rate increases from the 2011 low at 0.01%.
From the level of 0.01% to 2.39%, the rate of increase was exaggerated for the period from 2011 to 2019 compared to the period of 1940 to 1956. The currently level of volatility is not unexpected for the early phase of the secular rising rate trend.
Secular Trend Review
We have been consistent in our view that the secular trend in interest rates is up rather than down and that increasing interest rates are good for the market. Our view preceded the Federal Reserve’s policy of rate increases starting December 15, 2015.
“A single rate increase by the Federal Reserve in no way makes for a trend. However, markets often lead the way and what initially seems “bizarre” is only a natural change in regime, a change that we haven’t seen since the early 1940’s (December 16, 2015.).”
“We’ve only included the point in the interest rate cycle that corresponds to the phase that we are entering, coming from an all-time low to an eventual all-time high (November 15, 2015.).”
“Investors anticipating a general rise in interest rates should feel some comfort in knowing that most manager(s) in the utility sector are ready for what is to come. Rising interest rates are not an automatic death sentence for utility stock prices or earnings. In fact, the early stages of rising interest rates may see utility stocks match or exceed the returns of non-interest rate sensitive stocks, on a total return basis. Only when the outlook is cloudy will it become difficult to offer projections that are in line with prior expectations (September 4, 2014.).”
Cyclical Trend Review
In spite of the secular trend, we have also called the rate decline based on “price action” irrespective of the talk about what the Fed should or shouldn’t do.
On January 23, 2019, we provided our first downside targets for interest rates. At the time, we had the 3-month treasury slated for a potential downside (in the extreme) of 0.83% from the level of 2.45%.
On April 23, 2019, with the 3-month Treasury at 2.45%, we said the following: “If the current run of stability in rates is anything like the period of 2015 to 2016, we should see a sharp drop in rates as was seen in the period from September 12, 2016 to September 22, 2016. At that time, the 3-month treasury dropped from 0.37% to 0.18%, a decline of -51%.”
On December 6, 2019, with the 3-month Treasury at 1.53%, we said: “If the November 1, 2019 low, at 1.52%, is broken then we can reasonably expect at least another decline to the 1.30% level and maybe more before another rate cut by the Federal Reserve.”
On March 3, 2020, when the 3-month Treasury sat at 0.95%, the Fed decided to do an “emergency cut” in interest rates.
On March 16, 2020, when the 3-month Treasury sat at 0.24%, the Fed cut rates to zero.
All of the actions of the Fed were preceded by the change in the overall trend of the 3-month Treasury. Our take on what is next is below. Continue reading
Posted in 3-month, Interest Rate Monitor
Below is a graph of U.S. population compared to U-6 unemployment on a year-over year-basis.
see also:
Posted in Dow's Economic Indicator, population, U-6, Unemployment
On September 14, 2020, the S&P 500 Index closed at 3,383.54. To celebrate, we are going to review what Richard Russell’s Dow Theory Letters had to say about the market when the Dow Jones Industrial Average closed at 3,384.32 on August 4, 1992.
Russell said:
"...the nation's in a 'contained depression'."
"Interest rates have collapsed, consumers are gloomy, and nobody's taking out loans. That's exactly what happened during the Great Depression--with one big difference. Then the stock markets were crashing but today the markets are bullish. So how are the two periods different? As I interpret it, today's stock market is saying that somewhere ahead business is going to pick up and people will start buying again---unlike during the 1930s."
"for the first time since the Great Depression almost all the nations in the northern hemisphere are in various stages of a recession."
"...the widely publicized figure is that 40% of the 5,000 listed stocks have been downed by 30% or more. On that basis, some analysts are referring to 1992 as the 'year of the hidden bear market'..."
That was page one of six from the August 5, 1992 issue of Dow Theory Letters. Fascinating? History doesn’t need to repeat. However, good analysis starts with precedents first, as outlined by Charles H. Dow, and diverges afterward, not the other way around.
What was being said by other analysts is not too different from what we’re hearing today. We all know what has happened to the Dow since August 4, 1992.
The question of the reasons for our most recent purchase, comprising 15% of our portfolio, has come up. Below is what we’re seeing. Continue reading
Below are the valuation targets for Nacco Industries Inc. (NC) for the next 10 years. Continue reading
We executed the following transaction(s): Continue reading
We begin by reviewing the performance of last year’s list. The table below highlight various fundamental strategies and their performance using the top 5 companies.
| September 13, 2019 | ||
| Strategy | High | Low |
| Yield | -50.3% | 23.2% |
| P/E | 3.5% | -57.0% |
| Payout Ratio | -27.5% | -20.5% |
| P/B | 22.7% | -56.5% |
| Closest to Low | -15.0% | |
| S&P 500 | 11.1% | |
| Dow Jones Ind | 1.6% | |
| Top 5 companies except for Index |
||
The best performing strategy was low yield while low P/E lost tremendous value in one year. Rollins (ROL) gained 57% in a year while Alliance Resource (ARLP) with P/E of 4.56 lost 80%.
U.S. Dividend Watch List: September 11, 2020
A substantial market correction occurred which increased the number of company trading near their yearly low. Below are companies that are current and former Dividend Achiever. Continue reading
Posted in Dividend Achiever Watch List, Dividend Achievers, Dividend Watch List
Tagged members
“Remember that the industrial and railroad stocks used in the averages are essentially speculative. Only to a limited extent are they held for fixed income by people to whom safety of the principal should be the main consideration, and their holders are constantly changing. If they were not speculative they would be useless for a stock market barometer. The reason why railroad stocks during 1919 did not share the bull market in the industrials was that, through government ownership and government guaranty, they had in a real sense ceased, for the time at least, to be speculative. They could not advance in any market, bull or bear, more than enough to discount the estimated value of that guaranty.”
-William Peter Hamilton, 4th Editor of the Wall Street Journal (The Stock Market Barometer. Harper. 1922. page 186.)
Government’s Impact on Risk
According to Hamilton:
“It is plain, then, that with a government guaranty of a minimum return, based upon the average earnings of three years ended June 30, 1917, the railroads entered the fixed income class (page 189.).”
-William Peter Hamilton, 4th Editor of the Wall Street Journal (The Stock Market Barometer. Harper. 1922. page 189.)
Many are arguing that the government purchase of assets along the widest spectrum of risk is the cause of a more speculative investing environment. The work of Hamilton, with the citation of rail stocks after nationalization, point to the opposite outcome, suggests that if the government is so influential then markets should become more sedated rather than increasingly restive.
Fannie Mae: The Evidence
The proof of the strength in the claims made by William Peter Hamilton can be found in the share price of the Fannie Mae and the 30-Year Treasury from 1977 to 2020.
As soon as Fannie Mae lost the implicit guarantee and achieved the actual guarantee of government support the share price has gravitated to tracking the 30-Year Treasury. The chart below shows Fannie Mae from 2013 to 2020 being unable to track beyond the 30-Year Treasury.
For now, Fannie Mae has become a bond even though it is possible to vacillate between $0.50 to $6.00 (+11,000% or -91.67%).
William Peter Hamilton
Often cited by Dow Theorists Robert Rhea and Richard Russell, Hamilton was an intense follower of the writings of Charles H. Dow, co-founder of the Wall Street Journal.
see also:
On this date in 1888, the Chicago, Milwaukee and St. Paul Railroad skipped their dividend payment. This led to the stock price “crashing” –7.87%. It was indicated that net earnings declined from $3,662,930 in 1887 to $1,875,925 in 1888, approximately -48% year-over-year. According to the New York Times:
“Officers of the St. Paul Company, the same who have been dealing out rose-colored fictions for months past, were kept busy throughout the whole of the day endeavoring to explain why they had been pursuing such a deceptive course. (New York Times. “Wall-Street Stirred Up: Bulls, Bears, And Every Body Feared A Panic. The Startling St. Paul Railroad Discoveries Proved a Sensation Indeed--The Stock's Big Drop.” September 14, 1888. page 2.).”
Apparently, St. Paul had a history of accounting that suggested the dividend cut was not, or should not have been, a shock. According to the New York Times:
“The overwhelming losses in net earnings (at the rate of $3,500,000 a year) were not to be disguised by even the phenomenally remarkable bookkeeping methods that have made St. Paul statements the target for derision and denunciation for years past (New York Times. “The First to Confess: Wall-Street Is Treated To a Big Sensation. The St. Paul Railroad Forced By Bad Earnings To Abolish Dividends-Tremendous Losses”. September 13, 1888. page 1.).”
At the time, the cut in the dividend sent shockwaves through the market. However, St. Paul happened to be the average underperforming railroad at the time, as indicated below:
Posted in On This Date
In October 2019, Morningstar.com published their DividendInvestor which contains their Income Bellwether Watchlist. Below is the performance of the stocks based on the top highest and lowest dividend yield from September 11, 2019 to September 11, 2020.
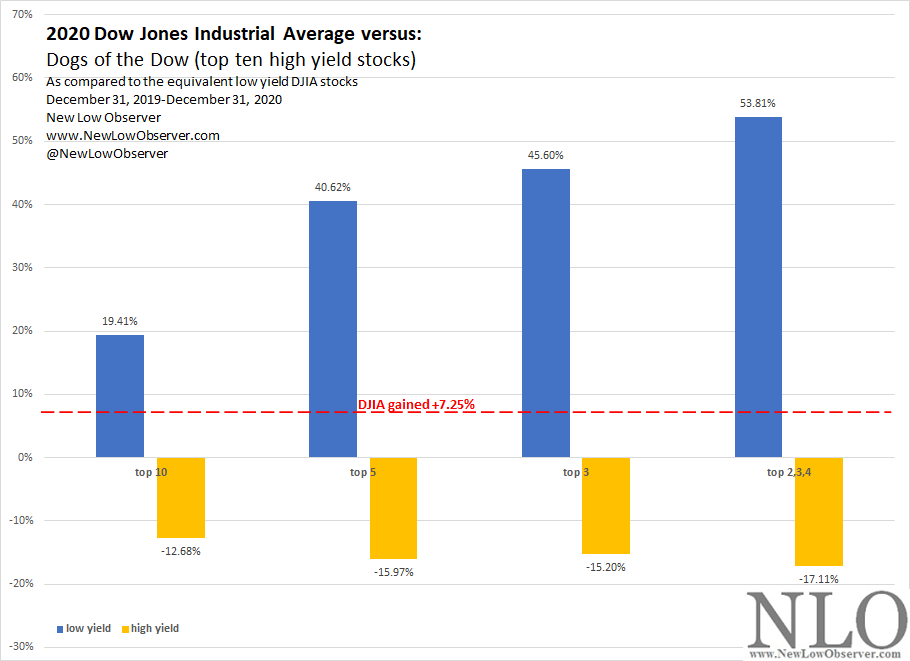
As the data continues to demonstrate, low yield generally outperforms high yield. This has been resoundingly shown in our Dogs of the Dow in the period from 1996 to 2019.
see also:
Posted in Dogs of the Dow, Income Bellwethers, Morningstar
Below are the valuation targets for Spire Inc. (SR) for the next 10 years. Continue reading