Below are the valuation targets for National Grid Plc (NG.L) for the next 10 years. Continue reading
-
Topics
Archives
-
-
Recent Posts
-
-
-
-

Below are the valuation targets for National Grid Plc (NG.L) for the next 10 years. Continue reading
Posted in 10-year Targets, Altimeter, NG.L
Can you spot the classic “value” purchase?
Below are the shares that Berkshire Hathaway added to their portfolio and the lowest price within the fourth quarter of 2020. The last five years are shown for the relative value for the respective stocks. The stocks are shown in order of largest increase to Berkshire Hathaway holdings.
Verizon (VZ)

T-Mobile (TMUS)

The Kroger Co. (KR)

Merck & Co. (MRK)

Marsh & McLennan Co. (MMC)

AbbVie Inc. (ABBV)

Bristol-Myers Squibb Co. (BMY)

Chevron Corp. (CVX)

RH (RH)

Posted in BRK, BRK-A, Warren Buffett
Below are the valuation targets for Informa Plc (INF.L) for the next 10 years. Continue reading
Posted in 10-year Targets, Altimeter, INF.L
Below is a chart of Telia Co. AB from 2001 to 2021 reflecting the year-over-year (YoY) percentage change. This assessment reviews the probability of performance in the coming year(s).
We have received questions about the US Dollar index and while we are not specialists in the Forex market, the tools we used to assess equity markets, to a certain degree, could be leveraged on this topic.
There's a high probability that unlimited amounts of money printing will lead to weaker currencies and we are seeing assets moved away from the US Dollar to other alternatives such as equities, real estate, precious metal, and even crypto currencies.
The US Dollar peaked in March 2020 at 103 but has fallen -13% since then. Double digit fluctuations in currencies is substantial and should be examined.
To see how far this downward trend can go, we have utilized the Year-Over-Year model (YoY) and reviewed the past for reference.
The chart below shows the year-over-year percentage change of the US Dollar Index, in this case we use DX-Y from Yahoo Finance. We can see that average change is virtually flat at 0%.
Applying +/-1 standard deviation range to establish a trading range of +/- 10%. Currently the index is at -9% for the year and approaching a bottom of the boundary. Given that the Federal Reserve has no intention to stop printing money in the near term, we forecast that this index could reach -15% before any reversal to the declining trend.

As a reference point, we can look back at the financial crisis time frame when the index registered a triple bottom between 2008-2011.
It can be argued that we are in a similar environment where the Fed must print their way out. A near-term bottom could be in place but a risk of double or triple bottom is possible based on the precedence.


We're not as worried about the decline to a new low as much as we are concerned about a sudden rise to the upside.
The following are the established Bitcoin cycles since 2010 which are instrumental in our forecasting of the market price for Bitcoin going forward.
Up Cycles

Down Cycles

Cycle charts and Future Targets Continue reading
Posted in Bitcoin, cycle analysis
Below are the valuation targets for National Bank of Canada (NA.TO) for the next 10 years. Continue reading
The bull market continues to push forward as we end the week with the Dow Jones Industrial Average and Dow Jones Transportation Average closing at their all-time high. The recent bullish Dow Theory signal should not be ignored.
Reviewing our list from last year, the best performing strategy was high P/B with gain of +24.30%. Gains were driven by two stocks with high P/B, Xilinx (XLNX) +62% and Erie Indemnity (ERIE) +60%. On the opposite spectrum, High P/E had the worst performance with State Auto Financial (STFC) declining –44%. Reviewing the table below, the growth strategy continues to outperform.

U.S. Dividend Watch List: February 12, 2021
Bull markets leave little room for companies to trade near their 52-week low. Because of that, we have to broaden the range of stocks that we track from within 10% of the 52-week low to 20% of the 52-week low.
Despite that, there are plenty of great companies with long track records of dividend payments and increases on this list. Continue reading
Posted in Dividend Achiever Watch List, Dividend Achievers, Dividend Watch List
Tagged members
Below is a chart of the Gold Stock Indicator as of February 12, 2021: Continue reading
Below are the valuation targets for Ashtead Group Plc (AHT.L) for the next 10 years. Continue reading
Posted in 10-year Targets, AHT.L, Altimeter
Below are the valuation targets for Pennon Group Plc (PNN.L) for the next 10 years. Continue reading
Posted in 10-year Targets, Altimeter, PNN.L
Below are the valuation targets for RELX Plc (REL.L) for the next 10 years. Continue reading
Posted in 10-year Targets, Altimeter, REL.L
Below is a chart of Accelya Solutions from 2001 to 2021 reflecting the year-over-year (YoY) percentage change. This assessment reviews the probability of performance in the coming year(s).
Posted in Accelya Solutions, YoY
There is much discussion about the stock market crash of 1929. By default, that discussion centers around the collapse of the Dow Jones Industrial Average (as the S&P 500 didn’t exist at the time) which declined -89% from the 1929 high of 381.17 to the 1932 low of 41.22.
Little discussed is the collapse of the Dow Jones Utility Average. At the peak of the Dow Jones Utility Average, also topping in 1929, the index declined -92.67%. While the decline in the Dow Jones Industrial Average lasted approximately 2 and a half years, the final low in the Dow Jones Utility Average did not materialize until 1942, approximately 11 and a half years later.

While on the road to recovery from the 1932 low, the Dow Jones Industrial Average managed to exceed the 1929 peak in late 1954 and never looked back.

Meanwhile, The Dow Jones Utility Average has had a different path. From the 1942 low, The Dow Jones Utility Average did not manage to attain the 1929 high until 1963. By 1965, the Dow Jones Utility Average achieved a peak and fell to a low of 57.93 in September 1974.

Worse still, the Dow Jones Utility Average did not break above the 1929 high for good until 1984, creating the most unparalleled “cup and handle” technical formation. You would think that the breakout from the 1929 high would be significant enough to not worry about revisiting such a level again. However, the Dow Jones Utility Average came within 20% of the 1929 peak on October 9, 2002.
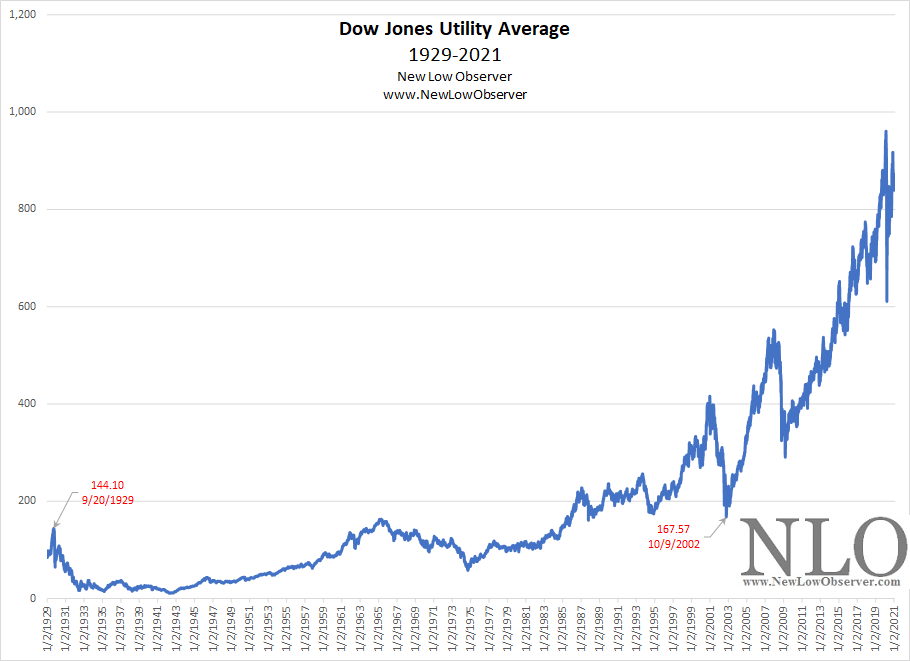
The decline in the Dow Jones Utility Average is not unlike the decline in the Nikkei 225 Index which peaked in 1989 at 38,876.94 and bottomed in 2003 at 7,607.88 fourteen years later (or at 7,054.98 in 2009 at 20 years after the peak). There is another similarity in the Dow Jones Utility Average and the Nikkei 225 Index.
After the collapse of the Nikkei 225, it was realized that the complex crossholding relationship of publicly traded companies made it difficult to unwind intricated positions in stock of insolvent or illiquid companies. The complexity of the relationship is illustrated below.

Likewise, the Dow Jones Utility Average list of companies, after 1929, had similar cross holding relationships as seen in the illustration below.

Highlighted in red is Electric Bond & Share Company. Below is the Electric Bond & Share Company web of business relationships.

In the example below, the violent rise and subsequent collapse in the share price of all publicly traded utilities made it difficult to unwind positions to allow for sale of assets or loans based on secured assets related to the actual business.

Electric Bond & Share Company had a share price increase from $45 in 1926 to as high as $475 in 1929. Only to later fall as low as $1 in 1932. Surviving such a rapid rise and fall wasn’t something that could have happened without considerable intervention.
Behind most utility companies was General Electric (GE) with outright ownership or majority stakes in the businesses. Ultimately, “orderly” government reorganization of the industry is what allowed General Electric to survive while the unwinding process dragged on for decades in the utility industry.
When there is discussion of the ravages of the stock market crash of 1929, keep in mind this story of the Dow Jones Utility Average. The decline and recovery is worth your time and consideration.
Posted in Dow Jones Utility Average, GE, General Electric, utilities
Below are the downside targets for the Nasdaq Composite. Continue reading