Author Archives: nlo-admin

Nasdaq 100 Watch List: November 4, 2011

Below are the Nasdaq 100 companies that are within 15% of their respective 52-week lows. Stocks that appear on our watch lists are not recommendations to buy. Instead, they are the starting point for doing your research and determining the best company to buy. Ideally, a stock that is purchased from this list is done after a considerable decline in the price and rigorous due diligence.

Symbol Name Price P/E EPS Yield P/B % from Low
BMC BMC Software, Inc. 35.97 14.74 2.44 0 4.02 3.28%
RIMM Research In Motion Limited 18.97 3.46 5.48 0 0.99 4.63%
NIHD NII Holdings, Inc. 23.83 13.48 1.77 0 1.28 4.79%
QGEN Qiagen N.V. 13.81 25.11 0.55 0 1.24 5.82%
CHRW C.H. Robinson Worldwide 68.72 26.74 2.57 1.70% 8.91 10.30%
MSFT Microsoft Corporation 26.25 9.54 2.75 3.10% 3.76 10.99%
EXPD Expeditors Int'l of Was 44.21 24.43 1.81 1.20% 5.03 12.69%
SIAL Sigma-Aldrich Corporation 63.58 17.66 3.6 1.10% 3.59 13.17%
LIFE Life Technologies 40.08 21.04 1.91 0 1.6 13.54%
ILMN Illumina, Inc. 32.77 42.01 0.78 0 3.62 14.01%
FSLR First Solar, Inc. 49.59 8.14 6.09 0 1.03 14.31%
MYL Mylan Inc. 18.51 19.3 0.96 0 2.31 14.47%
VOD Vodafone Group Plc 27.92 11.59 2.41 6.90% 1.02 14.85%

Watch List Summary

At the top our list this week is BMC Software (BMC).  Yahoo!Finance describes BMC Software (BMC) as a company that "develops software that provides system and service management solutions for enterprises in the United States and internationally."  According to Dow's Theory, BMC is considered fairly valued at $46.97.  Because we're technically in a bear market, our expectation is that $41.11, or 14.28%, is the upside target in the coming year.

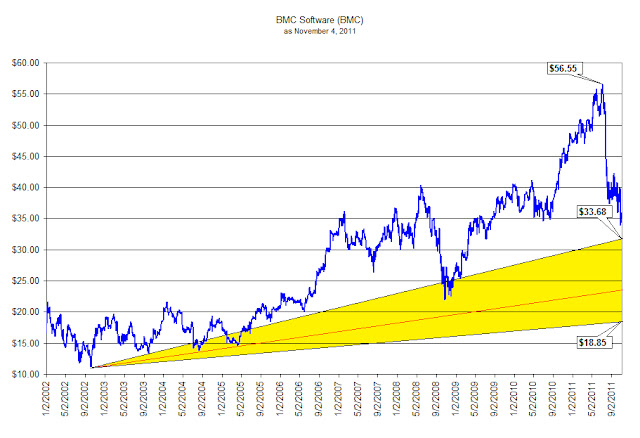
Regarding downside targets, we're going to use Edson Gould's speed resistance lines.  Currently, BMC Software has a conservative downside target of $33.68 and an extreme downside target of $18.85.  The downside target of $18.85 is roughly 47% below the current price.  This is an acceptable level for where the stock could go and still be considered worth holding. 

In general the fundamentals for BMC seem strong. According to Value Line Investment Survey, BMC Software (BMC) has an upside target of $43.29 based on 2010 full year cashflow of $3.33. However, a strategy for accumulating the shares is necessary for any downside risk remaining.

Watch List Performance Review
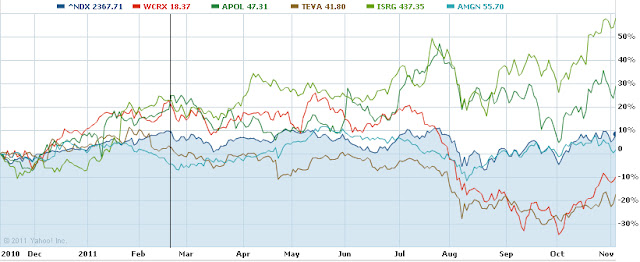
In our ongoing review of the Nasdaq 100 Watch List, we have taken the stocks from our list of November 10, 2010 (found here) and have checked their performance one year later. The companies on that list are provided below with the closing prices from November 10, 2010 to November 4, 2011.

Symbol Company 2010 2011
change
WCRX Warner Chilcott
20.89
17.01
-18.57%
APOL Apollo Group
36.84
47.24
28.23%
TEVA Teva Pharma
50.81
40.93
-19.44%
ISRG Intuitive  Surgical
277.96
432.23
55.50%
AMGN Amgen
54.93
55.17
0.44%
Average return
9.23%
NDX Nasdaq 100 2187.74 2356.32
7.71%

The black line drawn in the month of February 2010 indicates the period when three of the five stocks had achieved annualized gains of 60% or more.  Apollo Group (APOL) and Intuitive Surgical (ISRG) had annualized gains of nearly 80% in the period covered.  Taken as a whole, the entire portfolio achieved an annualized gain of nearly 40% near the middle of February 2010.  In the end, it was Apollo Group (APOL) and Intuitive Surgical (ISRG) that carried the top five to an average gain of 9.23% over the last year.  The top 5 narrowly beat out the Nasdaq 100 by 1.52%, which is fine by us.

A Strategy is Needed for Lagging Gold Stocks

For gold stock investors, a timing strategy is the most effective way to match or beat the coming metal price increase. Among our caveats, we’re excluding junior and exploration mining companies which will either go out of business, experience share price booms or get acquired by peers or the majors. What follows is our examination of whether the lagging gold stocks, the inability of gold stocks to perform equal to or greater than the price of physical metal, is unique to our time or a fundamental hallmark of gold bull markets.

There is considerable discussion about the divergence between the price of gold and gold stocks. In the divergence, the price of gold has tended to rise to new highs while gold stocks (majors) either trade in a range, decline or increase at a tepid rate compared to the physical metal.

Some argue that due to the divergence, gold stocks represent the best investment opportunity because inevitably, the stocks will catch up with the metal. Others say that, the lack of confirmation of gold stocks to exceed prior highs is an indication that the metal is overvalued or needs to decline.

Unfortunately, although both points seem well reasoned (along with many other explanations), evidence from the previous gold bull market suggests that gold mining majors typically underperform the metal. The primary source that we’re drawing from is Richard Russell’s Dow Theory Letters from 1970 to 1979 with data points confirmed in Barron’s and Kitco.com for the respective dates.

On numerous occasions, Richard Russell would express his concern for the divergence between the price of gold and gold stocks. Below are Russell’s observations of the failure of gold stocks to follow the price of gold higher:

Meanwhile, despite the recent highs in the price of gold bullion, the gold stocks are not keeping up with the price of the yellow metal. I have received many calls from subscribers asking why.” (Richard Russell, Dow Theory Letters, May 17, 1972, Letter 529, page 6.)

The general feeling seems to be that the gold stocks have been discounting [falling in advance of] a decline in bullion.” (Richard Russell, Dow Theory Letters, September 27, 1974, Letter 610, page 6.)

“‘What’s happening to the shares’ I am asked. ‘Why don’t they move with gold?’” (Richard Russell, Dow Theory Letters, January 2, 1975, Letter 618, page 5.

At the bottom of the chart is the Barron’s Gold Average (stocks). This may move, too, but this Average has a long way to go to hit its 1974 high while gold could better the old 200 high easily. That should tell us something. And it’s the reason I’ve been saying all along-gold, not gold stocks.” (Richard Russell, Dow Theory Letters, November 9, 1977, Letter 713, page 5.)

Since Barron’s Average is very heavily weighted in favor of ASA, we are looking to a large extent at the relative performance of the S. African gold shares against bullion. The picture is clear enough. The market, since mid-1974. has preferred bullion to the gold shares. And who am I to argue with the market? That’s the reason I’ve been recommending gold, not the shares.” (Richard Russell, Dow Theory Letters, February 17, 1978, Letter 722, page 6.)

Since late-January the gold stocks have been reactionary whereas gold has been hitting new 1977-78 highs. In March both stocks and the metal declined, and as you can see the stocks broke below their February lows. Yet the metal has not confirmed on the downside, holding well above its February low. I take this non-confirmation as a bullish indication. I think it is telling us that the metal will not respond to gold share weakness, and it is telling us that the metal ‘wants’ to go to new highs. Whether the stocks will follow is another story.” (Richard Russell, Dow Theory Letters, April 5, 1978, Letter 726, page 6.)

My chart of gold and the gold averages (see page 6) is now showing a dramatic divergence. The gold stock average has broke” below its November low, but the bullion price has held well above that point.” (Richard Russell, Dow Theory Letters, May 5, 1978, Letter 729, page 5.)

This non-confirmation between gold and the gold stock average which I discussed in the last Letter is still in force. Many feared that the reactionary tendencies [decline] in the gold shares were calling for a correction in gold. For this reason many advisors have been telling their clients to sell their gold or even short gold. The consequences have been unhappy for the sellers, disastrous for the shorts.” (Richard Russell, Dow Theory Letters, November 1, 1978, Letter 742, page 5.)

My chart of gold bullion (daily) and the Gold Stock Average (GSA) documents the extraordinary divergence which continues to build between gold and GSA. Why did gold and GSA rally in tandem up to the October highs and why are the gold shares so

reluctant now?” (Richard Russell, Dow Theory Letters, February 28, 1979, Letter 751, page 7.

My chart of daily gold and the gold stock average (GSA) continues to picture divergence, with Campbell Red Lake and ASA stubbornly refusing to move back to their October highs.” (Richard Russell, Dow Theory Letters, July 5, 1979, Letter 760, page 6.)

I obviously cannot tell at this time whether gold is going to surge above 307 to a new high- or whether gold is in the process of topping out. The gold stocks have been weak, and my gold stock average has broken below the three minor bottoms. But so far, even weakness in the gold shares has not rubbed off on the metal.” (Richard Russell, Dow Theory Letters, August 15, 1979, Letter 763, page 6.)

To add to the consternation of gold stock investors, the period after the peak in the price of gold in January 1980 showed gold stocks held up better than the metal. This threw off “seasoned” gold investors because it gave the false impression that gold’s collapse would recover somehow. The following is Russell’s comments on this matter after the peak:

The gold stocks did not act during the 1980 decline the way they did during the 1974 debacle. This time they tended to hold very well. Now they are looking bullish (despite the many troubles, the increasing troubles in So. Africa). The shares, in other words, show good relative strength against the metal. This is a good sign for gold in general.” (Richard Russell, Dow Theory Letters, June 4, 1980, Letter 784, page 5.)

Although gold stocks are a leveraged play on the price of gold, there are critical points in time when gold stocks should be bought and then sold in order to take advantage of the leveraged characteristics. Those who buy and hold gold stocks for the “long term” will be disappointed with the performance as compared to the price of gold. Therefore, it is necessary to have a timing indicator that will highlight the best times to invest in gold stocks.

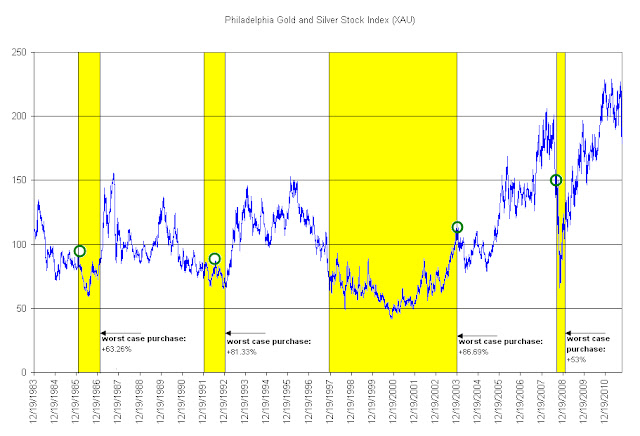
Below we have constructed a gold stock indicator based on the Philadelphia Gold and Silver Stock Index (XAU) which reveals the best times to accumulate and dispose of gold stocks. The points above the red line indicates the time to sell gold stocks and the points below the green line indicate when to buy gold stocks. We’ve taken the liberty of considering a sell indication whenever the indicator first reaches the red zone on a move to the upside and a buy/accumulate when the indicator first falls to the green line on a move to the downside.
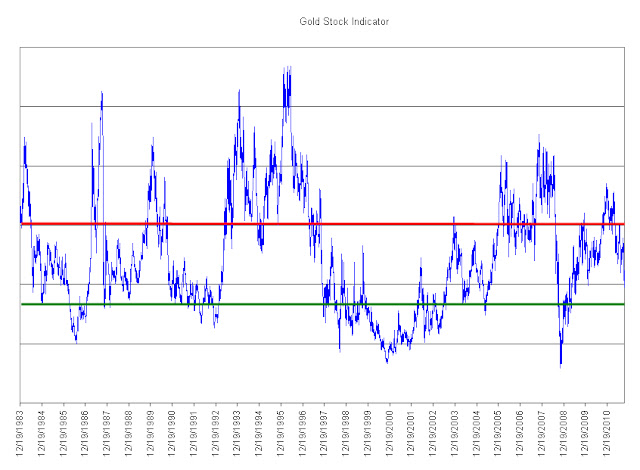
On average, sell indications occurred after a +52% increase in the XAU index. This does not account for the individual performance of gold stocks that are constituents of the index. The consistency of our Gold Stock Indicator reflected the best times to acquire the major gold stocks as well as the most ideal times to sell the gold stocks.
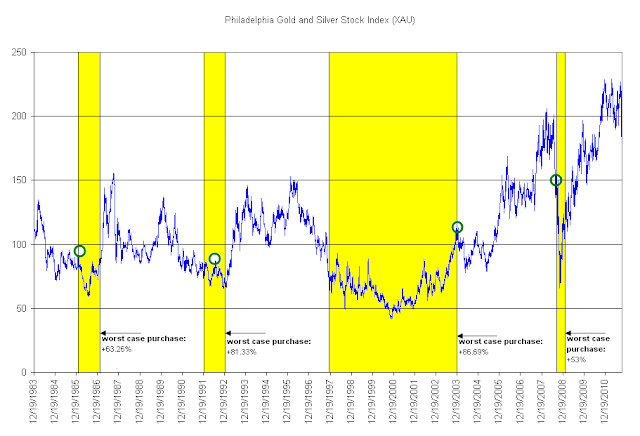
On the chart of the Philadelphia Gold and Silver Stock Index (XAU) above, we have shown where the indicated “buy/accumulate” recommendations would have taken place in yellow. The green circles show what would have happened if the purchase occurred at the worst possible time in the given period and is measured to the respective peaks in the XAU index soon after. As mentioned in many prior articles, we always account for at least -50% downside risk with any investment position that we take. This appears to be a minimum requirement when applying our indicator to the purchase of constituents of the Philadelphia Gold and Silver Stock Index (XAU).

For an investor who wishes to accumulate gold shares from within the XAU index, they would benefit from well timed purchases rather than getting whip-sawed by a wildly gyrating index that will inevitably underperform the price of gold in the “long-term.” We have identified the top five stocks that are likely to outperform the XAU index when the next buy signal is given. The five companies are AngloGold (AU), Yamana Gold (AUY), Gold Fields (GFI), Randgold (GOLD) and Royal Gold (RGLD).

The obvious alternative to buying gold stocks is with the physical asset. The paper version of gold is the SPDR Gold Shares (GLD). Although not truly tested through a full gold bull and bear cycle, GLD remains the among the most popular ways to “invest” in the physical asset. Our preference is for the non-paperized version of gold in the form of one-ounce coins.

As has been demonstrated in the gold bull market from 1970 to 1980, gold stocks (the majors) will generally underperform the price of gold. Those who are bound and determined to buy gold stocks can pursue the juniors and explorers which provide a wide range of outcomes that are independent of the price of gold (but helped by the rising value of gold) based on new discoveries, getting acquired or going bust. The alternative, buying the majors, should be done with a well constructed strategy that does not rely on hold-and-hope.

Dow Theory: Market Behaving as Expected

On August 9, 2011, we proposed that a bottom had been established in the market. Additionally, we proposed what the upside targets were based on Dow Theory.

Our assessment of where the market bottom was (based on the August 8th low) at 10,809.85 was off by 154.55 points, or 1.42%, when the Dow Industrials reached the lower level of 10,655.30 on October 3, 2011.

The purpose of pointing out bear market rally targets is to indicate where the market is expected to go on the upside. So far there is only one upside target left from the August 9th article. All that has taken place since then has been in alignment with classical Dow Theory.

On October 15, 2011, we wrote an article titled "Dow Theory: Bullish Implications." In that article we said the following:

“The coming market volatility will provide great opportunities for traders and allow investors a chance to cash out of otherwise undesirable positions and take profits. Our expectation is that the Dow will go to the July 2011 highs before struggling at the May 2011 highs.”

Historically speaking, daily gains of 2%-3% or more in the Dow Industrials is reflective of an unhealthy market. We are repeating that the current run is a golden opportunity to shed unwanted positions. It is hoped that long-term investors are in positions that are compensating for the wait, through the reinvestment of dividend income.

We’re anxious to see whether or not the Dow Industrials and Dow Transports can exceed their respective 2011 highs. Such a breach would indicate an end to the current cyclical bear market run and the beginning of a cyclical bull market. However, the overhang of a secular bear market, marked by the October 2007 high, provides considerable resistance to even higher levels.

Please consider donating to the New Low Observer. Thank you.

In the News: October 30, 2011

Please consider donating to the New Low Observer. Thank you.

Richard Russell Review: Letter 713

This review of Richard Russell’s Dow Theory Letters is dated November 9, 1977 when the Dow Jones Industrial Average was at 818.43 and the Dow Jones Transportation average was at 206.56.
  
Dow Theory
The first topic addressed by Richard Russell is Dow Theory.  On this topic, Russell says the following:
THE PICTURE: As far as I’m concerned, as far as my studies of the Dow Theory are concerned, a valid primary bear market signal was given when, on October 24 [1977], the Transportation Average confirmed the prior bearish indications of the Industrials. There are always those who cry, ‘The signal was late, it was too late!’ But no competent Dow Theorist in history ever waited for an actual bull or bear signal before taking action! For instance, we bought stocks in December, 1974 before the 1975 bull market signal, and we sold our stocks in March and April of this year well ahead of the October, 1977 bear market signal. We bought and sold on many clear indications, and the final Dow Theory signal merely confirmed what we had suspected and had acted upon.”
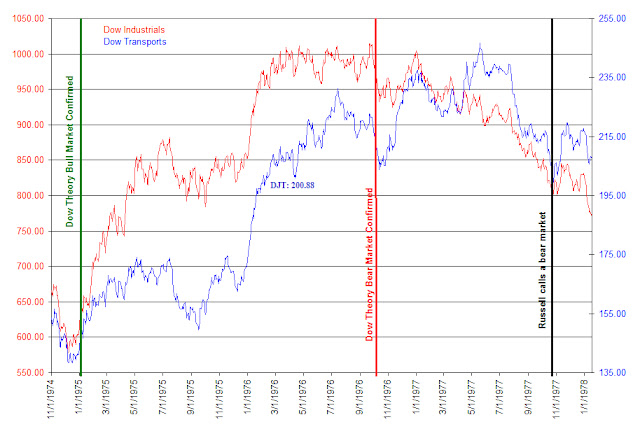
First, we’d like to address when a bear market signal is most likely to have occurred after the bull market signal that was confirmed in January 1975. From our perspective, the bear market was signaled on October 5, 1976 for the Transports and October 8, 1976 for the Industials when both indexes fell below the late August 1976 lows.
For whatever reason, Russell acknowledges that the call was late but doesn’t confirm how late he was.  Looking back at the October 16, 1976 issue of Dow Theory Letters  (Letter 678), in the first issue after we believe the bear market began, Russell makes no reference to the dual violation to the downside by both indexes.  Russell does allude to the Transportation Average level of 200.88 which he believed the market to be “weak” if the index fell below such a point.  On October 16, 1976, Russell said the following:
On the other hand, if the 200.88 level is broken, I would take this as a sign of unusual weakness, and I would take an even more cautious stance towards the market (which means selling more stocks and upping the bond portion of your portfolio even further.”
Naturally, there is a high level of inconsistency in suggesting that he would lighten up on his stock holdings if the Transportation Average fell below 200.88.  In the November 9, 1977 issue, Russell claimed that at the time the Transports fell below the indicated level he “sold our stocks in March and April of this year well ahead of the October, 1977 bear market signal.”
Although done in hindsight, our interpretation, almost a full year ahead of Russell’s call of a bear market, would have sheltered the investor from 3 times the loss.  This is consistent with our Dow Theory bull market indication in July 2009 and our more recent bear market call on August 2, 2011 (all NLO Dow Theory Bull Market articles) contrasted with Russell’s many bull and bear misinterpretations from March 9, 2011 (as partially outlined here).
The difference in Dow Theory Bear Market interpretations to the March 6, 1978 low:
Date
Transports decline
Industrials decline
Russell:
10/24/1977
-1.20%
-7.43%
NLO:
10/8/1976
-4.89%
-22%
Ironically, Russell says the following of those skeptical of the Dow Theory bear signal on October 24, 1977:
…others said that if it was indeed a bear signal, then probably the greatest portion of the market slide was over anyway. Two days after the bear signal, the market rallied sharply, as if in disbelief.
Since Russell’s call of a bear market was in fact long after the majority of losses were incurred, he only furthered the skepticism and misinformation of a useful tool for investors and businesses alike.  From the March 6, 1978 low to the April 27, 1981 high, the Dow Industrials increased by 37.87% while the Transportation Average increased 119.71%.  Alternatively, the Dow Industrials increased 23.17% and the Transports increased 117.55% after Russell’s indication that a bear market began on October 24, 1977.
Steps to a Dow Theory Bear Market signal:
  • July 14, 1976 Transports hit new high 231.27 but unconfirmed by Industrials
  • Sept. 21, 1976 Industrials hit new high at 1014.79 but unconfirmed by Transports
  • Oct. 8, 1976 both indexes fall below the late August lows-Bear Market begins
On page 3 of the DTL, Russell starts a Q&A with a question that has a very interesting answer:
Question: Suppose we get a rally that turns out to be a huge advance? Then what, Russell?
“Answer: We have a number of ‘fail-safes’ that work on either the bull side or the bear side of the market. The one I’m thinking about in particular is my study of the three moving averages of the Dow. At this juncture, the 13-week MA is a whopping 71 points below the 50-week MA, and we would need a crossing to get a major bull signal. Furthermore, the 4-week MA (short-term MA) is at 814, 29 points below the 13-week MA (intermediate-term) which is at 843. We need a crossing of the 4-week MA above the 13-week MA merely to get a ‘buy-alert.’ That would take time. So in the absence of a full over-sold bottom, I would say, ‘Skip any rally that may be forthcoming, or wait for the Dow’s moving averages to cross.’
There is a concern that we have regarding this section of Russell’s letter.  First, a “fail-safe” provision should address what actions to take if investments don’t work out.  Being out of stocks altogether isn’t investing nor is it working towards compounding, an overarching, albeit conflicting, theme in Russell’s work.  Therefore, Russell’s “fail-safe” observations based on a moving average requires reacting to a lagging indicator which compounds the delay in taking advantage of investment opportunities.  In fact, using such an approach causes investment activity, or lack thereof, to be made at the worst possible time.
In general, the use of moving averages for buy indications seems to be in contradiction to Dow Theory.  As pointed out earlier, moving averages are lagging indicators whereas the use of Dow Theory is supposed to act as a leading indicator.  Although Dow Theory provides bull or bear market indications not buy and sell recommendations, it can be effectively used to navigate market gyrations.  Based on the performance of the markets after Russell’s call of a bear market, it is clear that the mixing of moving averages and Dow Theory led to conflicting ideas of market direction that allowed Russell’s “Great” Depression bias to become the default reaction.
Treasuries
On page 4, Russell gives a quick blurb that had been overlooked for a long time in the mainstream media until recently.  Russell says the following:
I might also mention that if the public became wary of the banking system, there could be a major move out of bank deposits and into Treasury bills.
This has been the story of our experience in the market since 2008.  Furthermore, as the European Union struggles with their less than integrated banking system, demand for Treasuries grows.  This is in stark contrast to the belief that gold is king when there is a banking crisis.  We believe such a view is a holdover from when countries propped the price of gold with a gold standard.  The decline of gold and gold stocks in 2008 shows that there is another horse in the race for financial “safety.”
Gold & Swiss Franc
Russell points out something which seems extremely relevant to any investor in gold and that is the relationship between gold, gold stocks and the Swiss franc.  Russell says the following:
Now here’s what nobody (or let’s say very few people) know.  If I asked you “How’d you like to own Swiss francs at the early-1974 price?”  you’d probably jump at the chance.  Why would you jump?  Because the Swiss franc has been a hot item, a glamour currency.  Look at my next chart (bottom of p.5).  Note that the Swiss franc was about 31 cents in early-1974.  Gold at that time was $166 per ounce.  All right, the franc is now 45 cents or about 45% above its early-1974 price, in terms of dollars.  But gold is roughly the same price as it was in early-1974!  Now what the hell makes the Swiss franc better than gold?  The irony is that the Swiss franc is highly valued because it has such a high level of gold backing.
Nothing could be more instructive than the review of the price of gold, gold stocks and Swiss francs during what was perceived to be a gold bull market. Few gold bugs will acknowledge the amazing decline in the price of gold from early 1975 to the low of 1976.  The decline was nearly 50% of the peak price and lasted nearly two full years.  Likewise, the Barron’s Gold Average lost nearly 66% from the high achieved in 1974 to the low near mid-1976.  The Swiss franc, on the other hand, remained in the a narrow trading range or moved higher.
Russell was correct to question “…what the hell makes the Swiss franc better than gold?  Although Russell never mentions it, by pointing out the “uncharacteristic” rise of the Swiss franc at the time, we gathered that the activity of the Swiss franc implies that it is an indicator for the longer-term price of gold.  Because we’ve pointed out in many previous articles the fact that gold isn’t always the safe haven that it is fabled to be, when the next big decline in the price of gold occurs we will be watching closely the action of the Swiss franc for any indications of investment opportunities in gold stocks.  We have constructed what we believe to be a reliable indicator for the best time to buy gold stocks that are constituents of the Philadelphia Gold and Silver Stocks Index.  The action of the Swiss franc will act as a confirming indicator when the index is near a new low.
More Russell Reviews:

Edson Gould’s Speed Resistance Lines: Chipotle & Green Mountain

As described in our article on speed resistance lines dated September 22, 2011 (found here), Netflix (NFLX) has fallen below the level of $99.58 in a quick crash. At the time that we first ran the speed resistance lines on NFLX on December 3, 2010 we calculated a conservative range of $117 and an extreme range of $66.

Although we thought that the stock would be worth considering below the indicated levels, at the time, we had to concede that,  “the difficulty may be that the sentiment that pushed the stock price to $298.73 would likely be just the opposite to push the price down.” Therefore, we’re not buyers of NFLX at these levels. However, we wondered what Edson Gould’s speed resistance lines would say about two other stocks that have had tremendous increases recently.

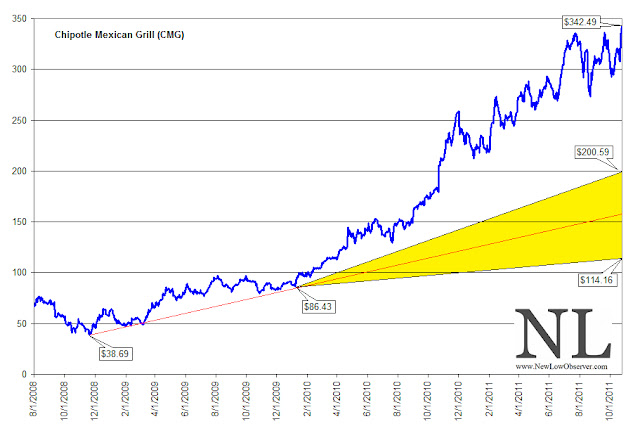
The first stock is Chipotle Mexican Grill (CMG) which has had a tremendous run-up in the last several years. In the chart below we can seen that Chipotle has recently peak around the $342.49 level. Based on Gould’s work, the near term conservative downside target is $200.59 while the extreme downside target is $114.16. If the stock price increases above $342.49 then so too will the downside targets.
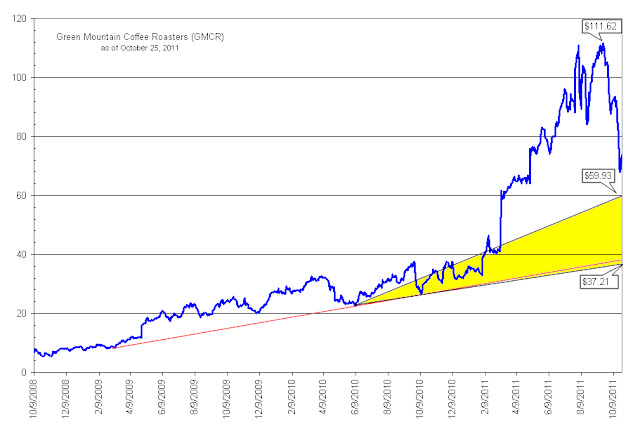
The next company that we’re interested in seeing the outcome on is Green Mountain Coffee Roasters (GMCR). It is challenging to believe that Green Mountain Coffee Roasters is going to increase above the prior peak in the near term. However, there appears to be a tremendous amount of downside risk for this company despite the decline that has already taken place. The conservative downside target is $59.93 while the extreme downside target is $37.21.  Green Mountain Coffee Roasters (GMCR) appears to have the worst technicals since a move below the $37.21 price could bring the stock down to the old support level of $3. 
We believe that it is worth examining whether or not these targets are accomplished. Chipotle Mexican Grill (CMG) actually appears to have some upside momentum in it still. However, we believe that the downside targets are reasonable estimates of where the stocks could go before initiating new research on whether these companies have viable business models.
Disclaimer: This piece is a continuation of the examination of Edson Gould's speed resistance line as explained in prior articles.  This is not an endorsement to sell short at the current levels nor buy these stocks once falling below the extreme downside targets since the stocks have been randomly selected, at best.
Those who understand interest earn it, those who don't pay it.

In the News: October 23, 2011

Please consider donating to the New Low Observer. Thank you.

Nasdaq 100 Watch List: October 21, 2011

Below are the Nasdaq 100 companies that are within 20% of their respective 52-week lows. Stocks that appear on our watch lists are not recommendations to buy. Instead, they are the starting point for doing your research and determining the best company to buy. Ideally, a stock that is purchased from this list is done after a considerable decline in the price and rigorous due diligence.
Symbol
Name
Trade
P/E
EPS
Yield
P/B
% from Low
BMC Software, Inc.
38.55
15.23
2.53
N/A
4.05
3.66%
First Solar, Inc.
53.77
9.17
5.87
N/A
1.23
5.70%
Ctrip.com
32.35
28.01
1.16
N/A
4.46
6.80%
Qiagen N.V.
13.39
24.35
0.55
N/A
1.17
7.38%
Netflix, Inc.
117.04
29.7
3.94
N/A
17.53
8.74%
Express Scripts, Inc.
39.14
16.03
2.44
N/A
10.26
9.67%
Mylan Inc.
18.04
19.76
0.91
N/A
1.91
11.56%
Teva Pharmaceutical
39.16
11.2
3.5
2.00%
1.45
11.89%
Life Technologies
39.66
20.41
1.94
N/A
1.49
12.35%
Research In Motion
22.77
4.16
5.48
N/A
1.17
13.06%
NetApp, Inc.
38.1
23.13
1.65
N/A
3.64
14.35%
VeriSign, Inc.
30.88
6.88
4.49
N/A
N/A
14.37%
Urban Outfitters, Inc.
25.07
16.97
1.48
N/A
2.86
14.53%
Paychex, Inc.
28.78
19.58
1.47
4.60%
6.66
14.57%
Microsoft Corporation
27.16
10.1
2.69
2.90%
3.97
14.84%
Vodafone Group Plc
28.01
11.77
2.38
7.00%
1.03
15.22%
Microchip Tech.
33.8
15.61
2.17
4.20%
3.35
15.36%
Lam Research
40.61
7.01
5.79
N/A
2.01
16.29%
Expeditors Int’l of Wash
45.64
26.08
1.75
1.10%
5.03
16.34%
Marvell Tech.
13.14
10.55
1.25
N/A
1.61
17.01%
Gilead Sciences
41.47
12.44
3.33
N/A
5.27
17.61%
CA Inc.
21.97
13.22
1.66
0.90%
1.86
18.03%
DENTSPLY Int’l
34.11
17.86
1.91
0.60%
2.32
18.07%
Henry Schein, Inc.
65.8
17.5
3.76
N/A
2.32
18.45%
DIRECTV
46.42
15.3
3.03
N/A
N/A
18.66%
Applied Materials,
11.69
8.06
1.45
2.80%
1.75
18.68%
Dell Inc.
15.24
8.14
1.87
N/A
3.31
19.34%
eBay Inc.
32.12
24.13
1.33
N/A
2.56
19.58%
Symantec
18.42
22.77
0.81
N/A
2.95
19.92%
Fiserv
58.47
19.18
3.05
N/A
2.65
19.94%
Watch List Summary
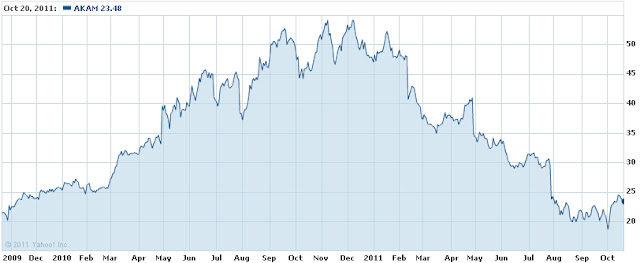
A stock that was on and off our radar in a flash was Akamai Technologies. Akamai Technologies (AKAM) was last on our Nasdaq 100 watch list August 12, 2011 (found here). Two months later, on October 3rd, Akamai closed at a 1-year low of $18.65. There are many reasons for AKAM’s price falling to a new low. Among other things, AKAM is under considerable competitive pressures, which some investors believe that the company has been slow to react to. However, every time AKAM reaches a new low, rumors abound about whether or not it will get acquired, as was the case 2 years ago. We believe that such rumors in 2009 is what helped those previously negative on the company to reconsider the merits of Akamai’s business model. Most recently it was rumored that Google was considering AKAM, although such rumors were dispelled very quickly.
Although Akamai has a lot of cash, potential growth in foreign markets, generally lower rate of customer turnover, which could contribute to the company’s growth going forward, we believe it is worth considering Akamai from a Dow Theory perspective for any upside potential that might remain for the company. According to Dow Theory, so far the average price paid by investors, as opposed to speculators, is $36.45. This indicates the point at which an investor, over the last year, considers to be the "fair value". This implies that the stock, at maximum could gain nearly 52% in due time. However, taking into account Charles H. Dow’s claim that in a bear markets, investors should only expect half of what would be considered “fair value” in a bull market, we think that in the next year Akamai could rise to the $30.15 level before faltering. We have acquired share of Akamai with the expectation that the stock will decline by at least 50%, at which point we will reconsider buying additional shares.
Watch List Performance Review
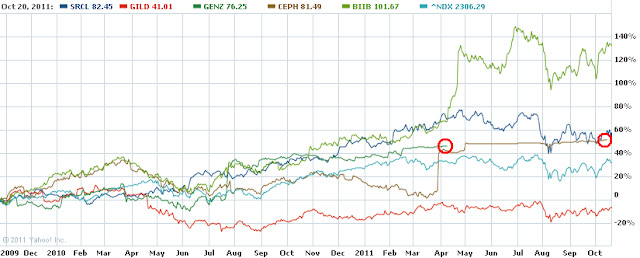
In our ongoing review of the Nasdaq 100 Watch List, we have taken the stocks from our list of October 23, 2009 (found here) and have checked their performance two years later. The companies on that list are provided below with the closing prices from October 23, 2009 to October 21, 2011.
-
-
2009
2011
change
SRCL
Stericycle
53.17
84.04
58.06%
GILD
Gilead
43.83
41.47
-5.38%
GENZ
Genzyme
54.5
76.25
39.91%
CEPH
Cephalon
54.02
81.49
50.85%
BIIB
Biogen
43.81
108.84
148.44%
-
-
-
Average change:
58.37%
-
-
-
-
-
^NDX
Nasdaq 100
1735.63
2306.29
32.88%

This is a particularly fascinating performance review because of the high performance of the stocks as compared to the Nasdaq 100 Index. On average, the stocks from October 23, 2009 list exceeded the Nasdaq 100 Index by 25.49%. Two of the companies have already been acquired (CEPH and GENZ) while SRCL and BIIB continue to outperform the Nasdaq 100 Index by a wide margin. The only stock that is severely lagging behind the index is Gilead Sciences (GILD) with a loss of -5.38% and a numbing -38.26% under-performance. Overall, we’re satisfied with the results of this watch list and encourage closer scrutiny of companies on our current list, there may be bargains to be had.

Please consider donating to the New Low Observer. Thank you.

In the News: October 16, 2011

Please consider donating to the New Low Observer. Thank you.

Dow Theory: Bullish Implications

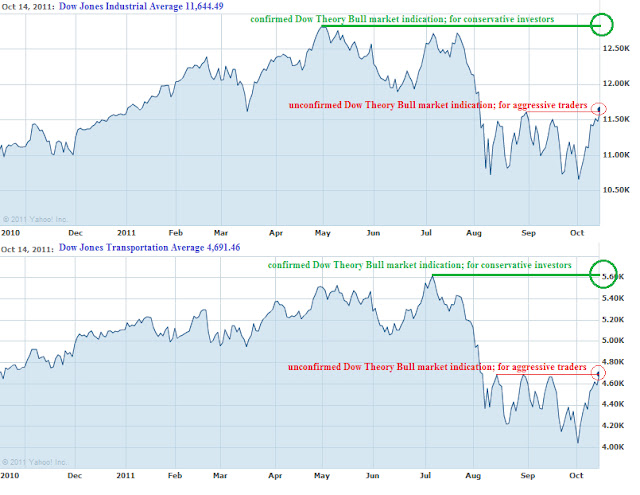
This week the Dow Jones Industrial Average and Dow Jones Transportation Average provided indications that, according to Dow Theory, have bullish implications.  On October 14, 2011, the closing of the Industrials above 11,613.53 and the Transports above 4,684.44 suggests that the indexes will at least rise to the July highs and maybe even the April 2011 highs.
This bullish implication stands juxtapose to the bear market confirmation that was received when the Industrials and Transports simultaneously declined to new lows on October 3, 2011.  Our view is that we’re still in a cyclical bear market that cannot become a cyclical bull market until both indexes exceed the April and July highs.  To become a secular bull market, the Industrials and Transports need to go above their 2007 high.


Some would suggest that for anyone to wait until the indexes rise to the 2011 highs there would be a lot of missed investment opportunities.  However, as we’ve indicated many times in the past, we use Dow Theory signals as an allocation indicator.  During bull markets, we put more money to work and the opposite is true when there is a bear market indication.  There are few instances when we’re completely out of the market for an extended period of time based on a bear market indication, as demonstrated in our 2008 investment transactions.  Therefore, we have little concern for “missed” opportunities.


Additionally, although we got a bear market signal on August 2, 2011, which was 96 days after the April 29, 2011 peak in the Industrials, our portfolios were up for the year.  After reallocating our investment positions upon getting the bear signal, we were able to reinvest in quality companies, sometimes the same stocks, at significantly lower prices.


The coming market volatility will provide great opportunities for traders and allow investors a chance to cash out of otherwise undesirable positions and take profits.  Our expectation is that the Dow will go to the July 2011 highs before struggling at the May 2011 highs. Again, we’re still in a cyclical bear market until the Transports and Industrials exceed their respective 2011 highs.


Related article: A Lesson in Dow Theory published November 7, 2010
Please consider donating to the New Low Observer. Thank you.

NLO Dividend Watch List: October 14, 2011

The market rebounded nicely this week and pushed many companies out of their 52-week low range. Despite that, there are some great bargains to be had. There are 26 companies on this week's list.

Symbol Name Price % Yr Low P/E EPS Dividend Yield Payout Ratio
WAG Walgreen Co. 32.9 2.81% 11.19 2.94 0.90 2.74% 31%
PEP PepsiCo Inc. 62.09 4.79% 15.80 3.93 2.06 3.32% 52%
BDX Becton, Dickinson 73.85 4.83% 12.41 5.95 1.64 2.22% 28%
AROW Arrow Financial Corp.  22.73 5.28% 12.09 1.88 0.97 4.27% 52%
FRS Frisch's Restaurants 19.52 5.34% 10.44 1.87 0.64 3.28% 34%
SYY Sysco Corp. 26.52 5.70% 13.53 1.96 1.04 3.92% 53%
CFR Cullen/Frost Bankers 46.94 6.58% 13.30 3.53 1.84 3.92% 52%
T AT&T Inc 29.15 7.16% 8.47 3.44 1.72 5.90% 50%
BCR CR Bard, Inc. 86.81 7.41% 22.91 3.79 0.76 0.88% 20%
BOH Bank of Hawaii Corp. 37.79 7.88% 11.21 3.37 1.80 4.76% 53%
VNO Vornado Realty Trust 76.1 7.93% 16.99 4.48 2.76 3.63% 62%
TR Tootsie Roll Industries  24.79 7.97% 28.83 0.86 0.32 1.29% 37%
WST West Pharmaceutical 38.23 8.12% 20.78 1.84 0.72 1.88% 39%
ANAT American Nat'l Insur. 71.27 8.46% 11.80 6.04 3.08 4.32% 51%
TRV Travelers 50.65 8.64% 9.57 5.29 1.64 3.24% 31%
BRO Brown & Brown, Inc. 18.38 9.02% 16.71 1.10 0.32 1.74% 29%
CWT California Water Service 18.17 9.10% 18.73 0.97 0.62 3.41% 64%
MSEX Middlesex Water  18.06 9.18% 19.63 0.92 0.73 4.04% 79%
MDT Medtronic, Inc. 33 9.34% 11.50 2.87 0.97 2.94% 34%
CBSH Commerce Bancshares  36.39 9.51% 12.90 2.82 0.92 2.53% 33%
NTRS Northern Trust Corp.  36.75 9.67% 14.58 2.52 1.12 3.05% 44%
WFSL Washington Federal  13.37 10.04% 15.55 0.86 0.24 1.80% 28%
PRK Park National Corp. 53.93 10.06% 12.15 4.44 3.76 6.97% 85%
ALL Allstate Corp.   24.58 10.37% 23.41 1.05 0.84 3.42% 80%
UTX United Technologies Corp. 74.2 10.55% 14.38 5.16 1.92 2.59% 37%
NU Northeast Utilities 33.08 11.42% 13.96 2.37 1.10 3.33% 46%

Watch List Summary

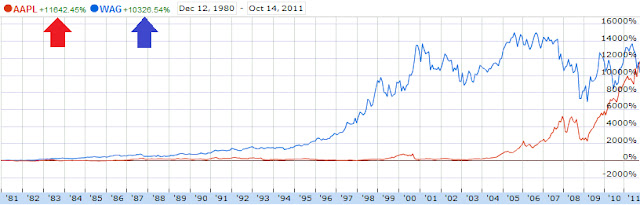
Topping our list this week is Walgreen Co. (WAG). Walgreen Co. is currently yielding 2.74% with a conservative P/E ratio of 11. Earnings is expected to grow 11% through 2012. With the stock being so close to the one year low, it appears that the risk-reward may have turned in favor of the investor. We have bought a 10% position of WAG as of Friday October 14th with the expectation to purchase the exact same dollar amount when the price falls by 20% or more. Like moths to a flame, we're drawn to the compounding consistency of Walgreen as demonstrated in the performance of the stock against Apple (AAPL) since Apple's IPO in 1980. In the chart below, only recently has AAPL been able to exceed the total return of Walgreen but by a relatively narrow margin.

Right behind Walgreen Co. is the well known consumer name, Pepsi Co. (PEP). Pepsi Co. has been on our list for some time now so we'll have to see how much longer it would stay. Analysts expect Pepsi to grow its bottom line by 7% next year. Although times may be different, but we can't help but remind investors of Jeremy Siegel's seminal piece "The Nifty Fifty Revisited" (found here). In that piece, Siegel reviews the performance of the "Nifty Fifty" at their peak price in 1972 before their crash. Pepsi Co. (PEP), from the peak in 1972, produced an annualized return of 16.03% in the period from 1972 to 1995.

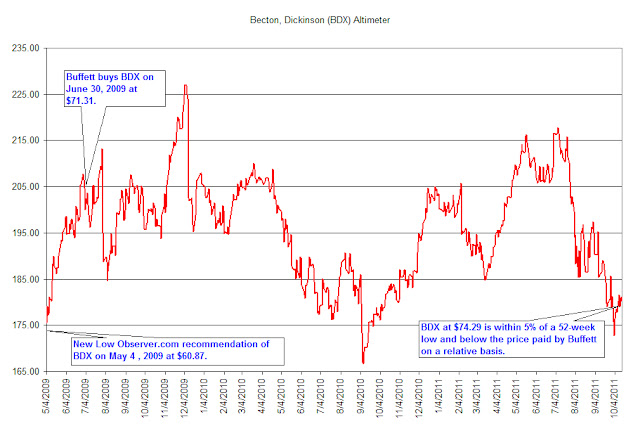
Becton, Dickinson (BDX) is now on our watch list after our first recommendation of the stock on May 4, 2009.  According to Edson Gould’s altimeter (chart below), BDX is now selling below the price paid by Warren Buffett relative to the dividend and subsequent dividend increases.  BDX has a dividend payout ratio of 28% which indicates that earnings could fall by 50% without imperiling the company’s ability to make good on their dividend.

Watch List Performance Review

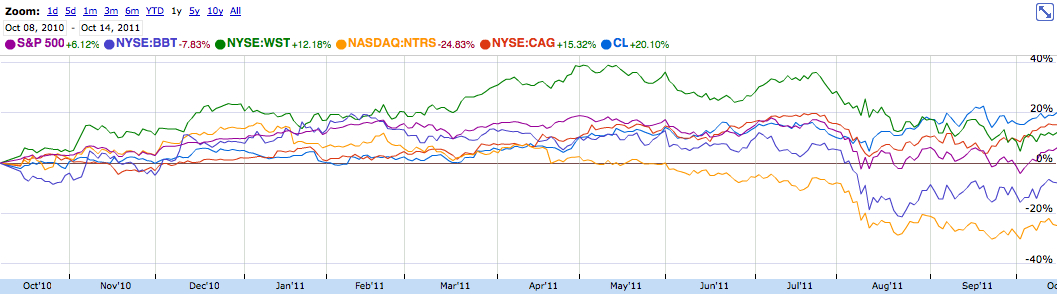
In our ongoing review of the NLO Dividend Watch List, we have taken the top five stocks on our list from October 8, 2010 and have checked their performance one year later. The top five companies on that list can be seen in the table below.

Symbol Name 2010 Price 2011 Price % change
CL Colgate-Palmolive Co. 74.90 91.99 22.82%
CAG ConAgra Foods, Inc. 21.87 25.47 16.46%
NTRS Northern Trust Corp.  48.35 36.63 -24.24%
WST West Pharmaceutical 35.11 38.3 9.09%
BBT BB&T Corp. 23.58 22.36 -5.17%
Average 3.79%
DJI Dow Jones Industrial 11,062.78 11,573.34 4.62%
SPX S&P 500 1,176.19 1,215.65 3.35%

The performance of the top five from last year, at 3.79%, was between the Dow's 4.62% and the S&P 500's 3.35%.

Three of the top five stocks from last year performed above the level of the S&P 500 and Dow Jones Industrial Average.  Colgate-Palmolive (CL) cranked out a return of over 22% despite sporting a subpar dividend yield of 2.83%.  ConAgra managed to generate a return of 16% with a dividend yield of 4.21% at the time the list was generated.  Northern Trust (NTRS) got hammered with a decline of -24.24%.

Disclaimer:

On our current list, we excluded companies that have no earnings. Stocks that appear on our watch lists are not recommendations to buy. Instead, they are the starting point for doing your research and determining the best company to buy. Ideally, a stock that is purchased from this list is done after a considerable decline in the price and extensive due diligence. We suggest that readers use the March 2009 low (or the companies' most distressed level in the last 2 years) as the downside projection for investing. Our view is to embrace the worse case scenario prior to investing. A minimum of 50% decline or the November 2008 to March 2009 low, whichever is lower, would fit that description. It is important to place these companies on your own watch list so that when the opportunity arises, you can purchase them with a greater margin of safety. It is our expectation that, at the most, only 1/3 of the companies that are part of our list will outperform the market over a one-year period.

Please consider donating to the New Low Observer. Thank you.

Dow Theory and Richard Russell

In attempting to understand Dow Theory it is necessary to follow the best and the brightest on this topic. Over the last 52 years, the brightest person on Dow Theory has been Richard Russell. No single person has been more outspoken on their views on the market using Dow Theory, uninterrupted since 1958, than Richard Russell. So when Richard Russell does an about face on his interpretation of Dow Theory it is worth our time to examine the reasons.

First, it is necessary to provide context around the ideas on Russell’s most recent market call.

  • From November 12, 2007 to January 2, 2009, Russell indicated that we were in a bear market. The Dow went from 12,987.55 to 9,034.69, a decline of -30.44%.
  • From January 5, 2009 to January 12, 2009, Russell indicated that we were in a bull market. The Dow went from 8,952.89 to 6,926.49, a decline of –22.63%.
  • From March 11, 2009 to July 22, 2009, Russell indicated that we were in a bear market. The Dow went from 6,930.40 to 8,881.26, a gain of +28.15%.
  • From July 23, 2009 to May 19, 2010, Russell indicated that we were in a bull market. The Dow went from 9,069.29 to 10,444.37, a gain of +15.16%.
  • From May 20, 2010 to July 8, 2010, Russell indicated that we were in a bear market. The Dow went from 10,068.01 to 10,138.99, a slight gain was registered for the period (<1%).

On July 9, 2010, Richard Russell said:

“When the facts change, I change. To do otherwise would be idiotic. Something occurred yesterday that made me sit up and take notice. We had the non-confirmation by the D-J Transportation Average, a situation that I discussed on the July 5 site.”

“Following the Transport non-confirmation, yesterday the market surged higher, Dow up 274 and Transports up 152. But that’s not all. What I noticed was that yesterday was a 90% up day [up volume versus down volume] — the formula for a bottom.”

According to Russell, the Transports non-confirmation along with a 90% up volume/down volume ratio is what led to the conclusion that the market was indicating that a bottom was in. Russell goes on to recommend buying various ETFs with stop losses. Several problems arise when market action is viewed from Russell’s perspective.

First, Russell has ignored the fact that a trend is in place until a counter trend is signaled. So far, we haven’t had a bear market indication since the March 9, 2009 low. If the Transports were to confirm the Industrials by falling below the February 5, 2010 low, then we’d have our first bear market signal.

Second, when thinking in terms of Dow Theory, market participants have three variables to consider the Dow Jones Transportation index, Dow Jones Industrials and NYSE volume. Volume attributes are considered over a period of time. Single day action on volume should not be the determining factor for considering a bull or bear market. If this is the case, then most market signals could be very misleading. In my observations, market volume has increasingly become an addendum to Dow Theory.

Third, Russell has often disregarded the pure Dow Theory indications that have come along the way since the March 2009 low. It seems that Russell’s understanding of macro issues and his personal experience in the markets has led to his decision to err on the side of caution. However, Russell’s cautious streak has usurped the value of Dow Theory to act as a “…composite index of all the hopes, disappointments, and knowledge of everyone who knows anything of financial matters, and for that reason the effects of coming events (excluding acts of God) are always properly discounted in their movement. The averages quickly appraise such calamities as fires and earthquakes.” (Rhea, Robert, The Dow Theory, page 19).

Next, Russell has set himself up for the need to change his analysis by not thinking through Dow Theory to its conclusion. By calling a bottom at this juncture, Russell has left out the all-important confirmation that is required by the Industrials and Transports. 10,450.64 and 4,467.25 are the new levels that the Industrials and Transports need to surpass before any buying policy should be considered. In addition, after surpassing the referenced upside confirmation points, the next level of resistance is 8% away for both indexes. This means that we could go to the old high and then quickly reverse to the downside if a bull market confirmation isn’t signaled. However, given the most recent market action, our focus should be on the confirmation of the reversal pattern first, then the possible bull market indication.

Another matter of concern is that Richard Russell makes recommendations that don’t address the issue of investing in values. Values are a core tenet of Dow Theory. In fact, when you read Dow Theory Unplugged or Charles H. Dow: Economist, you will find that values, not technicals, are espoused. Russell points his readers to speculative opportunities instead of undervalued stocks which can be held for “the long term” if the bullish assessment happens to be incorrect. Our list of Dividend Achiever stocks at or near a new low addresses the prospect that if we’re wrong there is some recourse. In this case, you get the ability to compound your investment over time with the prospect of capital appreciation.

Finally, our stance on stop loss orders is widely known as indicated in the article “Automatic Orders Don’t Provide Protection” as well as our disclaimer at the end of each sell recommendation. Russell’s recommendation of buying ETFs is reckless at best especially in light of the May 6, 2010 “flash crash.” Adding fuel to the flames is the article titled “ETF ‘Circuit Breakers’ Needed to Stop Flash Crashes: Pros.” Our stance on ETFs is well founded and preceded any discussion of the true risks associated with them on May 6th (“ETF: Mediocrity With No Pretense of Value” and “ETF: Indiscriminant Risk”).

It is likely that perma-bulls will seize on the Russell commentary of July 9th as the heralding of a new-new era in investing. On the other hand, “contrarian investors” will suggest that when Richard Russell, perma-bear that he is, has entered the bull ring then the bull run is definitely over. It is our contention that while Richard Russell might be right about a reversal pattern being in place he is not using Dow Theory.

Our latest views on Dow Theory can be found at the following link (NLO on Dow Theory). Keep in mind that all trends are considered to remain in place until otherwise indicated. So far we are still in a cyclical bull market within a secular bear market