Author Archives: nlo-admin

Avoid These Ratios on Gold Stocks

When attempting to put the current market moves into perspective, it makes sense to look at the various market ratios like Price-to-Earnings, Price-to-Book, Price-Sales as guideposts for market direction.  Ratios help to put the numbers that are constantly being generated into proper perspective, in relative terms.  However, when attempting to look at how relatively valued gold stocks are, there are a couple of ratios that investors should uniformly avoid and those are the [Gold Stock Index]/Gold and the Gold/[Gold Stock Index].

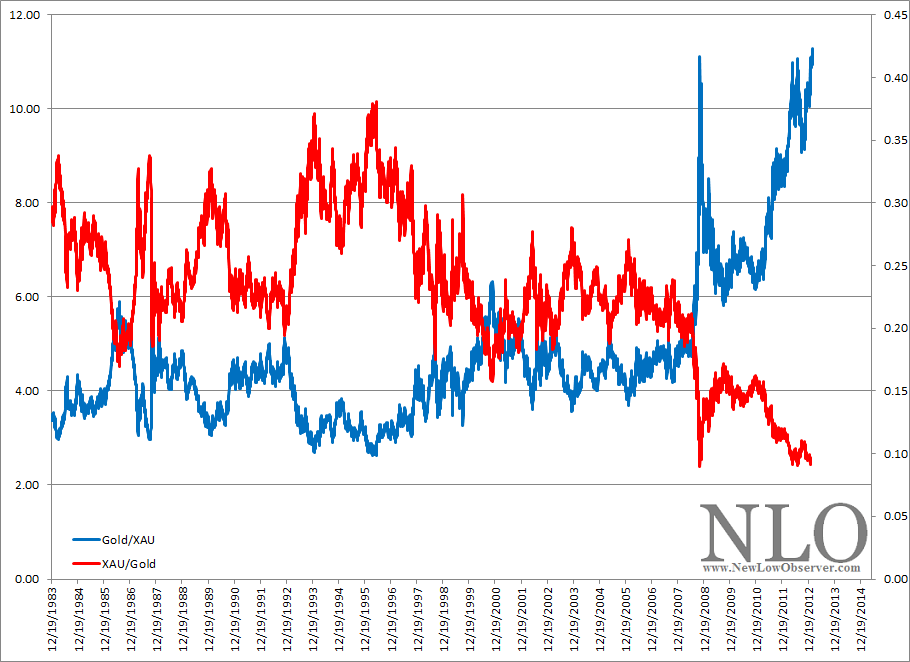
For example, the HUI/Gold ratio currently appears to indicate that we’re approaching the 2008 low.  Also, as suggested by well known market analyst John Hussman, since 1974, whenever the Gold/XAU ratio was at 3 or lower gold stocks were a sell. Whenever the Gold/XAU ratio rose to 5 or higher, gold stocks would be a buy (found here).

Currently, the Gold/XAU ratio is at 11.28, gold stock should be considered a screaming buy. However, since July 15, 2008, the Gold/HUI ratio has been above the 5 level ever since. This means that if either the XAU or HUI were bought on July 15, 2008, there would have been losses of -66% by October 27, 2008, an annualized loss of -98%.  Additionally, both the XAU and HUI are at –23% and –13% if held since July 15, 2008 to the present (ratio charts below).

image

Now, because the XAU/Gold ratio matches the levels of the HUI/Gold ratio, the inverse should also be consistent.  For this reason, the belief that the current level is close to the end of the decline may be in error.  Additionally, as has been suggested by some, the fall in the price of gold and gold stocks may be a precursor to declines in the overall stock market.  As we’ve demonstrated many times in the past, when the general stock market declines gold stocks decline by an even larger percentage.

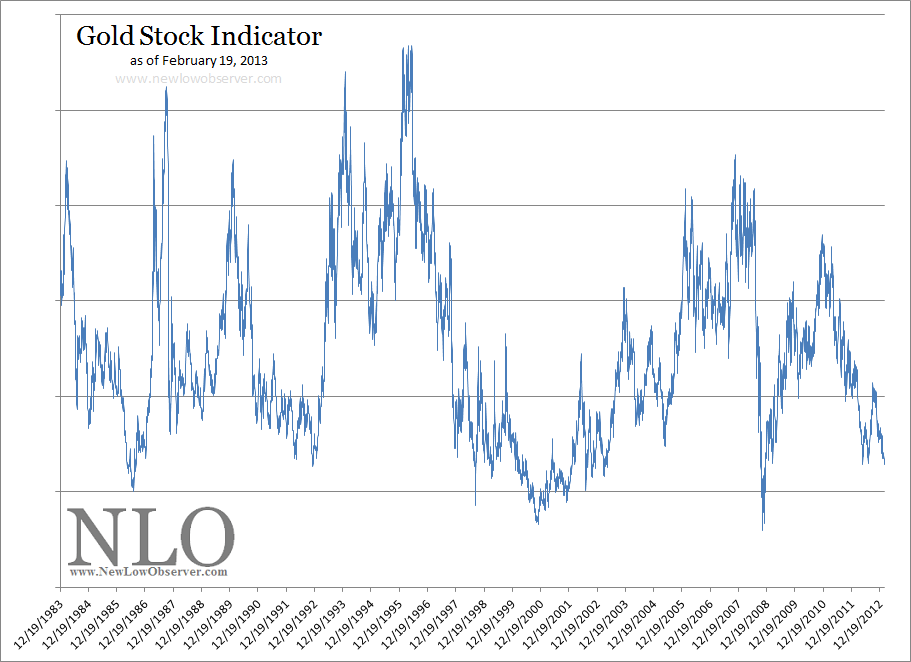
From our work in the topic, our Gold Stock Indicator is 53% above the 2008 low as opposed to the Gold/XAU, Gold/HUI, XAU/Gold and HUI/Gold being within 5% of the 2008 low.

image

Our view is that, while the 2008 low is not guaranteed, there is the remote possibility that the lows for gold stocks are not completely in based on our Gold Stock Indicator.

Transaction Alert

Continue reading

Canadian Dividend Watch List: February 15, 2013

This is a list of Canadian dividend stocks that currently, or in the past, had a history of consecutive dividend increases. For those wishing to find the most complete fundamental information on these companies, we recommend visiting one of Canada’s leading financial websites, the Financial Post (found here). However, Yahoo!Finance probably has the better long-term charts and historical dividend data.

Continue reading

U.S. Dividend Watch List: February 15, 2013

Below are the 19 companies on our U.S. Dividend Watch List that are within 11% of their respective 52-week lows. Stocks that appear on our watch lists are not recommendations to buy. Instead, they are the starting point for doing your research and determining the best company to buy. Ideally, a stock that is purchased from this list is done after a considerable decline in the price and rigorous due diligence.

Continue reading

Our Strategy on Gold Stocks

Continue reading

Gold Stock Indicator

Continue reading

Q&A: Cycles and Their Use

Reader Kerry Comments:

“I’d like to pick up on the problem that untrusting investor has identified ‘The problem is that we have never seen one yet that has much accuracy or predictive ability to any substantive degree or within any reasonable time frame. As such, it becomes a ‘big gamble’ to take action on the predictions of any such cycle models or theories.’

“I like cycles myself, but I struggled with cycles that appeared great but then tended to be slightly off when forecasting the future, and therefore are difficult to use in trading. This led me to conduct my own research that has culminated in my own cycle work and the discovery of a 2.2/4.4 year cycle. I am of the opinion that the secular bear is about to strike back in the second half of 2013 as the 17.6 year stock market cycle continues until 2018, when the next great bull market will properly begin.”

Our Response:

Implicit in the discussion of cycles (observations of the past) is the eventual application of the analysis for the future. Unfortunately, some who do the best research on the study of cycles have the worst record of application. Our view is that we’ll be wrong about the actual cycle range and the application of the timing. Therefore, we are never disappointed about the outcome.

However, as students of the market we are constantly working to find quality research on the topic. Already we know that Charles Dow’s work on stock market cycles is useful when applied with skepticism and moderation.

As an example, based on the Wenzlick model for when real estate would bottom (18.3 years) it suggested that the low would be in 2009. In our January 2010 article titled “Real Estate: The Bottom is Calling” we said the following (found here):

“…tendency has been to include the years 2008 and 2010 just to play it safe.”

We understand that the markers for a bottom or top are like sand dunes in a desert, they are constantly on the move. This does not negate the cyclical nature of market moves, it just means that flexibility is required when thinking on the topic of cycles.

We followed up the January 2010 article with what we believed was the definitive call in the real estate bottom based on the work of Wenzlick. In a December 2010 article titled “Real Estate: The Verdict is In” (found here) we felt the title said it all.

Naturally, we could have been completely wrong and in select markets, a bottom may not be in at all. However, we’re trying to think in terms of the broader context. Based on the metrics that we tracked, real estate did hit bottom on or fairly close to the December 2010 low as highlighted in our follow-up article titled “Real Estate: A Sustainable Rise” (found here).

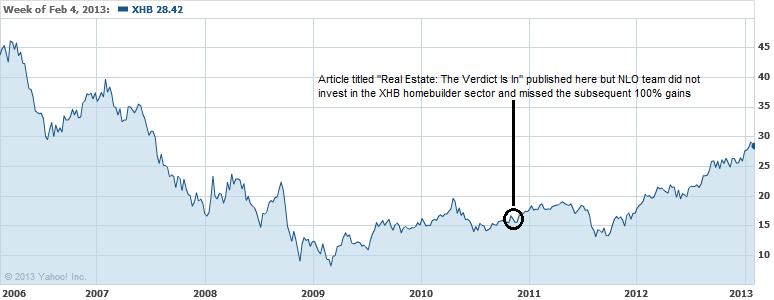
Within the general context of “being accurate” on our call of real estate based on the cycle work of Wenzlick, there are a couple of MAJOR ASPECTS THAT WE DID NOT GET RIGHT and that is the recommendation and investment in homebuilder stocks and the purchase of the home in our specific county.

First, we did not recommend homebuilder stocks because we simply didn’t think of it. That was a huge missed opportunity as shown in the chart below of the SPDR S&P Homebuilders ETF (XHB).

image

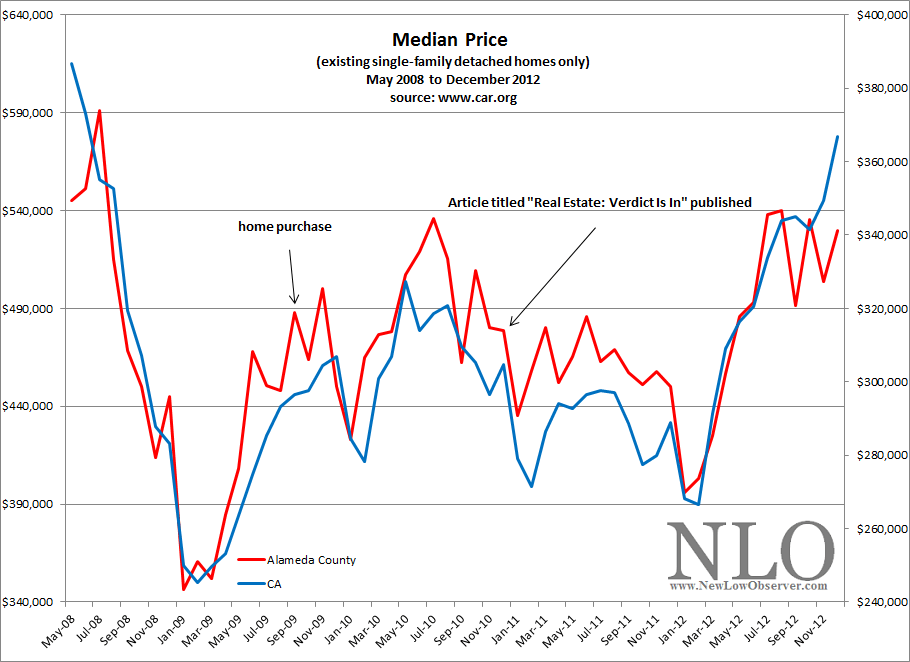
Second, our purchase of a home in September 2009 was not at the low point, for our region of the country, as real estate prices had bottomed in January 2009.  By the time of the 2009 purchase, median prices for our county had increased by +40% as seen in the chart below (www.car.org).

image

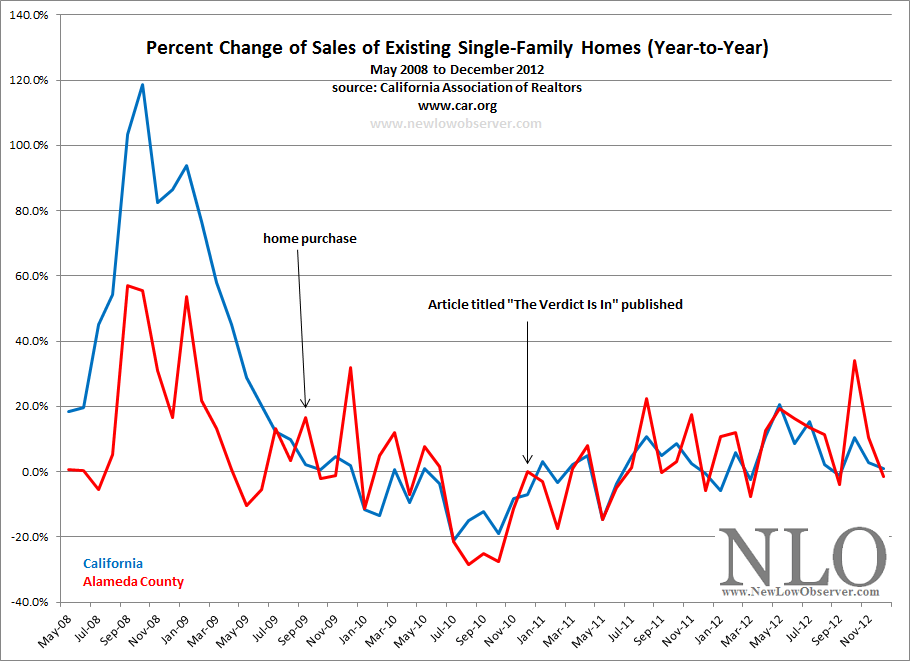
Also, as seen below, existing home sales for our county bottomed a year after the home purchase.

image

However, the overall point is that we're closer to the low in the respective cycles rather than near the peaks in the cycle with out investments and purchases.  Additionally, we’re taking the lessons for the current cycle and hoping to apply it to the next cycle move.

We also have cycle targets for gold and interest rates which have been fairly accurate. Do we go “all in” on the cycle turns? No. However, we do factor in the chance that the change in the cycle could exert its force on our best intentions.

Again, the emphasis should always be on skepticism and moderation when attempting to apply cycles for predictions of the future.  With this in mind, a good analyst will hedge their commentary on cycles and allow for a wide margin of error. After all, we’re all students of the market (real estate, jobs, stocks, cars, groceries etc.) and therefore open to changing conditions.

As mentioned earlier, we’re always factoring the downside risks and acting accordingly (most of the time, except when our subscriber SD pointed out the awesome buying opportunity on DELL from our own watch list at the low…Great call SD!).

U.S. Dividend Watch List: February 8, 2013

Below are the 24 companies on our U.S. Dividend Watch List that are within 11% of their respective 52-week lows. Stocks that appear on our watch lists are not recommendations to buy. Instead, they are the starting point for doing your research and determining the best company to buy. Ideally, a stock that is purchased from this list is done after a considerable decline in the price and rigorous due diligence.

Continue reading

Nasdaq 100 Watch List: February 8, 2013

Below are the Nasdaq 100 companies that are within 10% of their respective 52-week lows. Stocks that appear on our watch lists are not recommendations to buy. Instead, they are the starting point for doing your research and determining the best company to buy. Ideally, a stock that is purchased from this list is done after a considerable decline in the price and rigorous due diligence.

Continue reading

Richard Russell Review: Letter 854

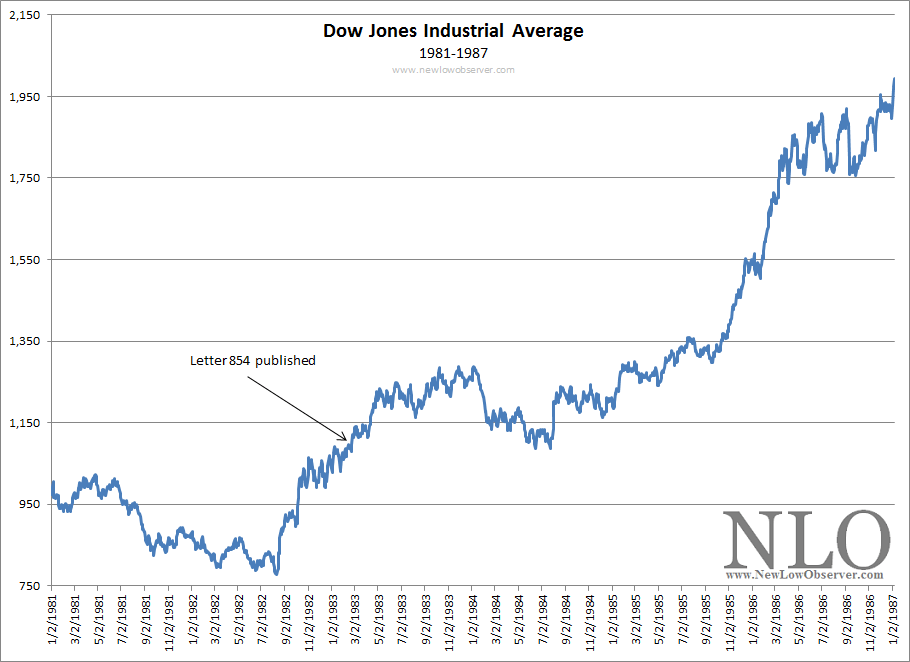
Richard Russell’s Dow Theory Letter Issue 854 was published on February 9, 1983.  At the time, the Dow Jones Industrial Average was at the 1,067.42 level.

image

Economic events never occur in a vacuum.  Usually there is a string of events that leads from one event to another. One big event can lead to an even bigger event that overshadows the prior calamities that triggered the “big” event.  This issue of Richard Russell’s Dow Theory Letters covers  one market event that led to major crises that happened at different periods in time.  The two events are joined at the hip based on the decline of oil prices.  This led two separate major bailouts that resulted in structural shift in the way our brand of capitalism works.

Also, this Russell review will cover the topic of cycles in corporate cash and corporate indebtedness. We'll discuss, in brief, where we might be in this cycle.

The first event resulted in the Savings and Loan Crisis and is thought to have begun in 1986 due to the Tax Reform Act of 1986 culminating in the bailout of many banks and the eventual bankruptcy of the Federal Savings and Loan Insurance Corporation (FSLIC).

The second event resulted in the Mexican Peso Crisis with the outcome that major banking institutions like Citibank and Goldman Sachs needed to be bailed out.  It is important to note that the Peso Crisis is considered to be as a result of the peso devaluation in 1994.

The true roots of both the S&L Crisis and the Peso Crisis is the decline of oil prices after the inflationary peak in 1980-1981.  Richard Russell’s Dow Theory Letter Issue 854 highlights the seeds of destruction that were going to be much larger than even Russell could have imagined. However, if anyone wishes to understand how the snowball got rolling then this issue highlights the beginning.

The very first quote is an amazing insight of the American dependence of the high price of oil, Richard Russell says the following:

“We’re facing a situation (ironically) where the US is all for holding oil prices at a high level. The banks have lent huge sums of money both to private corporations and to oil producing nations-loans based on rising oil prices. If the oil price cracks badly,  the banks are going to have major problems. On top of that, the US depends on oil taxes (so called “excess profits” tax) for huge chunks of tax income. If oil prices crack then the profits for the oil companies will dive (which they are already doing) and the tax short-fall will be horrendous. (page 1)”

This commentary is staggering in the fact that it was so prescient.  The cracks in the armor of the American oil industry began in Texas when the easy money stopped raining down on oil dependent cities like Houston and Dallas.  In a 1988 issue of Dow Theory Letters, Russell had the following to say:

“With oil prices caving in, Texas now has more people leaving the state than coming in.( Dow Theory Letters. March 9, 1988. page 6.)”

The decline in oil prices led to a decline of jobs for that industry which resulted in a decline in real estate prices as people left the state of Texas.  Loans made by savings and loan institutions in the southwest U.S., to businesses and real estate investors, all went bad at the same time leading to the Savings and Loan Crisis (S&L Crisis).  The S&L Crisis cost several hundreds of billions of dollars and still exist as an off-budget item as part of our national debt.

The decline in the price of oil also crushed foreign economies dependent on the commodity.  The Mexican Peso Crisis, although officially listed as beginning in 1994, had its roots in the early 1980’s.  The natural outcome of this crisis was the bailout of large banking institutions like Citibank and Goldman Sachs when the government stepped in and bought the bad debt held by the bank’s all in gamble.

Likewise, the current boom in commodity rich countries (although somewhat cooler at present) like Australia, Brazil, Russia, China and India could experience significant shocks to their system depending on the level of loans made as “investments” by foreign banking institutions based on the potential of future growth.

Few understood or believed the impact and importance of high oil prices to the American economy at the time.  Even fewer understood the direct reliance of the U.S. government to high oil prices.  Then as now, the elevated level of the price of gold is being wagered on by the U.S. government in a similar way that it was done when we had high prices in oil.  The excessive printing of money through quantitative easing and other accommodative policies by the Federal Reserve is based on the elevated level in gold prices.

If the price of gold were to collapse then all bets are off.  Unfortunately, many believe that a collapse in gold couldn’t happen while the government is bent on printing money out of thin air.  However, the problem is that commodities like gold are prone to dramatic declines, especially when all bets are that it can’t or won’t happen.

Many die-hard gold investors/speculators are not making the connection between the government’s reliance and expectation of higher prices in gold.  Worse still, gold investors mistakenly believe that the U.S. government wants to see a lower price in gold and that the only direction is up due to accommodative policies.  This is far from the reality, as found out the hard way by the likes of billionaire money manager John Paulson.  Waiting in the wings are other big-time money managers who will likely get bailed out of their money losing bets on gold’s elevated levels.  Those that have leveraged their bets on gold and other commodities will be bailed out using taxpayers money and hidden as an off-budget items as part of the national debt.  Suffice to say, despite all the carnage in the period from 1980 to 2007, the stock market managed to climb over 12 times.

Next up is a comment on how U.S. corporations were strapped with debt. Russell says the following:

“In the shorter term, the argument for holding stocks is that a low rate of inflation will be bullish for stocks. But that argument was never used in a situation like the current one - a situation in which corporations are loaded with debt.  Whether these corporations can survive with debt ridden structure during a period of deflation remains to be seen. (page 3)”

This commentary is interesting because it was at the early stages of a secular bull market when the Dow Jones Industrial Average went from 1,000 to the peak of 14,164, an increase of over 12 times in 24 years (and this was just the “average”).  Now, we seem to be in the early stages of a secular bear market with just the opposite scenario.  Today, we’re being told of the immense cash hoard that corporations happen to be sitting on (WSJ article here).  Furthermore, interest rates are at or near zero and likely to rise as opposed to rates falling from double digit heights in 1980.

We’re not impressed with the claims of corporate strength based on off-shore cash hoards. We believe that what we’re witness to is the corporate equivalent of high tide which is inevitably going to be followed by low tide.  It is only a matter of time that it will be revealed that the idle cash of today will be the debt-laden corporation of tomorrow.  Those that are clamoring (in some cases suing) for companies to disgorge their coffers of excess cash in the form of “special” dividends will not think twice, twenty years from now, that they had unwittingly contributed to the decline of the company that they’ve targeted.

FTSE 100 Watch List: February 6, 2013

Below is a list of the Financial Times Stock Exchange 100 (FTSE 100) companies that are within 10% of the one year low based what we believe to be reliable sources.

Continue reading

Virgin Media Gets An Offer and Other Important Lessons

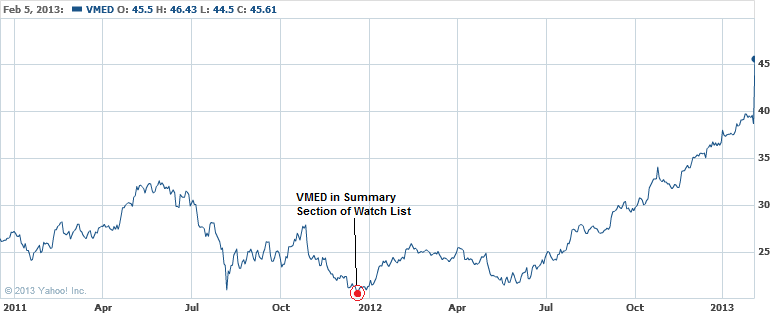
On February 5, 2013, Virgin Media (VMED) was given a buyout offer at $47.87 per share by Liberty Global (LBTYA).  Virgin Media is already a member of the Nasdaq 100 Index while Liberty Global was recently added  to the same index on December 14, 2012 (see Nasdaq 100 re-rank here).

Virgin Media was featured in our Nasdaq 100 Watch List Summary section on December 16, 2011 (found here).  Our worst case scenario for the stock was that it might trade as low as $13.28, it never came to be.  In fact, VMED never traded lower and has subsequently gained as much as +117%.

image

There are a couple of important observations about fundamentals that need to be addressed.  First, there weren’t any offers for VMED at the December 2011 low. This suggests that many corporations either cannot identify values at the low or that they are willing to pay nearly twice the price in the name of a “good values.”

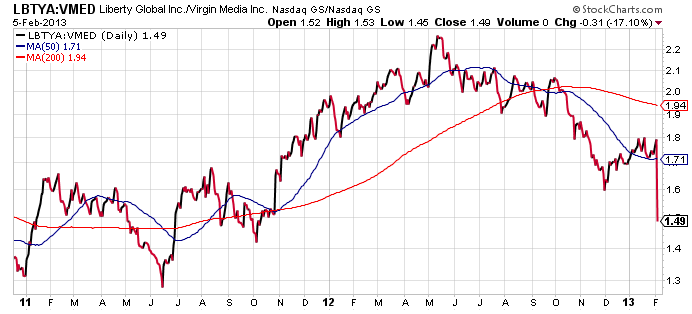
According to Liberty Global’s President and CEO, “adding Virgin Media to our large and growing European operations is a natural extension of the value creation strategy we've been successfully using for over seven years.”  As much as the CEO of LBTYA talks of the value that VMED will provide, the chart below suggests that this was an ill-timed purchase or could have taken place at a better point in time.

 image

The chart above shows a time range from December 16, 2010 to the present.  What the chart indicates is that the best time to buy out Virgin Media was on May 15, 2012. At that time, LBTYA shares were at their height compared to VMED, as LBTYA was trading at more than 2 times the price of VMED. Alternatively, LBTYA could have made a similar deal at multiple points before December 2011.

Today, Liberty Global is only buying VMED at 1 ½ times the February 5, 2013 closing price, which is no bargain.  Making an offer for VMED on May 15, 2012 could have saved current shareholders of LBTYA a significant amount of dilution in the stock, as Liberty is going to issue at least 151 million shares to acquire Virgin Media.

Another issue that is worth pointing out is the all too popular valuation metric known as price-to-earnings ratio (definition here). When Virgin Media was on our Nasdaq 100 Watch List on December 16, 2011, the stock was trading at $20.95 with a P/E ratio of 67.58.  Today, Virgin Media trades at a P/E ratio of 33, or exactly half of what the stock traded at when the stock was within 1% of the 1-year low.  This epitomizes the mixed signal that P/E ratios generate for fundamental investors seeking to identify quality companies as indicated in our article titled “P-E Ratios: Lesson From Conflicting Indications”.

In light of the offer made by Liberty, we’d like to remind you to get your scorecards out because there are going to be at least two new additions to the Nasdaq 100 with the possible departure of Dell (DELL) and Virgin Media (VMED). Look for Netflix (NFLX) to be one of the two stocks added to the Nasdaq 100 index as the stock is twice the price that it was when it was booted from the Nasdaq 100 Index in December 2012, less than two months ago.

February Ex-Dividend Dates

Below are the approximate ex-dividend dates for the month of February 2013 for companies that appear on our U.S. Dividend, Nasdaq 100, Dow Jones Transportation/Industrial Index and International Dividend Watch Lists. All companies are ranked by ex-dividend dates.

Companies that show up on our Watch Lists could be considered the equivalent of the bargain bin of high quality blue chip stocks. Because these companies have increased their dividends every year for at least 10 years in a row (or have had similar dividend policies in the past) or are part of major indexes and within 20% of their respective 52-week low, you know that you’re not overpaying for a company that has demonstrated profitability and the ability to rebound from challenging times.

Symbol Company Price % from yr low Qtrly Yield payout ratio Ex-date
(IBM) International Business Machines $203.19 11.71% 0.43% 23.66% 2/6/2013
(AA) Alcoa Inc. $8.93 12.17% 0.33% 66.67% 2/6/2013
(FNFG) First Niagara Financial Group Inc. $7.98 12.41% 1.00% 80.00% 2/6/2013
(BBT) BB&T Corporation $30.92 15.04% 0.75% 34.07% 2/6/2013
(CWT) California Water Service Group $19.36 14.99% 0.80% 58.72% 2/7/2013
(XOM) Exxon Mobil Corporation $89.79 16.31% 0.63% 23.51% 2/7/2013
(ALTR) Altera Corp. $34.49 16.46% 0.30% 23.26% 2/7/2013
(SJW) SJW Corp. $26.45 17.24% 0.65% 59.84% 2/7/2013
(WBS) Webster Financial Corp. $22.44 18.64% 0.45% 21.51% 2/8/2013
(AAPL) Apple Inc. $455.49 4.44% 0.58% 24.03% 2/11/2013
(STBA) S&T Bancorp Inc. $18.47 17.79% 0.80% 50.85% 2/12/2013
(MSEX) Middlesex Water Co. $19.51 11.96% 0.95% 87.21% 2/13/2013
(UMH) UMH Properties Inc. $10.38 12.45% 1.75% 514.29% 2/13/2013
(BRCM) Broadcom Corp. $32.56 13.81% 0.33% 35.20% 2/13/2013
(BA) The Boeing Company $76.20 13.96% 0.65% 37.96% 2/13/2013
(DD) E. I. du Pont de Nemours $47.77 14.74% 0.90% 58.31% 2/13/2013
(GRC) Gorman-Rupp Co. $29.88 17.13% 0.33% 28.37% 2/13/2013
(RBA) Ritchie Bros. Auctioneers $21.18 18.87% 0.55% 62.03% 2/13/2013
(EGN) Energen Corp. $47.80 19.21% 0.30% 16.52% 2/13/2013
(PRK) Park National Corp. $65.80 8.55% 1.43% 77.05% 2/20/2013
(MHP) The McGraw-Hill Companies, Inc. $46.99 12.91% 0.48% 37.09% 2/22/2013
(BOH) Bank of Hawaii Corporation $48.36 16.74% 0.93% 49.05% 2/26/2013
(CTWS) Connecticut Water Service Inc. $29.38 9.78% 0.83% 61.78% 2/27/2013
(TRMK) Trustmark Corporation $23.48 12.84% 0.98% 50.83% 2/27/2013
(MCD) McDonald's Corp. $95.29 14.33% 0.80% 57.46% 2/27/2013
(AJG) Arthur J Gallagher & Co. $37.88 12.12% 0.93% 88.05% 2/28/2013
 

Watch List Summary

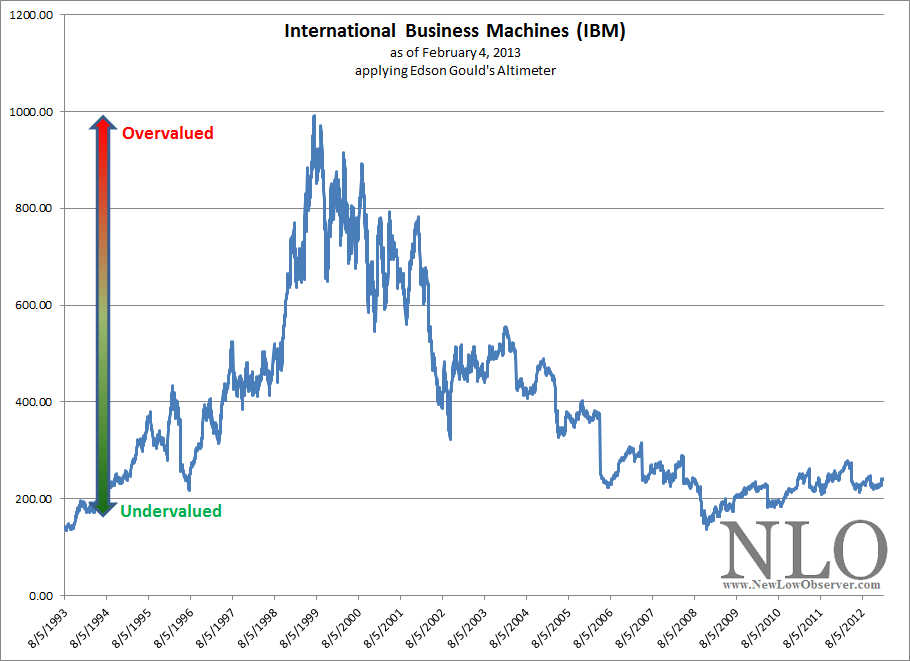
The first stock on our list is IBM (IBM).  After our April 19, 2012 titled “What Does Warren Buffett See In IBM?” (found here) the stock has been in a consolidation pattern.  Despite the critics, IBM managed to fall within 5% of the 52-week low on November 14, 2012.  With the stock currently trading within 12% of the 1-year low and a healthy payout ratio of  24%, the stock is well positioned for those interested in long-term positions.  We’re including an updated version of Edson Gould’s Altimeter which suggests that IBM is significantly undervalued based on the on dividend relative to the stock price.

image

According to Gould’s Speed Resistance Lines, IBM has the downside targets of $137.45 and $72.

Another notable stock on our list is Apple with an ex-dividend date of February 11, 2013.  On April 14, 2012, we projected the conservative downside target for Apple (AAPL) at $424.15 and the extreme downside target of $212.08 (found here).  On an intraday basis, Apple fell within 3% of our April 2012 conservative downside target.  Regardless of the market conditions, according to Dow Theory, Apple has upside targets of $528.28 and $616.68 before re-testing the previous highs.

If you happen to be researching these companies for potential investment, it would be advisable to consider the ex-dividend date prior to possible purchases. Owning the shares of the company that you're interested in before the ex-dividend date entitles you to the upcoming dividend payment.

Owning the shares on or after the ex-dividend date means that you would have to wait at least three months before receipt of the next dividend payment. Please verify the ex-dividend date and payout ratio before committing funds to these stocks. Additionally, do not base your next long or short-term purchase on the dividend payment or yield. Instead, get as much research in as you possibly can before the ex-dividend date "just in case" you're actually interested in buying the stock. Payout ratios that exceed 100% should be considered speculative investments.

Transaction Alert

Continue reading

U.S. Dividend Watch List: February 1, 2013

Below are the 20 companies on our U.S. Dividend Watch List that are within 11% of their respective 52-week lows. Stocks that appear on our watch lists are not recommendations to buy. Instead, they are the starting point for doing your research and determining the best company to buy. Ideally, a stock that is purchased from this list is done after a considerable decline in the price and rigorous due diligence.

Continue reading