Author Archives: nlo-admin

Bitcoin: Hits Our 2015 Upside Target and 2017 Downside Targets

On January 1, 2017, we said the following:

“The $1,051 upside target appears to be within reach as the digital currency is currently trading around the $1,006 level.  It is at this time that we need reassess the prospects for Bitcoin both on the upside and the downside.  Starting with the latter, we have posted the downside targets based on the most recent price indicated.

“As we’ve indicated in the past, the downside targets are paramount as they are the best assessment of the risk a speculator or investor might be taking when they decide to take the plunge.  As highlighted on the chart above, the downside targets are as follows:

  • $772.12 (conservative)
  • $553.75 (mid range)
  • $335.39 (extreme)

“Anyone considering being involved in Bitcoin for speculative or investment purposes should readily accept that the extreme downside targets are always in play.  This means that if you’re going to be involved in this currency you should always keep a portion of funds available for the prospect of the downside risk or accept that all funds invested could take a severe decline.”

Transaction Alert

We executed the following transaction(s):

Analyst Estimates: U.S. Dividend Watch List

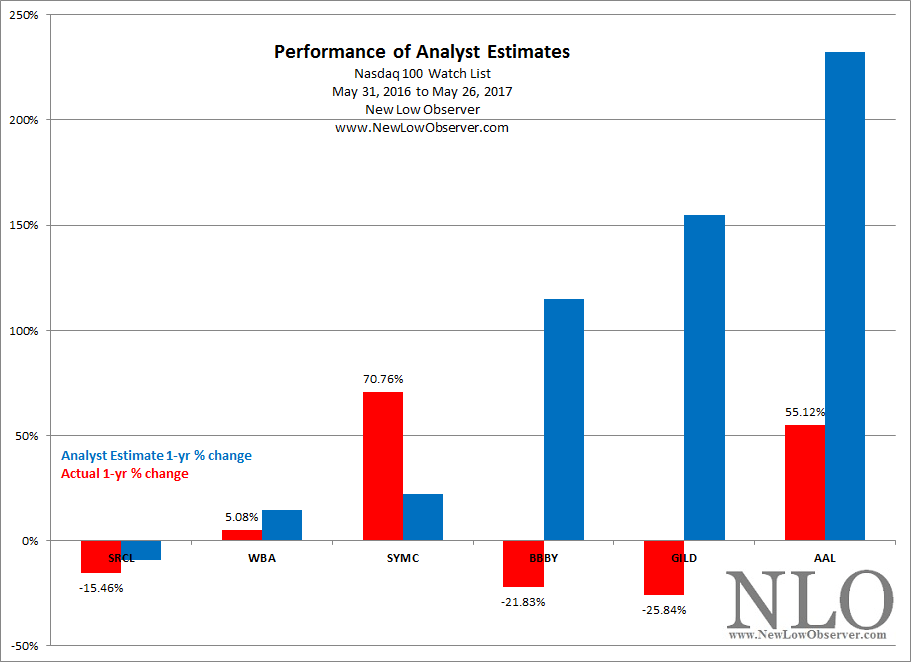
Below are the price projections based on analyst earnings estimates for on our recent U.S. Dividend Watch List dated January 6, 2017. These estimates project the price change for the respective stocks over the next 12 months.

U.S. Dividend Watch List: January 6, 2017

Previous Year Performance Review

In our on going review of the NLO Dividend Watch List, we have taken the top five stocks on our list from January 8, 2016 and have checked the performance one year later. The top five companies on that list can be seen in the table below.

Symbol Name 2015 Price 2016 Price % change
ADI Analog Devices Inc 49.98 71.60 43.3%
CFR Cullen/Frost Bankers 54.66 87.77 60.6%
SBSI Southside Bancshares 21.92 37.28 70.1%
ONB Old National BanCorp. 12.47 17.95 43.9%
QCOM QUALCOMM Inc 45.88 65.53 42.8%
      Average 52.1%
         
DJI Dow Jones Industrial 16,346.45 19,963.80 22.1%
SPX S&P 500 1,922.03 2,276.98 18.5%

The top five companies from last year's watch list did exceptionally well with average gains of +52%. Compared that with +22% gain for the Dow Jones Industrial Average and +18.5% for S&P 500.

The first company we highlighted was Analog Devices (ADI) which subsequently gained +43.30%. At the time, we highlighted many aspects of Analog Devices that were attractive. However, we thought that more downside (-16% to be exact) could be in store for the stock but that didn't pan out. As a result of our concerns, we thought one should look to Linear Technology (LLTC) as an alternative. This may sound strange but Analog Devices ended up buying Linear Technology! Shares of Linear Technology rose +60% since.

The next three companies we mentioned, on average, gained +58%. These three regional banks were small and not known to us but we stated the following.

When evaluating bank shares, we pay close attention to their book value. All three companies current price to book value ratio is lower than their five year average (refer to Morningstar under Valuation tab). With that many regional banks showing up on out list, we believe the entire sector should be evaluated before selecting individual shares.

We are happy about these results but only wished we took part in the gains.

The last company we spoke about was QUALCOMM (QCOM) which we disclosed about our position and recent transaction. Shares have risen 42.8% since. Continue reading

Coppock Curve: December 2016

Since the Coppock Curve flashed a buy indication at the end of March 2016, the Dow Jones Industrial Average gained +12% while the S&P 500 gained +8.7%. Our strategy of purchasing Guggenheim S&P 500 Equal Weight ETF (RSP) has proven was well timed and is up +10.0%. Below is an update to the Coppock Curve.

Continue reading

Bitcoin Targets

On November 4, 2015, we said the following:

“It has taken some time but Bitcoin appears to be on the rebound.”

“If the current run-up is anything like those in the past, $1,051 could be a relatively small number.  However, each of the indicated upside targets must be achieved first before we can start giving estimates of how far beyond $1,051 Bitcoin could go.”

The $1,051 upside target appears to be within reach as the digital currency is currently trading around the $1,006 level.  It is at this time that we need reassess the prospects for Bitcoin both on the upside and the downside.  Starting with the latter, we have posted the downside targets based on the most recent price indicated.

Downside Targets

image

As we’ve indicated in the past, the downside targets are paramount as they are the best assessment of the risk a speculator or investor might be taking when they decide to take the plunge.  As highlighted on the chart above, the downside targets are as follows:

  • $772.12 (conservative)
  • $553.75 (mid range)
  • $335.39 (extreme)

Anyone considering being involved in Bitcoin for speculative or investment purposes should readily accept that the extreme downside targets are always in play.  This means that if you’re going to be involved in this currency you should always keep a portion of funds available for the prospect of the downside risk or accept that all funds invested could take a severe decline.

Upside Targets

Q&A: Sysco Corp.

Reader MC asks: “Curious to know your recent thoughts regarding SYY and the significant gains made in the stock since your March, 2015 purchase.  Time to consider selling the principal portion again?”

Our Response:

On March 25, 2015, we bought Sysco Corp (SYY).  The premise behind the purchase was outlined in our March 13, 2013 posting titled “Warren Buffett Leverages Up on Inflation Hedge”.  In that 2013 posting we said the following:

“We cannot emphasis enough the fact that there are vastly superior alternatives to gold and gold stocks if you want to beat inflation.  Additionally, investment in companies like Heinz will be richly rewarded even as the period of inflation comes to an end.  This will not be the case for gold and gold stocks, as found out by gold permabulls in the period from 1980 to 1999.  This explains why Warren Buffett would be involve in the Heinz transaction, it is the appropriate alternative to buying gold or gold stocks if runaway inflation is expected down the road.”

Our take is that the secular trend in interest rates is up.  However, one challenge is the outsized gains that have been achieved with our purchase of Sysco Corp.  To put the change in perspective, the chart below represents the increase in Sysco Corp. (blue) compared to the S&P 500 (red) and Nasdaq 100 (orange) indexes.

image

The gain of +45%  in Sysco Corp. has outpaced the gains of the conservative S&P 500 at +7.37% and the far more volatile Nasdaq 100 at +10.80%.

Clean Harbors: Coincidence Confirmed, Again

On February 9, 2012, we posted Edson Gould’s Speed Resistance Lines [SRL] regarding Clean Harbors (CLH).  Our hope at the time was that our prior work on the top of Gould’s work would be handily refuted or confirmed.  At the time we posed the following SRL:

For us, our expectation was that the Clean Harbors would, at minimum, descend to the conservative downside target of $43.53.  Well, the timing and coincidence were in our favor as CLH fell –40% to the appointed levels that we thought the stock should descend.

As with all Speed Resistance Lines, there is a chance that the stock will continue to move higher.  However, at each point higher we readjust the SRL and arrive at new downside target.  In the case of CLH, the stock increased from the $67.60 price to as high as $70.30 thereby requiring an adjustment of the downside targets higher as well.  Remember, if the stock does not hit downside targets avoid it.  When and if the stock falls to the target, review for potential investment.

Finally, for no explicable reason, when all seemed in favor of the stock, CLH declined from the $70.30 peak to the low of $37.09 achieved in January 2016.  By achieving such an improbable low (improbable to those who were buying CLH in February 2012) CLH stock price appeared to be worth considering.  For this reason, we iterated a review of CLH for investment consideration on December 14, 2015. Since our mid-December 2015 review, CLH has increased by +39%.

image

At this point, we’d consider our general analysis of CLH a success from the December 2015 posting.  What do we see going forward?  We see two critical upside resistance levels to watch for.  The first upside resistance is at $59.00 and the second upside resistance level is at $69.00.  Obtaining a +39% gaining in a 1-year period might suggest that an investor consider selling all of their CLH holdings and reinvesting the funds somewhere else.

The Cold Hard Truth

Granted, luck and timing have a lot to say in any and all the work that we produce, however, that does not mean that our efforts on the topic should be dismissed as there may be some value in what we’re trying to accomplish.  Since the very first of our SRLs we’ve had more than 80% of the SRL downside targets achieved at the point of the initial examination.  This generally could could be considered a success.  However, of the 20% that have not been successful are positions that we’ve taken a real world investment in, which totally sucks.

In spite of the prevailing reality we continue to attempt to mitigate the available information with the stocks of interest to us.  We’ll narrow down this situation to a point where the SRL will work and/or we’ll still be able to benefit regardless of whether an immediate rebound is experienced.

U.S. Dividend Watch List: December 9, 2016

It was another record breaking week for the market as the bulls continued to march forward. With the Dow Jones Industrial Average and the Dow Jones Transportation Average reaching an all-time highs, there was a lot of talk about Dow Theory. Our team has studied Dow Theory in finer detail than most and would urge all readers to review our latest commentary titled Dow Theory: Myth & Fact. We would not encourage those on the sideline to jump into the market now but here are 18 companies to consider if one choose to do so.

Symbol Name Price % Yr Low P/E EPS (ttm) Dividend Yield Payout Ratio
KMB Kimberly-Clark Corp. 114.61 2.97% 20.84 5.50 3.68 3.21% 67%
MDT Medtronic 73.35 3.27% 24.45 3.00 1.72 2.34% 57%
CLX Clorox 115.29 3.64% 23.20 4.97 3.20 2.78% 64%
HRL Hormel Foods Corp. 34.39 3.65% 20.97 1.64 0.68 1.98% 41%
PPL PP&L Corporation 33.51 4.46% 12.46 2.69 1.52 4.54% 57%
BF-B Brown-Forman Corp. CL 'B' 45.87 4.68% 17.38 2.64 1.40 3.05% 53%
KIM Kimco Realty Corp. 25.98 4.97% 17.44 1.49 1.08 4.16% 72%
KO Coca-Cola Co 42.00 5.32% 25.45 1.65 1.40 3.33% 85%
NKE Nike, Inc. 51.72 5.53% 23.30 2.22 0.72 1.39% 32%
LLY Eli Lilly & 67.85 5.72% 29.50 2.30 2.04 3.01% 89%
PM Philip Morris International 90.24 6.84% 21.59 4.18 4.16 4.61% 100%
WTR Aqua America Inc 30.10 7.38% 25.08 1.20 0.77 2.56% 64%
MAC Macerich 71.14 7.79% 11.92 5.97 2.84 3.99% 48%
SO Southern Company 47.94 8.00% 18.02 2.66 2.24 4.67% 84%
VFC VF Corp. 56.55 9.25% 21.50 2.63 1.68 2.97% 64%
MCD McDonald's Corp. 121.26 9.91% 22.79 5.32 3.76 3.10% 71%
CATO Cato Corp. 31.36 10.42% 12.11 2.59 1.32 4.21% 51%
XRAY DENTSPLY International 59.02 10.46% 30.90 1.91 0.31 0.53% 16%
18 companies              

Watch List Review

We mentioned this before and will reiterate again that one shouldn't rush into the market at its all-time high. Recently, our team took a sizable position in Coca-Cola (KO) which is trading at less than 5% above its yearly low. The most recent headline is the change at the top with the current CEO set to step down next year. Perhaps this is a good/bad thing, we do not know. Our action stems from our assessment that downside risk are minimal at the current price. The dividend yield of 3.3% is also enticing for long term investors.

Our team ran some risk-reward profiles for Kimberly-Clark (KMB), Hormel Foods (HRL), Nike (NKE), and VF Corp (VFC) . We are cautious on these companies currently.

There is one company that would be interesting to dive into. It is DENTSPLY International (XRAY). This company is the world's largest manufacturer of professional dental products. The company consistently performed well with an average ROE of 15% since 1988. Dividend yield is negligible now but the company could return more to shareholders in the future.

Disclaimer On our current list, we excluded companies that have no earnings. Stocks that appear on our watch lists are not recommendations to buy. Instead, they are the starting point for doing your research and determining the best company to buy. Ideally, a stock that is purchased from this list is done after a considerable decline in the price and extensive due diligence. Our view is to embrace the worse case scenario prior to investing. It is important to place these companies on your own watch list so that when the opportunity arises, you can purchase them with a greater margin of safety. It is our expectation that, at the most, only 1/3 of the companies that are part of our list will outperform the market over a one-year period.

Nasdaq Biotechnology ETF

The iShares Nasdaq Biotechnology ETF (IBB) is trading in range that ultimately needs to be resolved.  The outcome is either falling dramatically below $240 or striking the $343 level before doing a retest of the prior high around $400.

image

Already, IBB has managed to resist falling below the ascending $218.37 level.  This is in defiance of our belief that a highly volatile sector and fund should retest the extreme downside target of $133.60.  Those wanting to have exposure to the biotech sector but unwilling to take on the individual risk should consider the prospects of this ETF.

2017 Dogs of TSX

Performance Review

Earlier this year, we did a “2016 Dogs of the TSX” where we outlined the stocks that conformed to the “Dogs of the Dow” strategy based on stocks from the Toronto Stock Exchange.  The Canadian stocks that we reviewed generated the following returns:

  • Category 1: +51.59%
  • Category 2: +12.52%
  • Category 3: +9.71%
  • TSX: +18.51%

This was was a smack down of epic proportions. Category 1 outdistanced all other groups by more than double, this includes the Toronto Stock Exchange gain of +18.51%.  Discerning investors should note the overall fundamental attributes of each category as there are some surprising elements to each.  As an example, Category 1 had the following value attributes at the time:

  • average p/e: 62x
  • average earnings: $0.02
  • average p/b: 0.75
  • average payout ratio: 398%

All is well in a rising market, however, we’ll continue to review the three categories to confirm that returns are consistent regardless of the market conditions.  This means that the TSE Index needs to be in a declining trend for us to confirm the value to the categories that we’ve created.

2017 Dogs of the TSX

Continue reading

Dow Theory: Myth & Fact

Recent stock market action warrants the review of Dow Theory.  On December 8, 2016, the Dow Jones Transportation Average increased above the previous peak set in December 2014.  This change in the Transportation Average confirms the new highs established by the Dow Jones Industrial Average.

image

We’ve canvassed various articles referring to the recent Dow Theory signal and have pointed out the myths and facts.

2016 NLO Book List

Below are the books that we’ve read cover-to-cover in 2016.  The accompanying links will take you to Amazon.com if you’re interested in buying the books.  The must reads from this list are Coined by Kabir Sehgal, Isabella by Kristen Downey and The Half Has Never Been Told by Edward E. Baptist. Enjoy.

Title Author
Absolute Monarchs John Julius Norwich
America's Bank Roger Lowenstein
Antifragile Nassim Nicholas Taleb
Battling the Gods Tim Whitmarsh
Beating the Street Peter Lynch
Boomerang Micheal Lewis
Carthage Must Be Destroyed Richard Miles
Code Warriors Stephen Budiansky
Coined Kabir Sehgal
Cycle of Lies Juliet Macur
Irrationally Yours Dr. Dan Ariely
Isaac Newton James Gleick
Isabella Kristen Downey
Magna Carta Dan Jones
Master Thieves Stephen Kurkjian
Native Son Richard Wright
Our Endangered Values Jimmy Carter
Personal History Katharine Graham
Plutarch's Lives, Volume 2 Plutarch
Politics Aristotle
Sex on the Moon Ben Mezrich
Strange Gods Susan Jacoby
The 48 Laws of Power Robert Greene
The Auctioneer Simon de Pury
The Decline and Fall of the Roman Empire Vol. 1 Edward Gibbon
The Evolution of God Robert Wright
The Full Catastrophe James Angelos
The Great Beanie Baby Bubble Zac Bissonnette
The Great Cholesterol Myth Jonny Bowden
The Great Escape Paul Brickhill
The Half Has Never Been Told Edward E. Baptist
The Heart of the Buddha's Teaching Thich Nhat Hanh
The Improbability Principle David J. Hand
The Lufthansa Heist Henry Hill
The Plantagenets Dan Jones
The Tao of Warren Buffett Mary Buffett
The Tao Te Ching Lao Tsu
The Twelve Caesars Suetonius
The Warren Buffett Way Robert Hagstrom
When to Rob a Bank Steven D. Levitt
Wisdom of Crowds James Surowiecki
Year of No Sugar Eve O. Schaub

Gold Stock Indicator: December 2016

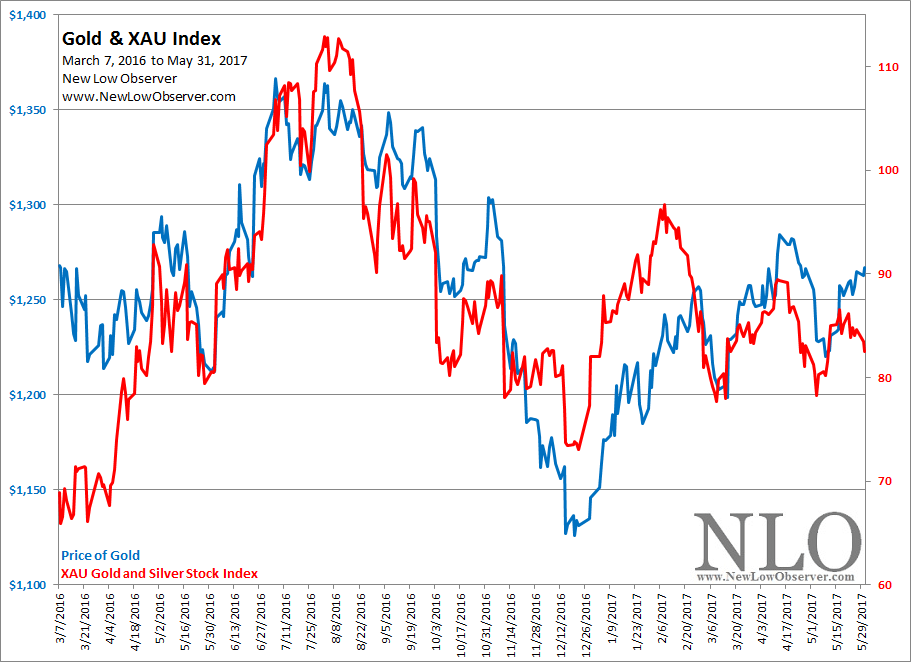
After our assessment on gold and gold stocks in October 2016, the price of both have declined but to varying degrees.  Gold declined by –7.82% while gold stocks, as represented by the Philadelphia Gold and Silver Stock Index (XAU), fell by –2.91%.

image

Coppock Curve: November 2016

Since the Coppock Curve flashed a buy indication at the end of March 2016, the Dow Jones Industrial Average rose by +8.3% while the S&P 500 gained +6.7%. Our strategy of purchasing Guggenheim S&P 500 Equal Weight ETF (RSP) has proven was well timed and is up +9.2%. Below is an update to the Coppock Curve.

Continue reading