Author Archives: nlo-admin

Review: Dover Corp.

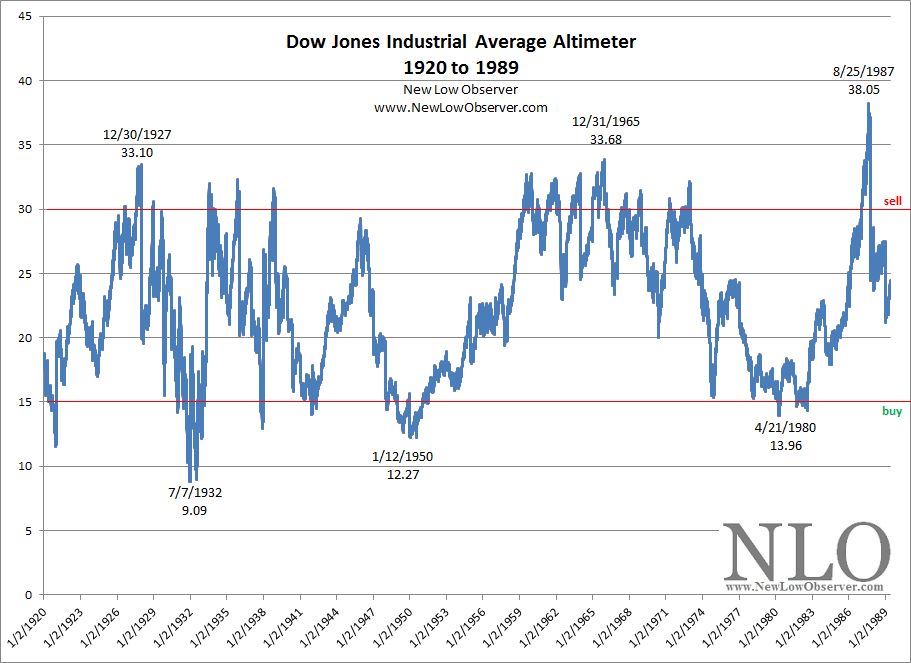
On September 10, 2015, we posted on the prospects for Dover Corp (DOV).  The following is our review on that posting.  We’ll review where Dover is on Edson Gould’s Altimeter and Dow Theory indications of potential upside and downside risks.

Interest Rate Monitor: June 2017

In our last posting on March 13, 2017, we said that the financial markets were widely anticipating that interest rates would increase.  However, we persist in the belief that the leading indication of interest rate direction comes from watching the direction of the 3-month Treasury, which is a market driven instrument.  As reflected in the chart below, we’re in for a bumpy ride ahead.

Continue reading

Coppock Curve: Index Studies

The following is a study of the Nasdaq Composite Index when applied to the Coppock Curve.  Our goals is to determine the period for the most optimal performance with the least amount of risk.  We provide data on the Nasdaq Composite Index from 1974 to the present.

The Coppock Curve is one of the technical indicators that we focus on for long-term buy signals for the stock market. The Coppock Curve is only useful as a BUY indicator when the chart goes from positive territory to the negative territory then turns decidedly upward. As previously indicated, the Coppock Curve does not provide SELL signals in any way. Once the signal turns upward (while in the negative territory), investors should consider buying stocks at the beginning of the month.

The following is the Coppock Curve analysis based on the “buy” indication and the subsequent performance.  The review of the Dow Jones Industrial Average can be found in our June 7, 2017 posting while the S&P 500 performance can be found in our June 8, 2017 posting.

Coppock Curve: Index Studies

The following is a study of the S&P 500 Index when applied to the Coppock Curve.  Our goals is to determine the period for the most optimal performance with the least amount of risk.  We provide data on the S&P 500 Index from 1954 to the present.

The Coppock Curve is one of the technical indicators that we focus on for long-term buy signals for the stock market. The Coppock Curve is only useful as a BUY indicator when the chart goes from positive territory to the negative territory then turns decidedly upward. As previously indicated, the Coppock Curve does not provide SELL signals in any way. Once the signal turns upward (while in the negative territory), investors should consider buying stocks at the beginning of the month.

The following is the Coppock Curve analysis based on the “buy” indication and the subsequent performance. We will follow this with the Nasdaq Composite in the coming days.  The review of the Dow Jones Industrial Average can be found in our June 7, 2017 posting.

Transaction Alert

The NLO team executed the following transaction(s):

Coppock Curve: Index Studies

The following is a study of the Dow Jones Industrial Average when applied to the Coppock Curve.  Our goals is to determine the period for the most optimal performance with the least amount of risk.  We provide data on the Dow Jones Industrial Average from 1931 to the present.

The Coppock Curve is one of the technical indicators that we focus on for long-term buy signals for the stock market. The Coppock Curve is only useful as a BUY indicator when the chart goes from positive territory to the negative territory then turns decidedly upward. As previously indicated, the Coppock Curve does not provide SELL signals in any way. Once the signal turns upward (while in the negative territory), investors should consider buying stocks at the beginning of the month.

The following is the Coppock Curve analysis based on the “buy” indication and the subsequent performance. We will follow this review with the S&P 500 and Nasdaq Composite in the coming days.

Transaction Alert

The NLO team executed the following transaction(s):

Continue reading

Quick Take: Stericycle

In our Nasdaq 100 Watch List posted on May 29, 2017, we discussed some attributes of Stericycle (SRCL) that we found interesting.  In this posting, we’ll cover some addition thoughts on the fundamentals of Stericycle.

Gold Stock Indicator: May 2017

Gold and gold stocks have been treading water since January 2017.  While a trading range has been established, there are ominous signs on the horizon.

image


Bitcoin: May 2017

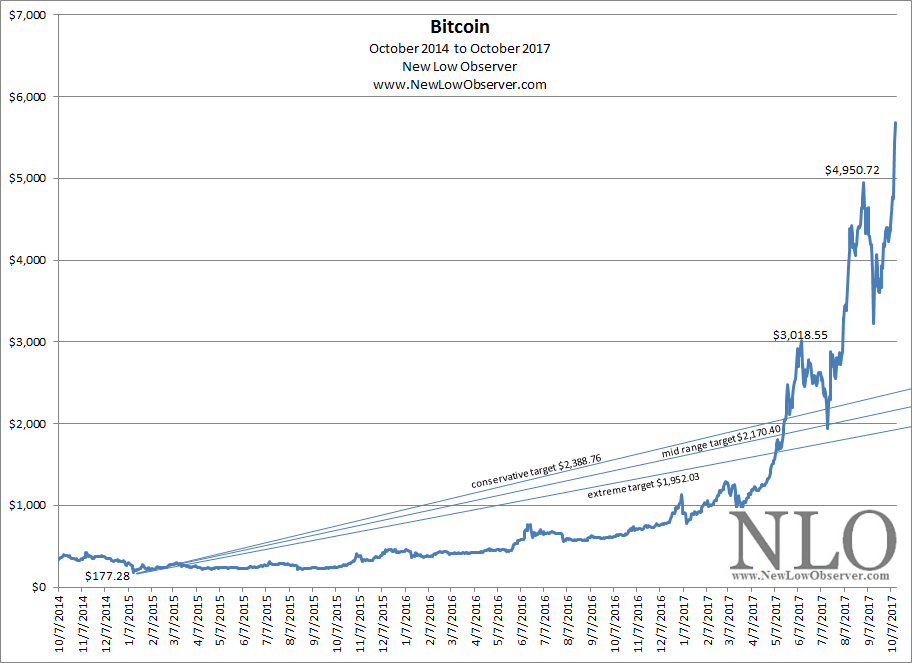
Bitcoin has been on a wild ride of late.  While surprising to some, with estimates of how much you would be a billionaire if you held from the inception, we’ve been providing upside and downside targets that have been achieved with relative ease and accuracy well in advance of the move (see our January 1, 2017 posting).  

Recently, Bitcoin has managed to rise as high as $2,476.30 on a closing basis according to Coindesk.com’s Bitcoin Price Index.  The closing high is actually well below the intraday high of $2,791.69 set on May 25, 2017.  We’re going to provide upside and downside targets based on the indicated closing high.

U.S. Dividend Watch List: May 26, 2017

Previous Year Performance Review

In our ongoing review of the NLO Dividend Watch List, we have taken the top five stocks on our list from May 27, 2016 and have checked the performance one year later. The top five companies on that list can be seen in the table below.

Symbol Name 2016 Price 2017 Price % change
CALM Cal-Maine Foods 45.74 40.65 -11.1%
HFC HollyFrontier Corporation 26.96 24.77 -8.1%
CAH Cardinal Health 78.15 73.10 -6.5%
NPBC National Penn Bancshares 10.72 10.72 0.0%
TIF Tiffany & Co. 62.54 86.18 37.8%
      Average 2.4%
         
DJI Dow Jones Industrial 17,873.22 21,080.28 17.9%
SPX S&P 500 2,099.06 2,415.82 15.1%

The S&P 500 rose +15.10% in the last year. However, the top five companies on our watch list gained only +2.40% due to underperformance of 4 companies. The worst performer was Cal-Maine Foods (CALM) which is a major producer of eggs. We thought that the bottom was near at the time but we were proven wrong. Falling not far behind was HollyFrontier (HFC) which fell -8.10%. We didn't believe the company was providing enough margin of safety until it traded below book value. Refining is a difficult business but the utilization rate is approaching full capacity (100%, see data) which suggests that pricing should firm up in the near future. We are not suggesting an outright buy at this level but a purchase here is clearly better than last year.

U.S. Dividend Watch List: May 26, 2017

Another week and it's another all-time high for the S&P 500. The index rose +1.40% for the week. We ended the week with 37 companies on our watch list this week. Continue reading

Nasdaq 100 Watch List: May 2017

Performance Review

Below is the performance of the Nasdaq 100 Watch List from May 2016:

symbol name 2016 2017  % chg
SRCL Stericycle, Inc. 97.47 82.4 -15.46%
WBA Walgreens Boots Alliance, Inc. 77.32 81.25 5.08%
SYMC Symantec Corporation 17.34 29.61 70.76%
BBBY Bed Bath & Beyond Inc. 44.58 34.85 -21.83%
GILD Gilead Sciences Inc. 86.97 64.5 -25.84%
AAL American Airlines Group Inc. 31.42 48.74 55.12%

The analyst estimates for the stocks are indicated in the following chart:

image

Looking at the performance, we can see that the analysts got the general direction of 4 of the 6 stocks.  The stock that exceeded analyst expectations was Symantec (SYMC) while Gilead Sciences (GILD) underperformed by a wide margin on the downside.

May 2017 Watch List

REIT: Index Crash from 1972-1979

Few are aware of the colorful history of the real estate investment trust industry.  Much of the mystery in the industry has to do with changes to company names and legal definitions of what a REIT actually is, thereby rendering the history to the realm of the forgotten.

A quick look at the REIT Share Price Index in 1979 (Brody, Michael. Sounder Ground. Barron’s. May 21, 1979. page 4.) should shed some light on an industry group that, from 1960 to December 1971, had experienced two jarring routs of –60% and –80%.  The REIT Index below has not survived to the present as a majority of the companies (greater than 80%) simply don’t exist after their failure/bankruptcy or forced mergers.

image

The reasons for the decline in the period from 1972 to 1974 are many. Surprisingly, investment analysts at the time were simultaneously arguing that falling and rising interest rates were the threat to the REIT industry.  As we enter a secular rising interest rate environment, REIT investors should check the foundation that their investments are build on.

see also: U.S. Realty: 1921-1939

REIT: U.S. Realty & Improvement

Currently, there is evidence to suggest that a new era in property investment has emerged.  Well managed and capitalized real estate investment trusts, more popularly known as REITs, are able to access the capital markets for funding malls, office buildings, hospitals, apartment building and mortgage financing. Long-term income is generated for investors and retirements are secured through the investment in REITs.

However, the history of real estate investment trusts is obscured by legal entanglements, trust busting, name changing and bankruptcies.  With a goal of unveiling the industry and its murky history, we’ll be posting stock price performance of REITs in some of the most volatile periods.

The history of REITs can be broken into several distinct periods:

  • 1886 to 1935
  • 1960 to 1980
  • 1980 to present

We’ll highlight anecdotal data from various companies from each respective period with added insight about how and why some of these companies, as reflections of the REIT industry, didn’t do as well as expected.  The goal of these articles is to give potential investors the needed perspective for proper risk assessment.

Continue reading

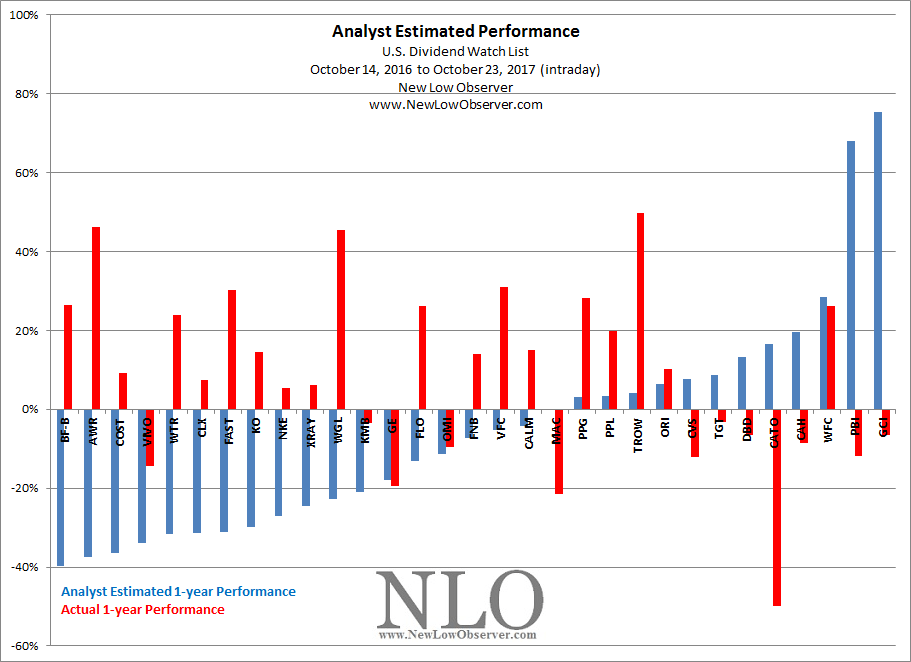
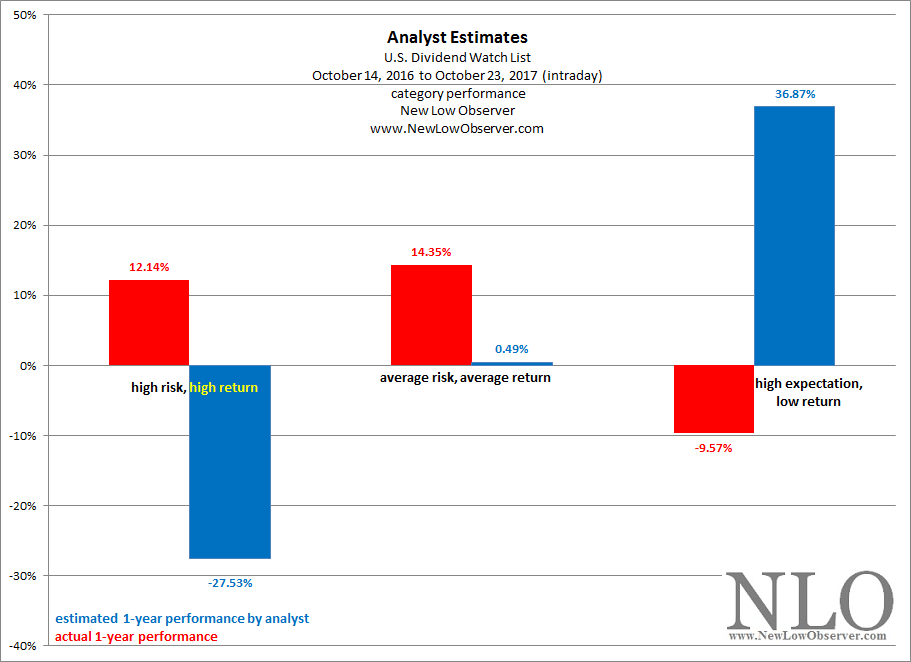
Analyst Estimates: U.S. Dividend Watch List

Below are the price projections based on analyst earnings estimates for our recent U.S. Dividend Watch List dated May 12, 2017. These estimates project the price change for the respective stocks over the next 12 months and the risk profiles associated with the estimates.