Author Archives: nlo-admin

Performance Review: December 5, 2014

Below is the 3-year total return performance of our Dividend Watch List from December 5, 2014 to December 5, 2017 as compared to the Dow Jones Industrial Average.

Performance Review: December 4, 2015

Below is the 2-year total return performance of our Dividend Watch List from December 4, 2015 to December 2, 2017 as compared to the Dow Jones Industrial Average.

Performance Review: December 3, 2010

Below is the 7-year performance of our Dividend Watch List from December 3, 2010 to December 1, 2017 as compared to the Dow Jones Industrial Average.

Continue reading

Performance Review: December 31, 2010

Below is the 7-year performance of our Dividend Watch List from December 31, 2010 to November 29, 2017 as compared to the Dow Jones Industrial Average.

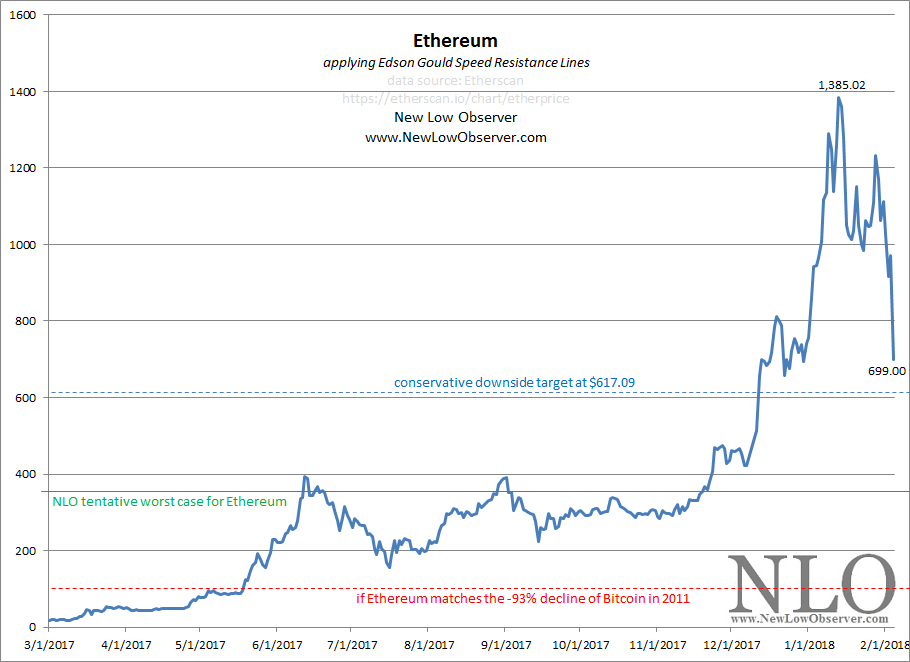
Bitcoin Downside Target

“The four most expensive words in the English language are ‘this time is different.” –John Templeton

image

Continue reading

Transaction Alert

On November 27, 2017, we executed the following transactions:

Continue reading

Transaction Alert

On November 22, 2017, we executed the following transactions: Continue reading

Dogs of the Dow: Part 3

The Dogs of the Dow investment strategy is designed to take advantage of high quality stocks that are undervalued within the Dow Jones Industrial Average.  The “dogs” are the ten stocks with the highest dividend yield in descending order.  Courtesy of the website Dogs of the Dow, we are presenting the performance of this investment strategy compared to the Dow Jones Industrial Average since 1996:

year Dogs of Dow DJIA
2016 16.10% 13.40%
2015 -1.20% -2.20%
2014 7.00% 7.50%
2013 30.30% 26.50%
2012 5.70% 7.30%
2011 12.20% 5.50%
2010 15.50% 11.00%
2009 12.90% 18.80%
2008 -41.60% -33.80%
2007 -1.40% 6.40%
2006 24.80% 16.30%
2005 -8.90% 0.60%
2004 0.50% 3.10%
2003 23.60% 25.30%
2002 -12.20% -16.80%
2001 -7.80% -7.10%
2000 2.70% -6.20%
1999 1.10% 25.20%
1998 7.80% 16.10%
1997 17.30% 22.60%
1996 24.50% 26.00%

In prior articles (Part 1 & Part 2), we have proposed that using the same narrow group of stocks and applying various methods can generate far greater returns.  However, as investors, our primary consideration isn’t as much about profits as it is about losses.  We would rather know, in advance, what to expect when markets are falling rather than when they are rising.  Below we have outlined the performance of the Dogs of the Dow (and others) when the Dow Jones Industrial Average has declined in 2000, 2001, 2002, 2008, and 2015.

Dogs of the Dow: Part 2

To refresh, the Dogs of the Dow investment strategy is based on the work of Michael O’Higgins’ book Beating the Dow.  This approach is by no means the first attempt at a mechanized approach to investing in the Dow Jones Industrial Average.  The June 1951 Journal of Finance article by Henry S. Scheider titled “Two Formula Methods for Choosing Common Stocks” was the earliest system that we could find which covers a similar investment strategy as Dogs of the Dow from 1914 to 1948.  The results give mixed picture on he data presented (we’ll have to save that for another day.)

When looking at the website Dogs of the Dow, we find a complete list of annual performance of stocks and their performance from 1996 to the present.  In our posting of Part 1, we showed how the Dogs of the Dow performed from November 4, 2016 to November 15, 2017.  We also compare the performance of the highest yielding stocks to price-to-earnings, price-to-book and lowest dividend yield.  The results confirmed what we’ve seen in the performance reviews of the U.S. Dividend Watch Lists.

In an attempt to better understand the data and avoid the bias that goes along with data that we find appealing to our senses, we’ve generated a breakdown of the Dogs of the Dow  for 2017 and compared it to the 2017 year-to-date YTD performance of the various fundamental metrics to see what would have generated higher returns, if at all.  In addition, we’ve included the top three and top ten (traditional Dogs) to see if there is any material difference in performance over the covered period in question.

In Part 3 of this series on the Dogs of the Dow, we will see how the stocks perform in the year 2008.  Thus giving us a more complete picture of the risks associated with using a mechanical investment strategy.

Dogs of the Dow: Part 1

Based on the work of TradingTips.com, the following are the Dogs of the Dow (ten highest dividend yielding stocks) from November 4, 2016 and their performance as of November 15, 2017 (intraday):

symbol name total return
PFE Pfizer Inc. 23.93%
CSCO Cisco Systems, Inc. 17.63%
KO The Coca-Cola Company 16.25%
VZ Verizon Communications Inc. -1.36%
MRK Merck & Co., Inc. -3.73%
XOM Exxon Mobil Corporation 2.01%
CAT Caterpillar Inc. 68.31%
CVX Chevron Corporation 15.81%
BA The Boeing Company 95.67%
IBM IBM 1.38%
Average % change 23.59%

TradingTips.com also published a subset of the above list called the Small Dogs. (five lowest priced of the above 10 stocks). Those stocks from November 4, 2016 to November 15, 2017 (intraday)  have had the following performance:

symbol name total return
PFE Pfizer Inc. 23.93%
CSCO Cisco Systems, Inc. 17.63%
KO The Coca-Cola Company 16.25%
VZ Verizon Communications Inc. -1.36%
MRK Merck & Co., Inc. -3.73%
Average % change 10.54%

Below, we have generated the average performance of the top 3 Dow Jones Industrial Average (DJIA) stocks in the listed categories From November 4, 2016 to November 15, 2017 (intraday).  The results show a considerable contradiction to the conventional wisdom on this topic.

Continue reading

Transaction Alert

On November 13, 2017, we executed the following transactions: Continue reading

Performance Review: November 13, 2009

Below is the 8-year performance of our Dividend Watch List from November 13, 2009 to November 14, 2017 as compared to the Dow Jones Industrial Average.

Continue reading

Bitcoin: November 2017

On October 13, 2017, when Bitcoin was quoted at $5,640, we said the following:

“We are throwing in the towel on taking the $7,166.29 [our upside target] figure, and any future upside targets that go uncorrected to the tune of –50% or more, as something we can feel confident is worth the speculation.”

Our upside target of $7,166.29 has come and gone.  Now comes our updated downside targets for those mindful of the risks.

U.S Dividend Watch List: November 10, 2017

The market is making an attempt to best the 2,600 level on S&P 500. Will wait and see if the bull could make this happen and closed the year above that level. This has been a slow and steady incline since 2,400 mark back in August. A correction to 50 days SMA, which is the range of 2,550, is probable and healthy. We do hope that some kind of correction is in the near future. When that occurs, we have 66 companies on the list as a starting point. Continue reading

Canadian Dividend Watch List: November 2017

Performance Review

Below is the 1-year performance of our Canadian Dividend Watch List from November 18, 2016 to November 10, 2017 as compared to the Toronto Stock Exchange.

symbol Name total return
EMP-A.TO Empire Company Limited 46.23%
CCA.TO Cogeco Communications Inc. 39.05%
NWC.TO North West Company Inc. 36.28%
AX-UN.TO Artis REIT 30.72%
D-UN.TO Dream Office REIT 29.71%
GS.TO Gluskin Sheff + Associates 22.87%
ET.TO Evertz Technologies Limited 22.09%
FFH.TO Fairfax Financial Holdings 18.04%
EMA.TO Emera Incorporated 13.04%
CUF-UN.TO Cominar REIT 11.40%
ACD.TO Accord Financial Corp. 10.17%
REF-UN.TO Canadian REIT 6.05%
MRU.TO Metro Inc. 4.00%
REI-UN.TO Riocan REIT 3.39%
BEI-UN.TO Boardwalk REIT 2.72%
ENGH.TO Enghouse Systems Limited -3.90%
  average % change 18.24%
     
TSX Toronto Stock Exchange 8.18%

While the entire list averaged a sizable gain above the TSX, the top three in the respective value categories had the following results:

high yield 23.95%
low yield 6.05%
high p/e 3.95%
low p/e 14.81%
high p/b 7.66%
low p/b 14.95%

One stock that we considered was Fairfax Financial (FFH.TO).  At the time, we said the following:

“Our recommendation for FFH.TO, for investors willing to accept the risk, is a three stage purchase plan with the first purchase taking place at $581 and below with 50% of intended funds.  The second and third purchases at $479.95 and $363.52 with 25% of remaining funds, respectively.”

Since that time, FFH.TO declined below $581 with an ultimate low of $557.  Below is the updated review of FFH.TO:

image

Continuing with Dow Theory, the expectation should be that exceeding the 50% Principle (from 41 to 51) means that there is a good chance that FFH.TO will go to the previous all-time high in the Altimeter.  However, the January 2017 dividend reduction could be an indication of difficult times ahead.  The highlighted double-top and exceeding the 50% Principle (under the assumption of buying below $581) means that FFH.TO’s minimum gain of +18% in the last year exceeds normal expectations.