
-
Topics
Archives
-
-
Recent Posts
-
-
-
-
Category Archives: ethereum
Bitcoin Saturation Point is Here
Recently the price of Bitcoin has increased to a market cap above one trillion dollars. This had generated tremendous excitement both for, and against, the continued increase in the crypto currency.
For those hoping that Bitcoin will increase in price, achieving a market capitalization of $1 trillion is a testament to the future viability of crypto currencies. Meanwhile, for those in disbelief of the value of cryptocurrencies, the $1 trillion level highlights the extreme that the bubble has managed to attain.
Because we only follow the price, we were struck by a point made by Charlie Munger of Berkshire Hathaway in 2018:

The question has arisen, “When will ‘they’ create more Bitcoin?” As, Charlie Munger has said, if you have the incentive, new coins will emerge. In our view, that creation of more Bitcoins has already taken place in the form of the thousands of “alt coins” that are free-riding on the concept but have zero value. Some of the alt coins, ranked in the range from 451-500 (by market cap), have a combined market capitalization of over $2 billion dollars. Does anyone believe that the coin ranked 499th will amount to anything down the road? We don’t.
When we run down the numbers for the total value of all the coins with market caps ranked from 3-1,000, which excludes Bitcoin and Ethereum, the total market cap is approximately $484 billion dollars.

As with all new innovations in their early stage, there will be hundreds of competitors lining up to become number one. However, as the cycle for cryptocurrency evolves from the start up phase to the growth stage (can you believe it, we’re only in the start up phase), there will be many “currencies” that will die along the way.
There is a stock market investing theory that says that if you buy and sell only the two leading stocks in a specific industry you will be able make a considerable amount of money. The thinking behind this theory is that the industry will generally do as well or bad as the leaders. Therefore, by using the two leading stocks to confirm a rising or declining trend, you will have the stocks that will thrive in the good time and not die off in the bad times. Almost all the other participants will be gone or become absorbed in the process.
As with most mature industries, there are 5-6 companies that have a meaningful impact on the direction of the business. We don’t have a clue about the other 3-4 crypto currencies that will emerge as the leaders. However, for now, the top two in terms of market capitalization, Bitcoin and Ethereum, are the contenders to be around if central banks don’t take over the concept.
The potential $400 billion (and growing) waiting to be destroyed by willing participants, who either hope the ride will continue or are unaware of the probabilities, will suffer greatly from this creative destruction. The Bitcoin saturation point is here, however, it isn’t in Bitcoin and Ethereum, instead, it is the alt coins.
See Also:
-
Bitcoin Archive (our price analysis since 2013)
-
Bitcoin Cycles, 2010-2021
-
Ethereum, (price analysis/references)
Bitcoin: May 2019
On January 17, 2018, we concluded our analysis with the following remarks:
“Anyone willing to participate in Bitcoin should be willing to accept that the price could easily decline –70%, as has been the average of all previous Bitcoin busts (found here). Anyone who participates in anything other than Bitcoin should expect a minimum –90% to –99% decline if, at the same time, Bitcoin declines –70% or more.”
From the peak in the price of Bitcoin at $19,343.04, the decline in Bitcoin that followed was –83%. This falls in alignment with our longstanding view that a drop of –70% is the average decline after a parabolic peak. In addition, the decline in Ethereum was –93%, confirming our work that a drop of –90% or more was possible.
As Bitcoin has increased from the low (so far), we have updated our upside and downside targets below.
Ethereum: Stunning -93% Decline
On February 5, 2018, in an article titled “Ethereum: Downside Targets”, we said the following:
“In addition to the conservative downside target, we have indicated the level Ethereum would be at if it lost –93% (red line) as Bitcoin did in the period from June 2011 to November 2011 (yeah, it took only five months). Such a decline in Ethereum would bring the price to $96.95.”
On December 14, 2018, Ethereum was quoted at a low price of $84.06. The difference between the high of $1,385.02 and $84.06 is equal to –93.93%. This decline was similar to the decline experienced by Bitcoin in 2011.
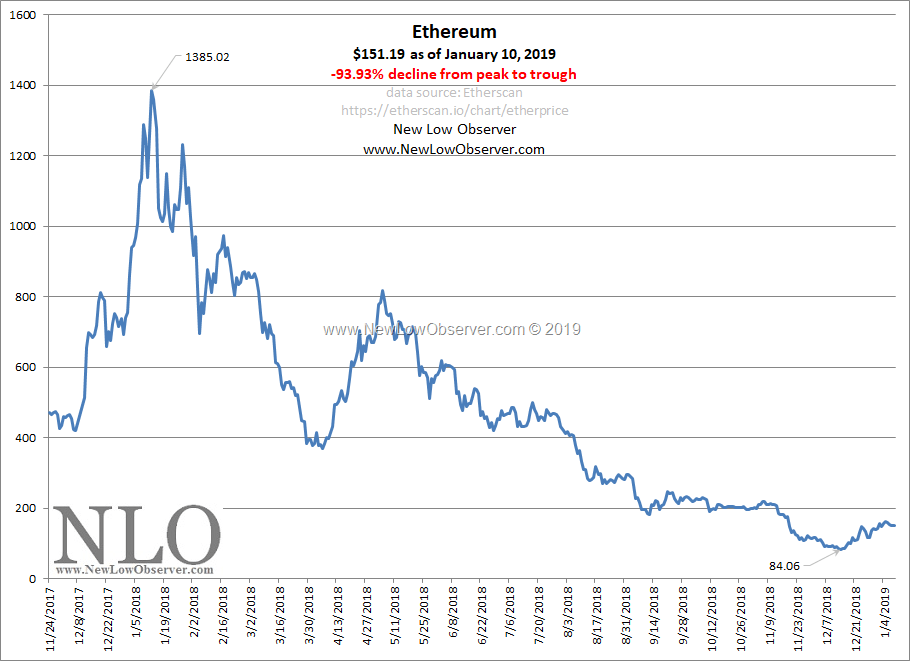
On January 24, 2018, in a lead-up to the February 5, 2018 article, we referenced the comparison between Bitcoin in the run-up to the 2011 peak and the run-up to the Ethereum peak in 2018, suggesting that if they can rise in the same percentage then they can decline in a similar fashion. This latest example only solidifies our studies of failure in markets and elsewhere.
Posted in ethereum, The Study of Failure
Ethereum: September 2018
When Ethereum was trading at $384.49 on April 2, 2018, we said the following:
“There is a lot on the line for Ethereum. Currently, the cryptocurrency is slated for the following downside targets:
All that remains is the last downside target of $96.95. Based on the fact that Ethereum has achieved the $188.13 level, we are posting our upside target using the May 5, 2018 peak.
Ethereum: August 2018
On February 5 , 2018, when Ethereum was trading at $699, we said the following of the cryptocurrency:
“In addition to the conservative downside target, we have indicated the level Ethereum would be at if it lost –93% (red line) as Bitcoin did in the period from June 2011 to November 2011 (yeah, it took only five months). Such a decline in Ethereum would bring the price to $96.95. We don’t expect this but must be realistic about the prospects regardless of our own personal expectations.
“Finally, we have included our own worst case scenario (green line) based on one half the difference between Gould’s extreme downside target at $461 and the –93% experienced by Bitcoin in 2011. This would bring the price of Ethereum to $279.31. Although this seems like a dire call for Ethereum, in reality it is not unusual to see an –80% decline in price from such extreme parabolic moves.”
As we write, Ethereum has declined to $266, just slightly below our worst case scenario target of $279.31. Below we have included our technical assessment of ETH at the current price.
Ethereum: April 2018
On February 16, 2018, we said the following of Ethereum:
Failure of the price of Ethereum to achieve the $1,040.05 by a substantial amount ($1,111 or more) would be an indication that the price will retest the $695.08 level. A retest of the $695.08 level without falling below the level would be constructive for a new bull market. It would be a second failure to decline below the $692.99 level. According to Dow Theory, this would one of the most constructive bullish indications going forward. Alternatively, if Ethereum fell below $692.99 then the expectation is that $617.09 is the minimum downside target.
Unfortunately, Ethereum was unable to exceed $1,040.05 and has met our expectation of $617.09 as the minimum downside target. As of April 2, 2018, Ethereum is now trading around $384.
Ethereum Seeks Footing at Lower Levels
On February 16, 2018, we said the following of Ethereum:
“Failure of the price of Ethereum to achieve the $1,040.05 by a substantial amount ($1,111 or more) would be an indication that the price will retest the $695.08 level. A retest of the $695.08 level without falling below the level would be constructive for a new bull market. It would be a second failure to decline below the $692.99 level. According to Dow Theory, this would one of the most constructive bullish indications going forward. Alternatively, if Ethereum fell below $692.99 then the expectation is that $617.09 is the minimum downside target.”
Unfortunately, Ethereum did not managed to exceed the $1,040.05 level. In addition to achieving the $695.08 level, Ethereum has fallen below the conservative downside target of $617.09, as mentioned in our February 5, 2018 posting.
Bitcoin Upside Targets
Like Ethereum, Bitcoin is rebounding nicely from the February 5, 2018 low. Below are the upside targets for Bitcoin:
Posted in 50% principle, Bitcoin, Dow Theory, ethereum
Ethereum Upside Targets
As Ethereum recovers from the low set at $695.08 on February 5, 2018, the expected upside targets are as follows:
Posted in 50% principle, Dow Theory, ethereum
Ethereum: Downside Targets
In a previous posting titled “Goldman Plays with Numbers,” we did a side-by-side comparison between Bitcoin and Ethereum in two different periods. The periods in question happens to have the same percentage change, approximately +13,400%.
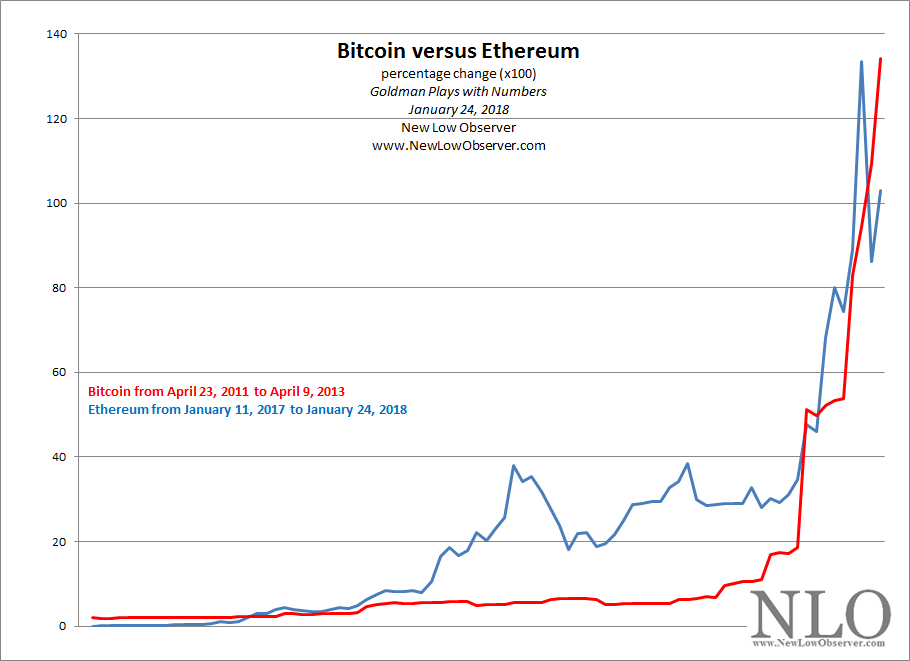
As with the same percentage increase, it is reasonable to expect the same percentage decreased that followed. For the price of Bitcoin, it plunged –93.07% from June 8, 2011 to November 18, 2011. Below is our charting of three scenarios for downside risk to Ethereum.
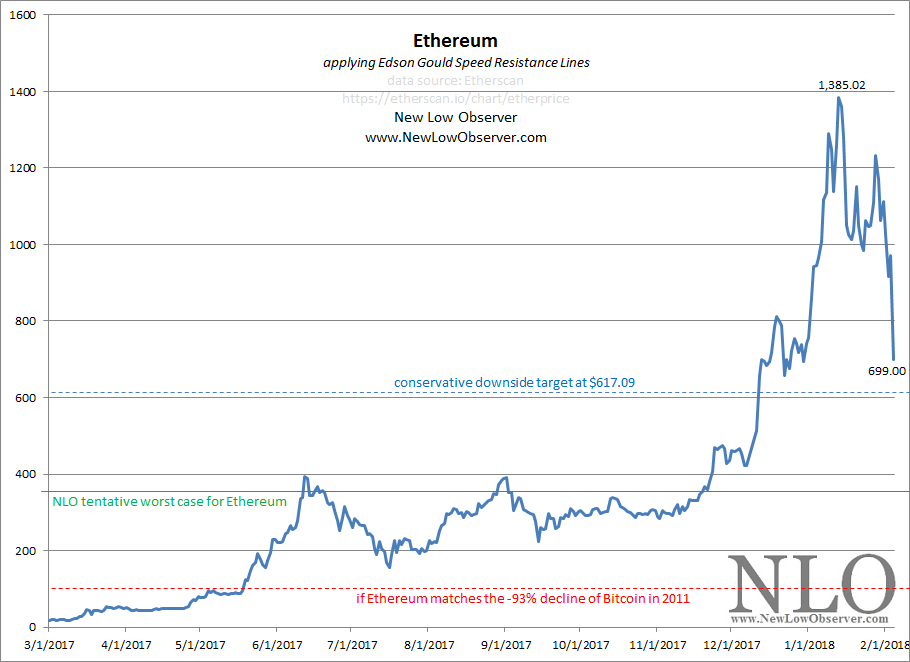
Based on the work of Edson Gould, the conservative downside target for Ethereum is at $617.09 (blue line). However, due to the extremely volatile nature of cryptocurrencies, we have to expect that the extreme downside target is more than likely. The purpose of putting the conservative downside target at all is to demonstrate that it will be achieved after a given peak in price is established and the trend is clearly to the downside.
In addition to the conservative downside target, we have indicated the level Ethereum would be at if it lost –93% (red line) as Bitcoin did in the period from June 2011 to November 2011 (yeah, it took only five months). Such a decline in Ethereum would bring the price to $96.95. We don’t expect this but must be realistic about the prospects regardless of our own personal expectations.
Finally, we have included our own worst case scenario (green line) based on one half the difference between Gould’s extreme downside target at $461 and the –93% experienced by Bitcoin in 2011. This would bring the price of Ethereum to $279.31. Although this seems like a dire call for Ethereum, in reality it is not unusual to see an –80% decline in price from such extreme parabolic moves. Additionally, we don’t expect Ethereum to succumb to the same amount of pressure that Bitcoin did as the concept of blockchain technology is more salient to the general public today than it was in 2011.
Goldman Plays with Numbers
On MarketWatch.com we saw the following article:

In the article, it quotes Goldman Sachs analysts as saying, “We also believe that cryptocurrencies have moved beyond bubble levels in financial markets, and even beyond the levels seen during the Dutch ‘tulipmania’ between 1634 and early 1637.”
In addition to concerns about bitcoin, the article highlights cool charts that compare Ether to previous bubbles, as seen below.
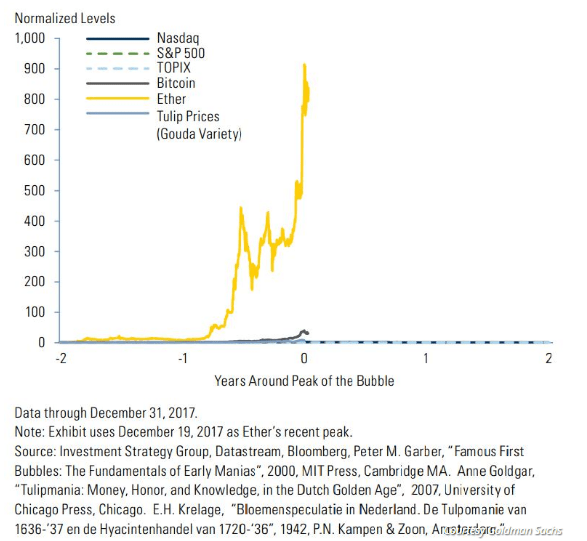
We thought, if Goldman Sachs can play with numbers then why can’t we? So we decided to pit the price rise in Bitcoin from April 23, 2011 to April 9, 2013 with the price rise in Ethereum from January 11, 2017 to January 24, 2018. We just wanted to see the two periods back to back.
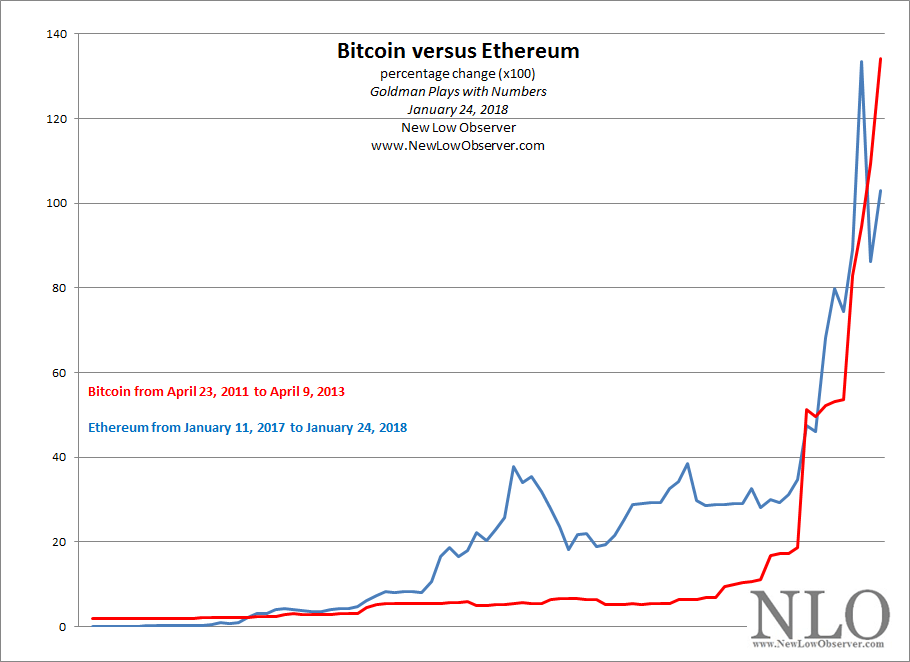
Playing with the numbers is fun because we picked a period that Goldman has chosen to overlook to compare Ethereum to. It turns out, if you don’t know the history of Bitcoin and other relevant bubbles, then you’ll miss the last time they probably got it wrong. The importance of this chart is that perspective matters.
We know that the bubble will bust at some point, the purpose of this piece is to demonstrate that what isn’t shown can be as important as what is shown.
Posted in Bitcoin, ethereum, Goldman Sachs
Crypto Bubble? What Makes You Say That?
In a graphic provided by the cost information website HowMuch.net, there is a eye opening review of crypto currencies compared to well known companies like Facebook,PayPal, and others.

On one side are companies providing services that seems to be increasing in demand. PayPal is an online payment system, Expedia is an online travel agency, Zillow is an online real estate resource, Brighthouse Financial is an insurance company, Groupon is an e-commerce marketing company. On the other side, there are five different crypto currencies.
There is no way that so many cryptocurrencies can exist, simply to do the same thing. There will have to be winners and losers. This reminds us about the market share of cell/smart phones and the change that occurred over time. In our November 7, 2010 article titled “Market Price and Market Share” we highlighted how much the cell phone market change from the the peak of the dot-com bubble to 2010. In that time, the top cell phone makers (now called “smart” phones) changed in unexpected ways.
| Top Mobile Phone Vendors 1999 | |
| Vendor | market share |
| Nokia | 32.00% |
| Qualcomm | 14.80% |
| Ericsson | 12.70% |
| Motorola | 11.20% |
| Audiovox | 7.40% |
| Samsung | 6.70% |
| Sony | 6.60% |
| source: RCR. July 5, 1999. Dataquest Inc. page 1. | |
| Top Mobile Phone Vendors 2010 | |
| Vendor | 3Q market share |
| Nokia | 32.40% |
| Samsung | 21.00% |
| LG Electronics | 8.30% |
| Apple | 4.10% |
| R.I.M. | 3.60% |
| Others | 30.50% |
| Total | 99.90% |
| Source: IDC Worldwide Quarterly Mobile Phone Tracker, October 28, 2010 | |
| Top Mobile Phone Vendors 2016 | |
| Vendor | 3Q market share |
| Samsung | 20.00% |
| Apple | 12.50% |
| Huawei | 9.30% |
| OPPO | 7.00% |
| Vivo | 5.80% |
| Others | 45.40% |
| Total | 100.00% |
| Source: IDC Worldwide Quarterly Mobile Phone Tracker, October 26, 2016 | |
What we always like to point out is that Nokia was the biggest by market share in 1999 and 2010 and yet it wasn’t the most innovative. Also, in 1999, Apple was nowhere to be found on the list of top five mobile phone vendors and yet it is among the top two today. Samsung has managed to stay among the top 6 in spite of not having the cache of Apple or (dare we say it) Rimm.
Which brings us back to the cryptocurrencies. Whoever is on top today is likely to not be a contender down the road. In fact, we believe that a yet-to-be-determined entrant will likely supplant Bitcoin as the “it” cryptocurrency. How are we going to find out the latest and greatest cryptocurrency? It will take a deflation and inflation cycle to get us there.
For now, keep in mind that there were hundreds of manufacturers of planes, trains, automobiles and mobiles phones before there were the big three. Deflation of the boom in cryptocurrencies will go a long way towards separating the wheat from the chaff.
Posted in Bitcoin, bubble, ethereum, market share