Below are the valuation targets for Polaris Industries (PII) for the next 10 years. Continue reading
-
Topics
Archives
-
-
Recent Posts
-
-
-
-

Below are the valuation targets for Polaris Industries (PII) for the next 10 years. Continue reading
Below are the valuation targets for Bank of Hawaii (BOH) for the next 10 years. Continue reading
Tilray (TLRY) recently hit a closing low of $99.50. If the upside move follows the minimum expected retracement, based on Dow Theory, then we’re looking for the following minimum targets:
Posted in TLRY
Previous Year Performance Review
In our ongoing review of the NLO Dividend Watch List, we have taken the top five stocks on our list from September 22, 2017 and have checked the performance one year later. The top five companies on that list can be seen in the table below.
| Symbol | Name | 2015 Price | 2016 Price | % change |
| SCG | SCANA Corporation | 55.22 | 34.86 | -36.9% |
| SJM | JM Smucker | 104.59 | 110.16 | 5.3% |
| HRL | Hormel Foods Corp. | 31.27 | 40.01 | 28.0% |
| ATNI | Atlantic Tele-Network | 50.75 | 72.40 | 42.7% |
| CAG | ConAgra Foods | 33.15 | 37.45 | 13.0% |
| Average | 10.4% | |||
| DJI | Dow Jones Industrial | 21,987.56 | 26,743.50 | 21.6% |
| SPX | S&P 500 | 2,502.22 | 2,929.67 | 17.1% |
The top five companies didn't do as well as the market rising only 10.4%. Biggest hold back of that gain came from SCANA Corp (SCG) which lost 36.9%. This is what we said about SCANA a year ago.
Trading at the yearly low is an electric utility company, SCANA Corp (SCG). Based out of South Carolina, SCANA is a 7.9B company that has been around since 1924. Our team know little about this company but one important fact loom over this company. There is a class action lawsuit on its executives that they have violated federal securities laws. While we can't fully recommend that our reader consider it for assessment until the smoke is clear, we will keep the company on our list until further noticed.
The best performer was Atlantic Tele-Network (ATNI) which gained 42.7% in one year. Our team, however, didn't know much about the company and was focused on two household names, JM Smucker (SJM) and Hormel Foods (HRL) which gained 5.3% and 28.0% respectively.
U.S Dividend Watch List: September 21, 2018
If you missed our commentary on Dow Theory this month, I suggest one go back and review it. It may seems strange at this level to put money to work but investing should always be forward looking proposition. Positioning yourself in this market will be key and we always position ourself with high quality company utilizing the dividend achiever approach as a proxy for quality. As such, here are the company on our watch list this week. Continue reading
Posted in Dividend Achiever Watch List, Dividend Achievers, Dividend Watch List
Tagged members
Below is the Watch List for September 2018.
The Dogs of the Toronto Stock Exchange 60 largest market cap stocks is continuing the pattern that we observed with the the highest yielding stocks severely underperforming all other categories.
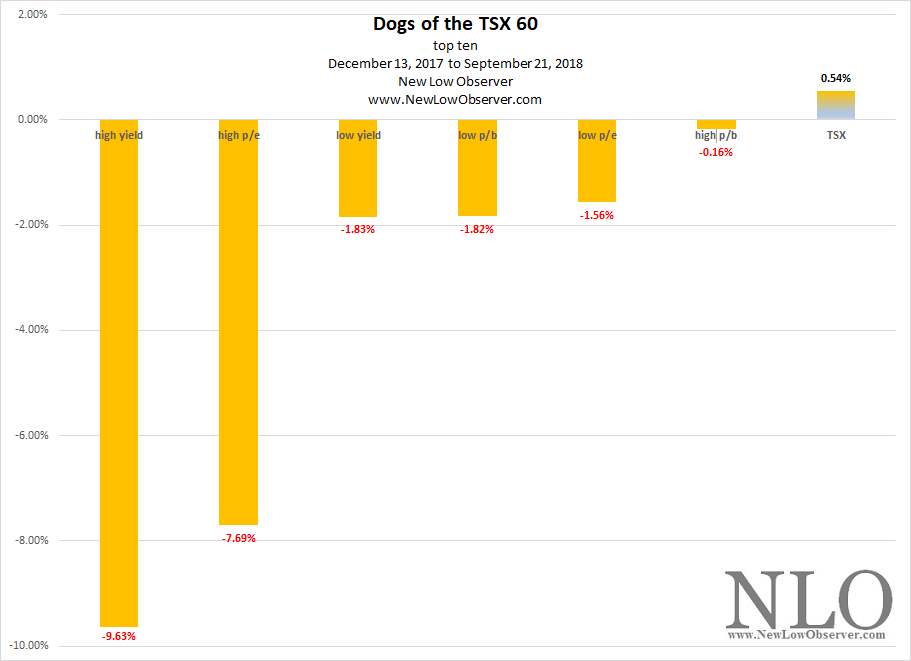
Below is a list of the various stocks within each category and their respective performance since December 13, 2017. Continue reading
On September 13, 2018 when Tilray Inc. (TLRY) was trading at $118.00, we said:
“Below we outline the downside targets for both current price of $118 and $236 for when/if the stock doubles from the current price. The conservative downside target is fairly assured to occur in either case. From the $118 level, a decline to the $66.67 level would be a natural retest of the $77.89 level set on September 7, 2018.”
Since September 13, 2018, TLRY has increased as high as $300 on an intraday basis with a closing high of $214.06. From what we can tell, the runup has dissipated for now. On the downside, we see TLRY declining to the $102.92 target at minimum and it may achieve the the extreme downside target of $66.67 as outlined in our previous posting.
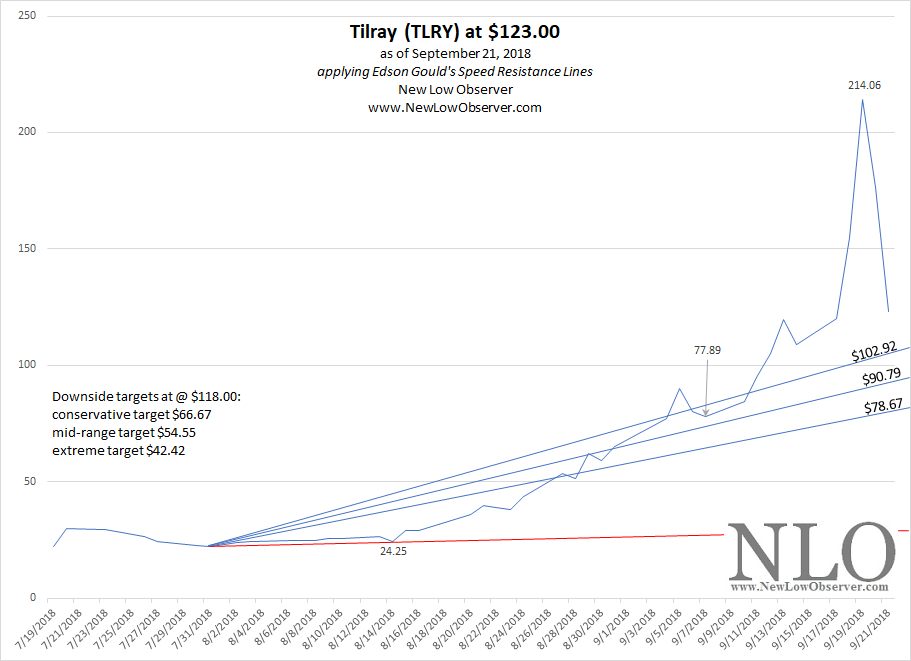
The nature of a parabolic rise is the manifestation of the price going to extremes. Speed Resistance Lines are the best measure of the extreme on the way down. It is the same going down as it is for going up. Therefore, we would not be surprised to see TLRY go as far down as $$42.42.
Posted in parabolic, Speed Resistance Lines, SRL, TLRY
Ideally, the Dow Jones Industrial Average (DJIA) closes above the January 2018 peak today.
W.W. Grainger (GWW) is a stock that we currently hold and has run-up significantly in the last year. In this post we will review Edson Gould’s Speed Resistance Lines [SRL] and Altimeter for GWW.
Speed Resistance Lines are most often used by us to estimate downside targets. Based on the increase from the August 28, 2017 low and the August 21, 2018 high, we have arrived at the following downside targets.
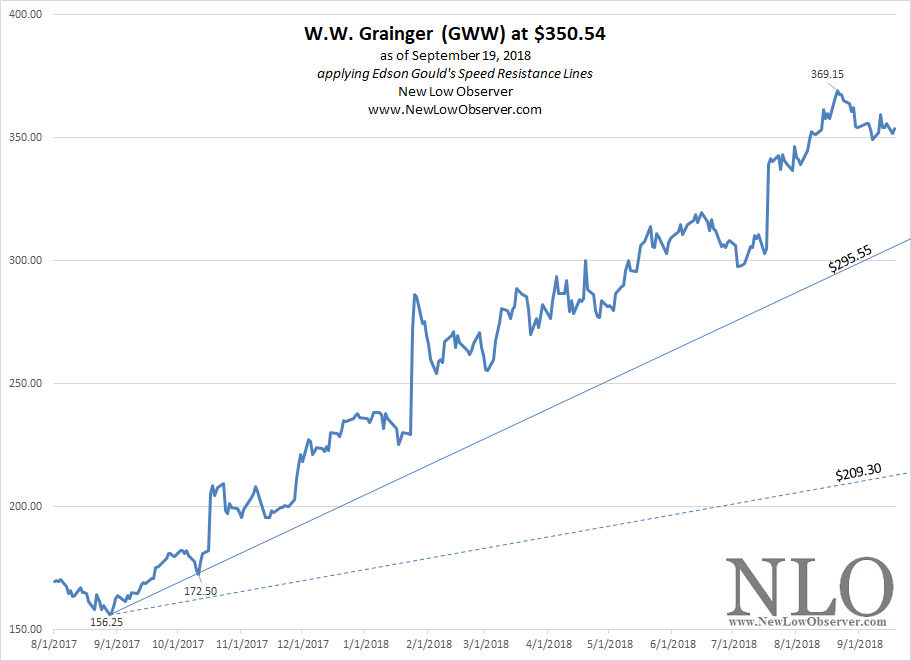
It should be noted that the chart above does not include the extreme downside target. If the August 21, 2018 price is the peak then our best guess is that GWW will decline below the August 28, 2017 low. Our interpretation on the SRL may not play out for a while, however, the Altimeter adds significant insight.
Posted in downside, Edson Gould, GWW, Speed Resistance Lines, SRL
Below is an updated Altimeter for General Electric (GE).
Posted in Altimeter, GE, General Electric
According to Morningstar.com, Harsco Corp. (HSC) “… provides industrial mill services to steel and nonferrous metal producers in more than 30 countries, including the United States.”
The history of Harsco’s (HSC) price history is important to the current activity in the stock price. In the review, we cover the history of the stock price based on the Edson Gould’s Speed Resistance Lines [SRL] with Dow Theory.
Downside Target Review
In the period from 1982 to 1990, the price of HSC rose from a low of $2.50 to a high of $9.66. Based on this information, we arrived at the following downside targets:

We’ve highlighted the point made in Dow Theory that a stock will often retest a previous low after a prior peak in the stock price. In this case, the retest level was the $5.88 price which was ultimately penetrated to the downside to the ultimate low of $4.50 in 1990.
In the period from 1990 to 2000, HSC had the following downside targets:
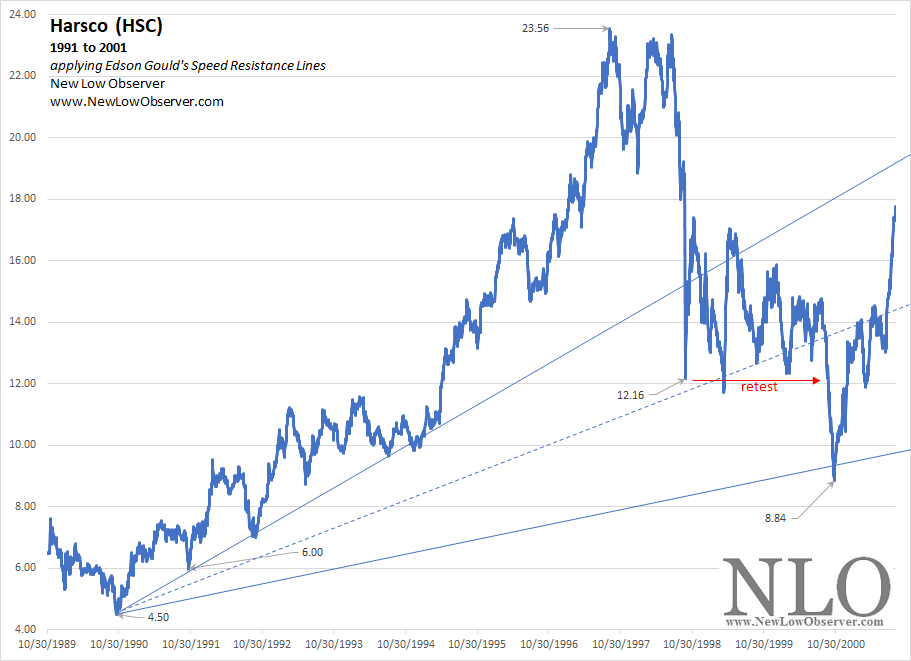
The Dow Theory retest after a major decline lasted over a period of two years from 1998 to 2000. All of the downside targets were achieved.
In the period from there was a decline that appears worth mentioning because it occurred within a rising trend that culminated in peak price that was three times the 2002 high. In the runup from the 2000 low to the 2002 peak, HSC had the following downside targets:
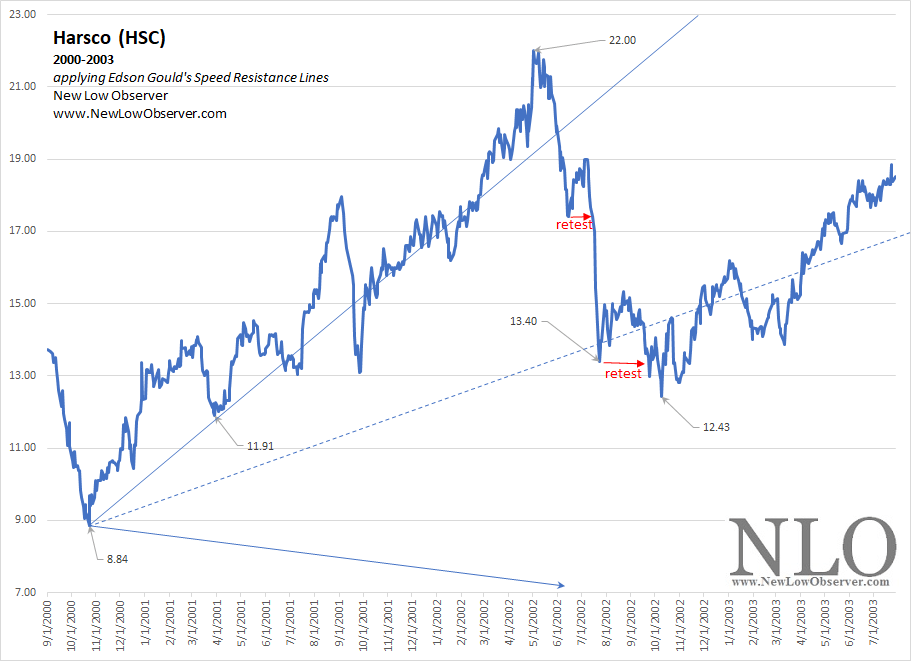
The Dow Theory retest after the peak was consistent and could have been at either of the two points indicated on the chart. If you missed the first indicator then you had a second shot at getting the retest at the second major low in the stock.
Worth pointing out is the fact that the extreme downside target of $7.33, from a technical standpoint, was suggesting much lower levels than could be indicated on this chart. We wonder if the low of HSC in 2016 at $3.67 might have been indicated in the SRL of 2000 to 2003.
2000-2018: Upside and Downside Targets
Below are the upside and downside targets based on the low of 2000 to the peak of 2016.
According to Yahoo!Quotes, Advance Auto Parts (AAP) “… provides automotive replacement parts, batteries, accessories, and maintenance items for domestic and imported cars, vans, sport utility vehicles, and light and heavy duty trucks.”
Below are the downside support targets based on the high of $199.38 and the upside resistance targets based on the $79.26 low.
Posted in 50% principle, AAP, Edson Gould, Speed Resistance Lines, SRL
According to Yahoo!Finance, ShotSpotter Inc. (SSTI) is, “…provides software-as-a-service based gunshot detection solutions for law enforcement officials and security personnel in the United States, South Africa, and internationally.”
ShotSpotter IPO’d on June 7, 2017 and was priced at $11. In the last 15 months, SSTI has managed to increase the share price +471%. Based on the closing price of $62.81, we have the following downside targets:
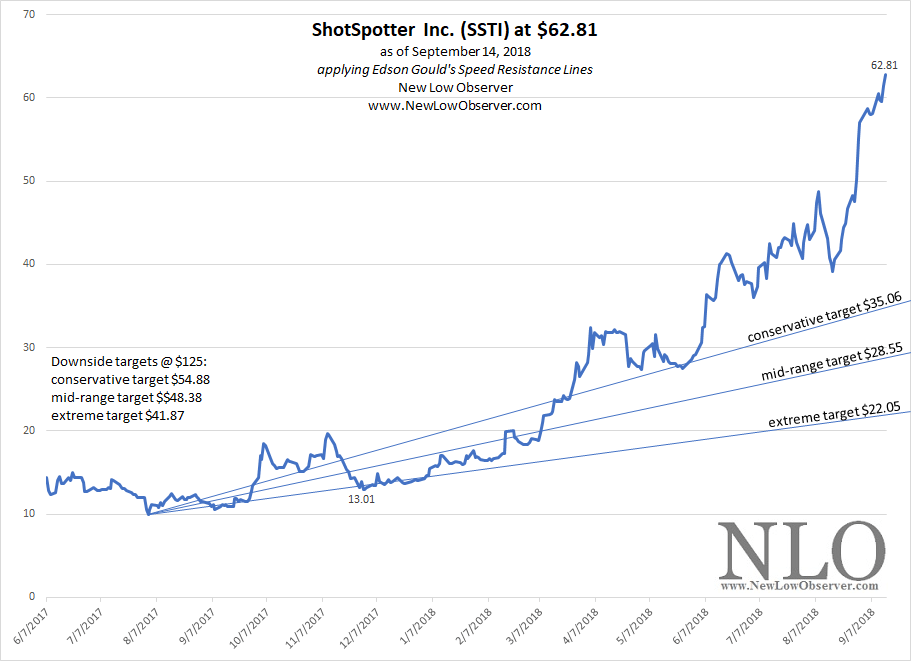
The downside target for SSTI are included in case the stock were to double for the current level. SSTI could increase to $85.65 and still be within range of the $35.06 downside target.
Posted in Edson Gould, parabolic, Speed Resistance Lines, SRL, SSTI
Market Stimulus is Failing, Big Time
On August 25, 2015, we said the following:
“The actions of the Chinese government have not been constructive for a change in the declining trend of the market. The sooner restrictions intended to stop prices from falling are lifted the better the chance for Chinese stocks to fully recover.”
Since the very first clear intervention by the Chinese government on June 27, 2015, with a surprise interest rate cut, the Shanghai Composite Index has declined –40.77%. The total decline from the 5,166.35 peak on June 12, 2015 has been –48.09%.
That very first stimulus action of cutting interest rates and the laundry list of interventions (partial list here) since is now being compounded by company buyback of shares.

Since 2009, stock buybacks have generally increased over time. However, the year 2018 has seen a dramatic increase that has overshadowed all prior years of data as referenced from the September 12, 2018 Financial Sense article titled “Chinese Government Encourages Share Buybacks As Bear Market Deepens” by contributor Danielle Park.
The intervention is actually causing the process of recovery to take longer than it needs to by providing false hope for investors (large and small) that the turnaround is near. We’ve seen this all before in the Japanese Nikkei Index from 1990 to 2009 when it declined –81% (chart here).
Failure in Our Analysis
On September 26, 2016, we said the following of the Shanghai Composite Index:
“A simple flag or pennant formation seems easy to identify. Now it is time to see if the direction of the index will do a retest of the late January 2016 low.”
If viewed from the perspective of the pennant formation starting from late January 2016, our analysis was a failure, as seen in the chart below. Even if we were to extend and enlarge the pennant from the early January 2016 start date to December 15, 2017, the pennant would have been a failure.
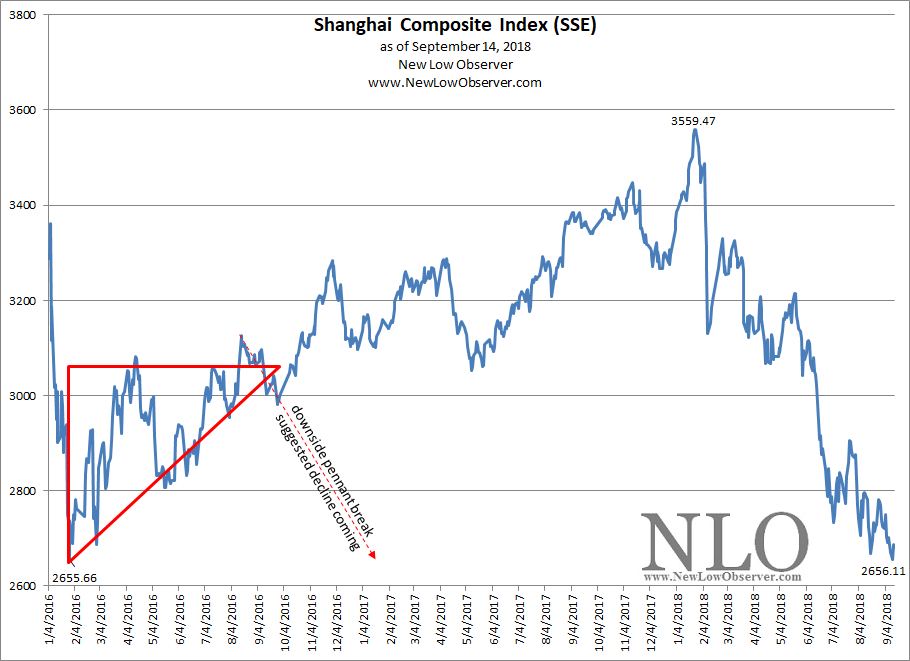
Based on the original analysis, the index was supposed to drop –13% to achieve a retest of the 2,655.66 low. Instead, the index increased +16.50% to 3,559.47 before starting the descent to 2,655.66. The idea of a retest of the prior low is based on Dow Theory and has been proven to be very consistent. However, as analysts, it requires time and patience to see the process through.
Below are the downside targets and the potential upside targets for the Shanghai Composite Index.
Posted in Shanghai Composite Index