Monthly Archives: January 2010

Investment Observation: Gilead Sciences (GILD) at $45.52

In my August 3o, 2009 article titled "Reviewing the Stock Analysts," I pointed out a book that I felt would advance your ability to analyzing individual stocks much better than whatever method that you might be using. In the article that I posted on August 30th, I stated that I'm convinced that if you buy the book Quest For Value you would have made a wise investment.

The only reason that I'm convinced that Quest For Value is useful is due to the third party examination of the performance of the approach as applied by Matrix USA. On a consistent basis, the economic value added (EVA) method was attributable to Matrix USA beating all other stock analysts for buying and selling stocks.

Now, in the most recent issue of Fortune Magazine dated January 18, 2010, Geoff Colvin reiterates that using the economic value added (EVA) approach is resoundingly effective at discerning quality stocks without the ability of corporations to tweak or fudge the financials through generally accepted accounting principles.

The punchline to the Colvin article is that of the three top quality companies based on the EVA model, Gilead Sciences (GILD) is among them. GILD happens to be one of the Nasdaq 100 companies on our most recent watch list. On October 23, 2009, I indicated that based on the Coppock Curve, GILD would be among the best companies to investigate for a potential purchase. I am reiterating the belief that GILD is worthy of investigating since it has not varied by much since my last look at the company. -Touc

related articles:

Predictions Worth Noting

Over the years, analysts and economists attempt to make a yearly prediction of where the market and economy will end up. Some are right and some are wrong. With 2010 underway, a storm of 2010 outlooks are posted on websites and blogs. But some predictions are worth noting and discussing. One particular strategist, Byron Wien, gave ten predictions for 2009 (The Surprise of 2009). Seven out of ten came to fruition. His accuracy can only be tested after the fact but investors loss nothing from acknowledging his current outlook.
Two calls worth noting for 2009 were S&P 500 rising to 1,200 and gold reaching $1,200 an ounce. S&P 500 closed the year at 1,115.10 and gold hit a high of $1,212.50 an ounce. - Art

Illumina (ILMN) Shines a Light on Profitability

Today, Illumina Inc. (ILMN) was up 15.82% after announcing stronger than expected earnings. According to Yahoo!Quotes, ILMN "...engages in the development, manufacture, and marketing of integrated systems for the analysis of genetic variation and biological function." Apparently it was a total shock to investors and analysts alike that ILMN had the capacity to pull through with strong earnings.

ILMN was last on our Nasdaq 100 Watch List on December 19, 2009. Not long after ILMN hit our list did it catapult 43.69% in 26 days. It is hoped that followers of this website pay close attention to the companies that are on our Dividend Achiever and Nasdaq 100 Watch Lists. Each list has provided exceptional long term and short term opportunities when using fundamental and technical analysis combined. -Touc

Speculative Observation: Electronic Arts Inc. (ERTS) at $16.74

In after hours-trading Electronic Arts (ERTS) fell over 8% on news that the company had lower sales, wider annual loss and had to reduce full year guidance. According to Yahoo!Finance, ERTS "...develops, markets, publishes, and distributes video game software and content."

This is the perfect example of a company that was thought to have it all and possibly be recession proof. After all, 13-34 year old males were going to buy and play video games regardless of the economic environment. ERTS' stock price and company earnings, like much of the "conventional" wisdom the exists about the markets, proved to defy much of the logic.

Personally, I don't track earnings estimates since the concept of earnings is more or less an accounting interpretation that conveniently fits a corporate strategy to show profits or losses as needed. The concept of estimates of future expectations tied to the idea of earnings is a kind of mental gymnastics that I don't have the patience for. However, as part of the New Low Observer team, it is my primary responsibility to track Nasdaq 100 companies that have compelling price action at, or near, a new low.

ERTS last appeared on the New Low Observer on December 11, 2009. At the time, ERTS was within 13% of the new low after falling from the lofty levels of $61 in 2007. After being on our Nasdaq 100 Watch List for only a couple of weeks, ERTS rose 15.82% in 26 days.

ERTS hasn't had luck recovering from it's market doldrums. However, for astute market participants with a penchant for speculation, this stock may provide exceptional opportunities. When ERTS hit the ultimate low of $14.24 ( March 9, 2009) it was in the throes of a market meltdown. In this instance (March 2009 low), we could chalk up the stock price performance primarily to the "adverse" conditions of the market. This means that the price action didn't reflect the truly dire conditions of the company specifically.

Now, as we see the stock getting pummeled in after-hours, we can find comfort in knowing that investors have had the opportunity to better gauge the conditions of the company and are about to price in the worst that is yet to come. One matter that is tremendously bothersome to me regarding the situation at ERTS is that the company is trying to bury the bad news with a flood of press releases. This annoys me to no end and indicates that the company has more to hide than reveal in the latest earnings report.

Although ERTS is in free fall mode, I recommend that potential speculators jump on the best information resources at your disposal (Value Line, Morningstar and Mergent's etc.) and verify whether or not this company truly has a viable business model. My suspicion is that ERTS is an opportunity that is waiting to be capitalized upon after considerable assessment of risk tolerance and due diligence has been done. Be mindful of the prospect that this company could test the long term support level of $10. Only put money that you're willing to lose towards this "special" situation. -Touc

Dow Theory

There are three areas that I would like to cover regarding Dow Theory. First I’d like to discuss the Dow Theory confirmation of the trend. Next, I want to cover the concept of a “line” and it’s potential impact on the Dow Industrials. Finally, I’d like to discuss the Dow theory 50% rule. Additionally, I want to describe what I believe are the future projections for the market going forward.

On January 8, 2010, the Dow Industrials and the Dow Transports confirmed the Dow theory cyclical bull market trend of the stock market. The significance of this is that we can expect the Dow Industrials to head much higher in spite of the threat of future economic uncertainties. Below are the recent charts for the Dow Transports and the Dow Industrials.

Since November 9, 2009, the Dow Industrials have traded in a tight range of less than 3%. According to Dow theory, the market trading in a range of about 5% is considered to be a “line.” A line is a key indication of accumulation or distribution of stocks. It is not known whether or not accumulation or distribution has taken place until the market either breaks above the high range or below the low range of the line.

According to Dow Theory, the formation of a line can act as the equivalent of a market decline or secondary reaction in a bull market if it lasts for over eight weeks. In this instance, the line lasted exactly 8 weeks. I’m hesitant to accept that the “rule” of 8 weeks can be trusted altogether. However, the upward bias of the market has indicated that the most recent breakout will be followed until proven otherwise. It is important to note that secondary reactions act as a release valve from built-up pressure in the market. The fact that the market has responded by breaking above the line that had been drawn indicates that the market has successfully absorbed the large amount of shares that have been distributed by corporations as well as the negative economic news since the March 2009 low.

Because the Dow Industrials and the Dow Transports have both broken to brand new highs at the same time, along with the fact that the Dow Industrials have broken above the line that has been drawn since November 9, 2009, we can safely guess that the market has little desire to go lower and that the bull market is still in place.

Below are the charts of the Dow Industrials and Dow Transports retracements from their respective peaks in 2007. The Dow Industrials have retraced more than 50% of the prior peak while the Transports have retraced more than 60% of the prior peak. This suggests a possible move to retest the high of 14,000 and 5,400. According to Charles Dow, if the market can retrace more than half of the prior move, it (the market) will likely go to the old level that was previously established. One way this was demonstrated was during the decline from October 2007 to March 2009. The decline that took place accelerated significantly once the Dow Industrials exceeded 50% of the rise from September 2002 to October 2007. Likewise, we should be on the lookout for a similar accelerated rise in the market on the way to 14,000.

In an October 15, 2009 article, I charted what I believe to be two scenarios where the market would go. In the first scenario, I suggested that the Dow Industrials would continue on an upward trajectory. Basically, I connected the March 9, 2009 low with the low of July 2009 into the future. In the other scenario, I suggested that the Dow would be able to decline back to the July 2009 low and still be considered a bull market. Additionally, using cycle analysis, I suggested that the market would reach its respective lows between the period of December 2009 and late February 2010.

Since writing the article on October 15, 2009, the Dow Industrials have remained above the upward (red) trendline (see chart below.) I continue to believe that the strongest resistance for the market will be when the Dow Industrials get to 10,700. At this juncture, the Dow Industrials will either break out to the upside in dramatic fashion or retrace back to 9,500. However, given the strong indications from the Dow Industrials and Dow Transports on Friday, I suspect that we can reach 12,000 not long after the month of February 2010.

Considering that this is a cyclical bull market, within the context of a secular bear market, I understand that a reaction of 100% (going back to 14,164 on the Dow Industrials) is not unusual. Additionally, valuations of the market are not at historical lows. Investors should seek out quality companies that are at or near a new low that seem to have viable business models. My preference tends to favor Dividend Achievers or companies that have increased their dividend at least 10 years in a row. -Touc

Nasdaq 100 Watch List

Below are the Nasdaq 100 companies that are within 20% of the 52-week low. This list is strictly for the purpose of researching whether or not the companies have viable business models or are about to go out of business. These companies are deemed highly speculative unless otherwise noted. -Touc
Symbol Name Trade P/E EPS Yield P/B Pct from Yr Low
GILD Gilead Sciences 44.54 17.22 2.59 N/A 7.17 9.65%
CEPH Cephalon, Inc. 63.01 17.42 3.62 N/A 2.21 19.90%
GENZ Genzyme Corp 53.81 30.68 1.75 N/A 1.78 14.27%
APOL Apollo Group 60.50 16.13 3.75 N/A 8.55 14.61%

Dividend Achiever Watch List

At the end of the week, my watch list expanded slightly to 18 companies compared to 17 companies from the previous week. Here are the companies on my watch list as of January 8, 2010.

Symbol Name Price P/E % Yr Low Yield EPS Div/Shr Payout Ratio
SVU SUPERVALU INC 12.87 -0.92 6.10% 2.72% -13.99 0.35 -3%
SHEN Shenandoah Telecom 17.24 27.81 7.08% 1.86% 0.62 0.32 52%
THFF First Financial Corporation 8.78 15.73 8.48% 3.13% 1.83 0.90 49%
SRCE 1st Source Corporation 15.06 13.57 8.82% 4.25% 1.11 0.64 58%
CWT CALIFORNIA WATER SVC 36.47 18.24 8.90% 3.24% 2.00 1.18 59%
XOM EXXON MOBIL CP 69.52 16.21 12.38% 2.42% 4.29 1.68 39%
UGI U G I CP 24.01 10.17 13.58% 3.33% 2.36 0.80 34%
WGL WGL HOLDINGS INC 32.48 13.59 13.61% 4.53% 2.39 1.47 62%
WEYS Weyco Group, Inc. 23.04 23.04 14.57% 2.60% 1.00 0.60 60%
WTR AQUA AMERICA INC 17.67 23.25 14.81% 3.28% 0.76 0.58 76%
WMT WAL MART STORES 53.33 15.46 15.31% 2.04% 3.45 1.09 32%
BCR BARD C R INC 80.51 16.13 16.78% 0.84% 4.99 0.68 14%
UMBF UMB Financial Corporation 39.34 18.73 16.91% 1.88% 2.10 0.74 35%
AWR AMER ST WATER 34.83 21.50 17.04% 2.99% 1.62 1.04 64%
NWN NORTHWEST NAT GAS 44.78 15.49 18.75% 3.71% 2.89 1.66 57%
FDO* FAMILY DOLLAR STORES 30.14 14.56 18.94% 1.79% 2.07 0.54 26%
SYBT S.Y. Bancorp, Inc. 21.87 16.20 19.57% 3.11% 1.35 0.68 50%
HSY THE HERSHEY COMPANY 36.38 21.27 20.19% 3.27% 1.71 1.19 70%
18 Companies


*Although Family Dollar (FDO) is on our list, the stock rose 10% on January 6. Due to the shifting of the 52 weeks, the stock is 20% within the low.

Related Articles
Investment Observation: California Water Service (CWT) at $36.82
Investment Observation: Supervalu (SVU) at $12.81
Research Recommendation: Weyco Group (WEYS) at $22.26

Sell Mattson Technology (MTSN) at the Market

In our previous write up on Mattson Technology (MTSN) on October 22nd, we warned readers that this position was not for the faint of heart. As if to prove our point, MTSN promptly fell from the $2.65 level at the time of the recommendation all the way down to the level of $1.94 on November 4, 2009, a decline of nearly 27% in two weeks.

Now, with the stock trading at $3.32 and with a gain of 24% in 77 days, we think that it is time to relieve ourselves of this highly speculative position. With the understanding that any investment that exceeds a return of 13% within one year is exceptional, we feel that MTSN is getting long in the tooth. Additionally, if viewed from a technical standpoint, MTSN has formed a topping out pattern over the last couple of weeks. -Touc

related article:

Investment Observation: Supervalu (SVU) at $12.81

Supervalu (SVU) has been on our watch list since December 2009. After considerable analysis, I decided to pull the trigger today at $12.81, less than 5% within the 52-week low. My model showed the price of $12 to be the buy range and $15 to be the fair value. The negative earnings on the surface is a concern. However, a deeper investigation shows that the company was forced to take an impairment charge of $3,250 back in January of 2009 because of the Statement of Financial Accounting Standards (SFAS) No. 142 accounting rule. This resulted in a negative earning of $13.95 per share. The quote below was taken from the SEC filing.

For the third quarter of fiscal 2009 the Company’s stock price had a significant and sustained decline and book value per share substantially exceeded the stock price. Consistent with SFAS No. 142, the Company performed an interim impairment test of goodwill and indefinite-lived intangible assets at the end of the third quarter of fiscal 2009. Although this analysis has not been completed due to its complexity, based on the work performed to date the Company has recorded a preliminary estimate of impairment charges of $3,250, comprised of $3,000 of goodwill and $250 of indefinite-lived intangibles.

I recalled that SVU was trading at a 70% discount to book during the March low. After an adjustment, it has a book value of $12.79. I purchased the shares at book value.
Despite the consideration of these adjustments, not all is bright for SVU. The company's operating margin is 3.09%, very low compared to its competitors. A large amount of long-term debt ($8 billion) is a dark cloud that hangs over the company. Large capital expenditure will deplete their cash flow if the economy doesn't pick up. After 35 years of consecutive dividend increases, the company reduced their distribution by 50% and now pays out $0.35 or 2.8% annually. All of these factors contributed to SVU trading at such discounted level.

Forward P/E is at 6.64 times. The price-to-sales ratio is at a low of 0.06. Price-to-book value is at 1. Current dividend yield of 2.8% which exceeds the five year average yield of 2.5%. The current ratio of 1 means that the company can turn over their current assets at the same rate as their current liabilities. This is important for short-term viability concerns.

Fundamental aside, it was the technicals of SVU that prompted me to buy. From the chart below, you can see that for most of 2009 the stock trade within the $17 and $12 range. As business conditions improved and the company returned to profitability in the second half of the year, shares remained unchanged. The stock appears to be "bottoming" as it remains range bound. The moving averages are doing the same as well. A break below $12 would spell trouble and I would get out while a breakout above $17 will signal better times for SVU.
I bought the stock at $12.81 and will sell if it break below $12 (-7%). Profit will be taken around $15 (+17%).
The purpose of our investment observations is to point out quality Dividend Achievers and formers that are near a 52-week low. From this point begins the fundamental research to verify the quality of the stock for both short and long-term investing. These recommendations are within the context of the 3rd year of an 18-year secular bear market. A bear market that we expect could trade in a range between 16,000 and 5,000. The secular bear market will be considered over when the Dow Transports and Dow Industrials exceed their respective peaks on high volume or the dividend yield on the Dow exceeds 6% or higher. -Art

Real Estate Bottom is Calling

The great real estate analyst Roy Wenzlick may have called the bottom in real estate again...for the 10th time in a row for the last 78 years. Although he passed away in 1989, Roy Wenzlick gave significant credibility to the idea that real estate has an 18.3 year cycle. Wenzlick compiled data on real estate in St. Louis as well as the rest of the nation from 1932 until 1973 in his publication The Real Estate Analyst.In the diagram below, you will see Wenzlick's 18.3 year cycle displayed from 1795 until 1973.
 
It is important to note that if you add 18 years to 1973 you get the year 1991 as the next period for a low in the real estate market. Coincidentally, to some, 1991 was the last time we had a bottom in the real estate market. If you add another 18 years to 1991 then you get 2009. My tendency has been to include the years 2008 and 2010 just to play it safe.
 
As a way to cross reference our perspective that the bottom is coming, I have included the Federal Reserve's data on real estate loans with the percentage change from the previous year. Although real estate loans by banks is a slightly lagging indicator it has tracked the performance of the real estate market in sync with the Wenzlick model.
 
If we haven't hit bottom yet it means that within the year 2010 we will have to go below the previous low prices of 2009. Such an occurrence would be a complete disaster for the financial markets. I am hopeful that the real estate market doesn't further devolve. However, the concern does rest in the back of my mind.
 
Barring any further crisis in real estate, I'm willing to go out on a limb and say that on the whole, as opposed to specific geographic regions, based on credible sources like Wenzlick, the bottom in real estate may be in.
 

Resources:

Relying On Analyst? Better Think Again

If you think an analyst can help guide you through investing, think again. Today's headline reads, "Bartels Drops ‘Correction’ Call, Sees Gains: Technical Analysis" Mary Ann Bartels, an analyst at Bank of America, predicted back in October 5th that the market would plunge 20%. Bartels was ranked second among analyst by Institutional Investor magazine’s most recent survey. The worse part about this is that being wrong, as an analyst, suffer no consequence. Bartels is now near-term bullish and saying that more gains are likely in the near term.
I wrote several articles about the market in October of 2009. The first one was on the 9th which showed a non-confirmation based on the Dow Theory. I suggested investors to stay long but flat and watch the Transport closely. On the 14th, the uptrend confirmation came and I said "The bull market confirmation came today when the Industrial and the Transport both closed above their previous high. I'll remain long until the market tells me to get out."
Art

Speculative Observation: Cephalon Inc. (CEPH) at $62.42

The new year brings new challenges and opportunities. The first opportunity for this year may come from Cephalon (CEPH) which engages in the discovery, development, and commercialization of products for central nervous system, inflammatory disease, pain, and oncology therapeutic areas. It competes against GlaxoSmithKline plc (GSK), Johnson & Johnson (JNJ), and Sepracor Inc. Because the company doesn't pay a dividend, the New Low Observer team has to classify such a security as a speculation.

CEPH came onto our radar when we began compiling the new low data back in July when the stock was trading around $57. This was 8% above the 52 week low of $52.55. At the low, CEPH was trading at less than 15 times earnings. Although appearing to be risky, selected stocks at or near their low offer investors the opportunity to investigate quality companies for potential price increases. Our concept is laid out in the "Buy Low, Sell High" article.

CEPH has a market cap of $4.6 billion dollar. The relatively small size compared to its rivals doesn't discourage us. We only care about the market cap as a means for liquidity when buying and selling the stock. CEPH earned $3.62 per share over the last 12 months and thus has a price to earnings ratio (P/E) of 17 and a forward P/E of 10, an extraordinarily low multiple. Low P/E multiples imply that investors are paying less for every dollar of earnings (more on our view of P/E). CEPH has a book value of $28.71 per share. At $62, price-to-book is north of 2. A positive operating cash flow of $232.48M is a plus but a negative free cash flow is one of my concern ($-12.71M).

Fundamentals aside, the stock may have discounted all the negative news based on the chart pattern. In 2009, Cephalon dropped 19% as opposed to the Dow Industrials which rose 19%. Unlike the Dow which hit the yearly low in March, Cephalon bottomed in July and formed what appears to be a base. This pattern is prominent because it shows that the stock failed to move either up or down and traded in range between $60 and $53. Any break above $60 or below $53 will reveal its potential direction of the stock. Sure enough, the stock broke above $60 in late December and will look for that to be a support for the stock. The momentum indication also turned bullish as the 50-day moving average crossed the upward sloping 150-day moving average as indicated in the chart below.

Another indicator I like to refer to is the Coppock Curve (click here for more on the Coppock Curve). For Cephalon, the curve dates back to 1993. The table below shows my findings.

Date Price 3 Mo After % Change
May-95 9.81 24.25 147%
Feb-98 12.00 10.63 -11%
Sep-98 7.31 9.00 23%
Mar-99 8.75 17.38 99%
May-03 45.16 44.35 -2%
Sep-05 46.42 64.74 39%
Aug-08 76.62 73.48 -4%

The average percentage gain if you sell three months after the buy indication is 42%. Excluding the 1995 data, it is 24%. We are waiting for the indicator to turn for a possible buy signal.

A buy strategy would be to purchase this stock as close as possible to $60 or the 50 day moving average which is dynamic and constantly changing. Use the Coppock indicator as another gauge to buy and watch your gains or losses closely. - Art

Investment Observation: California Water Service (CWT) at $36.82

The latest investment observation is on California Water Service Group (CWT). According to Yahoo!Finance, CWT "...engages in the production, purchase, storage, treatment, testing, distribution, and sale of water for domestic, industrial, public, and irrigation uses, as well as for fire protection."

As noted in our Dividend Achiever watch list dated January 1st, CWT is within 10% of the 52-week low. CWT has increased its dividend for 41 years in a row. The 10-year compounded growth rate of the dividend is an anemic level of less than 2%. Keep in mind that with a 41 year history of increased dividends, the odds favor the dividend remaining the same or being cut in the near future. A cut in the dividend would initiate the selling of the stock automatically, regardless of other fundamental attributes.

CWT has had a pattern of trading in a range for approximately 6 years at a time before breaking out to a new and higher trading level. The following are the range in years that CWT traded before obtaining a new high:

  • 1976 to 1982
  • 1985 to 1993
  • 1993 to 1997
  • 1997 to 2004
  • 2005 to 2011 ???
Because CWT has averaged 6 years before breaking out to a new higher price, we suspect that the current period, after trading in a range for the last 5 years, might provide relatively sizable capital appreciation over the next two and a half years. In addition, because the stock price has been range bound while the dividend has been increased each year, investors can feel comfortable knowing that either of two things are going to happen with the stock 1) the price increases or 2) the dividend yield increases. Either of these scenarios are likely if CWT can retain its overall financial standing.

According to Dow Theory, CWT has the following upside and downside targets.

Upside:

  • $48.29
  • $41.42 (fair value)

Downside:

  • $34.55
  • $27.40
  • $21.04

While we am hopeful of the upside prospects, potential investors need to consider their willingness to hold this stock through the possible downside targets. Personally, we would consider selling the stock if it fell below the $27.40 level. This means that we would be accepting the potential loss of 26% before deciding if we should continue to hold the stock. However, a lot depends on market conditions at the time that CWT falls to the respective downside targets. Our goal is to obtain CWT at a lower price than the current level and sell the stock at or near the $48 level.

To put our investment observation in perspective, IQTrends.com considers CWT undervalued when the stock trades for $16.85. According to Value Line Investment Survey, CWT trades at a mean price of:

  • $33.61 based on the 30-year treasury
  • $33.98 based on the 20-year treasury
  • $40.42 based on the 10-year treasury

Being as conservative as possible, both sources indicate that CWT is overvalued or fairly priced by as much as 54% and as little as 8.71%. In theory, a stock that is "fairly" priced has more of a chance of falling in value rather than increasing in value. Also of concern is the possibility of rising interest rates. It would be challenging to expect that the price of a utility can increase in a potentially rising interest rate environment that we might face in the long term.

As mentioned in our recommendation of AquaAmerica (WTR), although CWT is a water utility and water is critical to life, investors need to understand that companies in this industry aren't a "sure thing." The biggest reason for this is that when, and if, water becomes scarce, government regulators will step in to take over (nationalize) what should otherwise be sold at the most profitable price (thereby curbing wasteful consumption.) There is literally an upside cap on profitability to a company like this due to the critical importance of the resource being sold. Additionally, CWT should be considered a relatively risky stock because of its low daily trading volume. With a 3 month average volume of 100,000 shares, this stock may not be suitable for investors who need ready access to the cash on short notice.

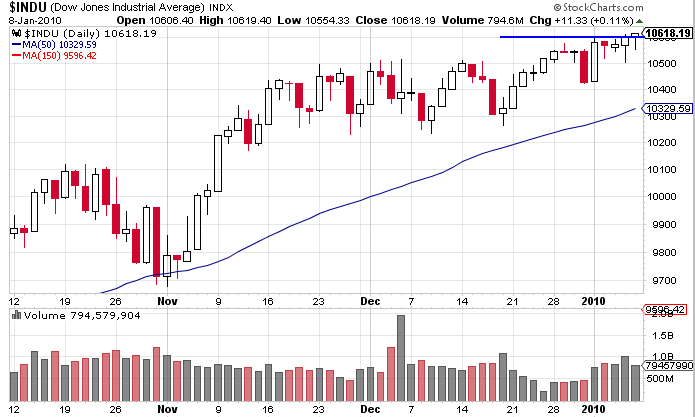
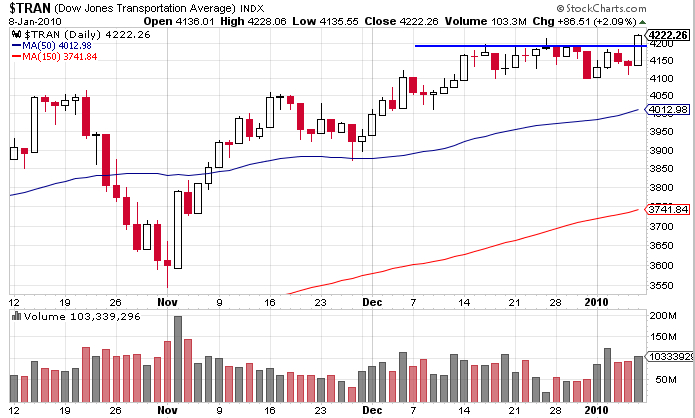
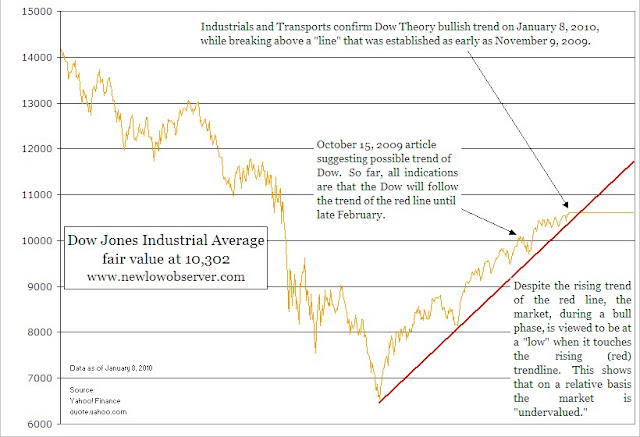
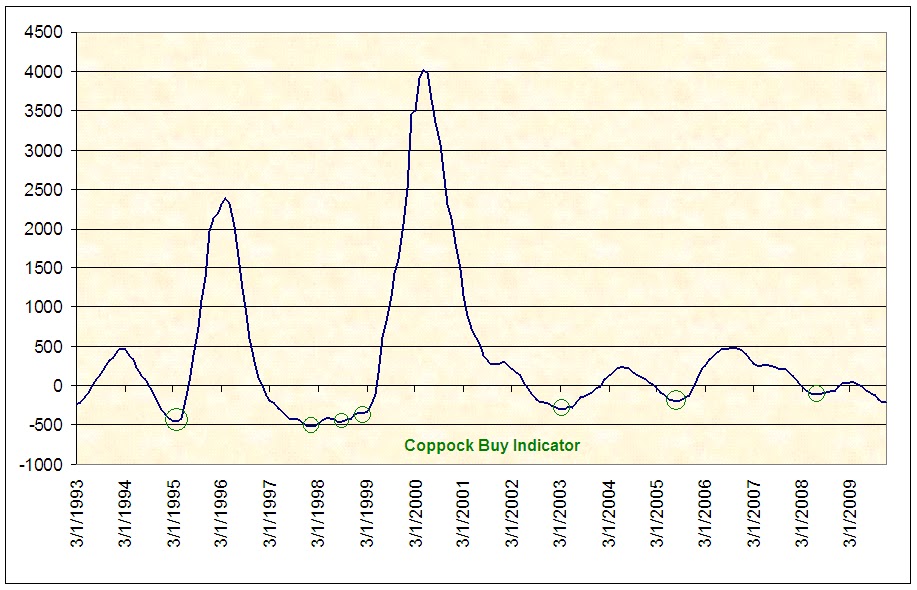
The purpose of our investment observations is to point out quality Dividend Achievers that are near a 52-week low. From this point begins the fundamental research to verify the quality of the stock for both short and long-term investing. These recommendations are within the context of the 3rd year of an 18-year secular bear market. A bear market that we expect could trade in a range between 16,000 and 5,000. The secular bear market will be considered over when the Dow Transports and Dow Industrials exceed their respective peaks on high volume or the dividend yield on the Dow exceeds 6% or higher. -Touc
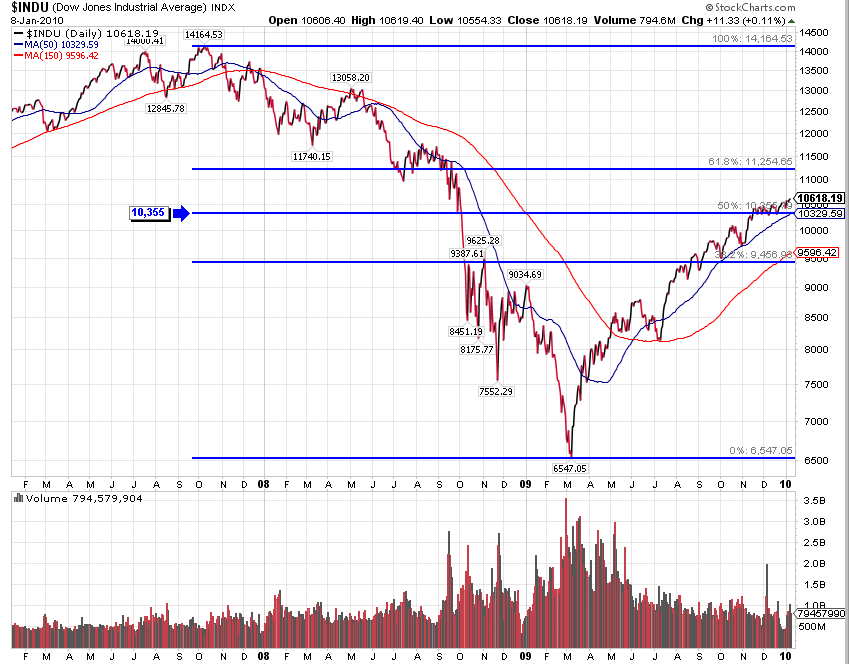
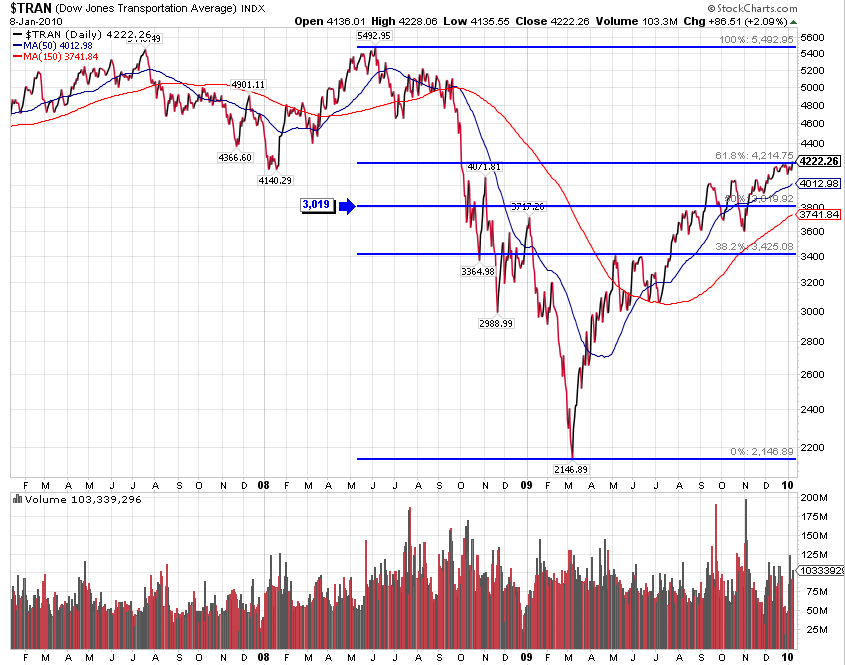
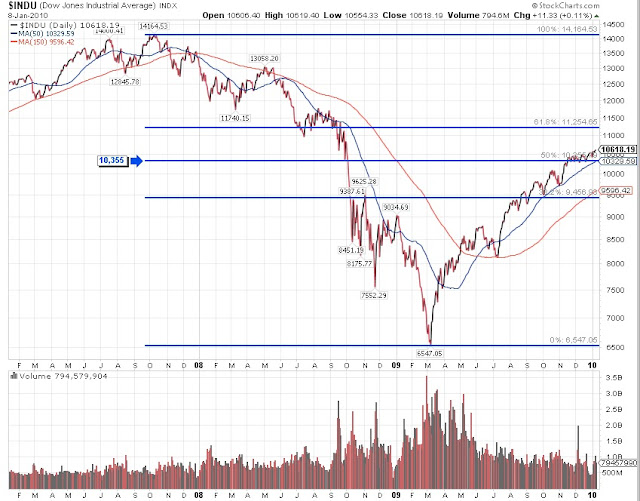
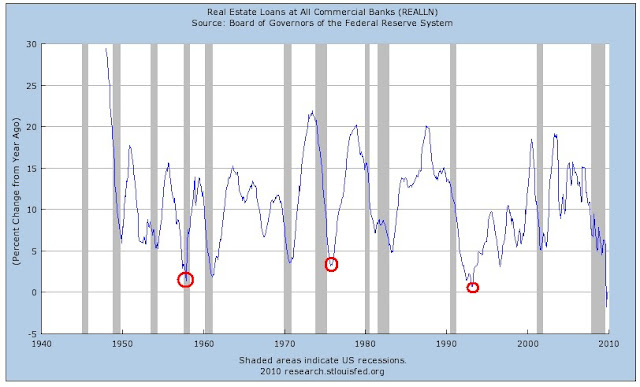
Dividend Achiever Watch List

At the end of the week, my watch list contains 17 companies, same amount of companies from the previous week. Here are the companies on my watch list as of January 1, 2010.

Symbol Name Price P/E % Yr Low Yield EPS Div/Shr Payout Ratio
SVU SUPERVALU INC 12.71 -0.91 4.78% 2.75% -13.99 0.35 -3%
CWT CALIFORNIA WATER SVC 36.82 18.41 9.94% 3.20% 2.00 1.18 59%
XOM EXXON MOBIL CP 68.19 15.90 10.23% 2.46% 4.29 1.68 39%
BCR BARD C R INC 77.90 15.61 13.00% 0.87% 4.99 0.68 14%
WTR AQUA AMERICA INC 17.51 23.04 13.78% 3.31% 0.76 0.58 76%
UGI U G I CP 24.19 10.25 14.43% 3.31% 2.36 0.80 34%
THFF First Financial Corporation Ind 30.52 16.68 15.04% 2.95% 1.83 0.90 49%
WMT WAL MART STORES 53.45 15.49 15.57% 2.04% 3.45 1.09 32%
FDO FAMILY DOLLAR STORES 27.83 13.44 15.86% 1.94% 2.07 0.54 26%
SRCE 1st Source Corporation 16.09 14.50 16.26% 3.98% 1.11 0.64 58%
SYBT S.Y. Bancorp, Inc. 21.35 15.81 16.73% 3.19% 1.35 0.68 50%
UMBF UMB Financial Corporation 39.35 18.74 16.94% 1.88% 2.10 0.74 35%
WGL WGL HOLDINGS INC 33.54 14.03 17.31% 4.38% 2.39 1.47 62%
WEYS Weyco Group, Inc. 23.64 23.64 17.55% 2.54% 1.00 0.60 60%
HSY THE HERSHEY COMPANY 35.79 20.93 18.24% 3.32% 1.71 1.19 70%
AWR AMER ST WATER 35.41 21.86 18.99% 2.94% 1.62 1.04 64%
NTRS Northern Trust Corporation 52.40 13.83 20.96% 2.14% 3.79 1.12 30%
17 Companies

Happy New Year
Art