Below are the valuation targets for Agilent Technologies (A) for the next 10 years. Continue reading
- Japan
- Market Indicator
- Price Momentum Indicators
- Richard Russell
- Silver
- Speed Resistance Lines
- U.S. Dividend Watch List

Below are the valuation targets for Agilent Technologies (A) for the next 10 years. Continue reading
Below are the valuation targets for Barnes Group (B) for the next 10 years. Continue reading
Below is a chart of the Netflix (NFLX) from 2010 to 2022, reflecting Price Momentum data. Continue reading
Below are the downside targets for Bitcoin based on the work of Edson Gould. Continue reading
Below are the valuation targets for Richelieu Hardware Ltd. (RCH.TO) for the next 10 years. Continue reading
The work of Edson Gould is useful primarily because we have the benefit of hindsight to confirm or reject the claims that have been made. Of the most commonly used methods of Gould’s work has been the Speed Resistance Lines and Altimeter. Both have worked exceptionally well when applied correctly.
Of course, there have been times when we have applied these tools either at the wrong time or the wrong stock or index. Surprisingly, as our work has shown, there have been few instances of this. It has more to do with Gould’s work than anything that we’ve been able to add to the topic.
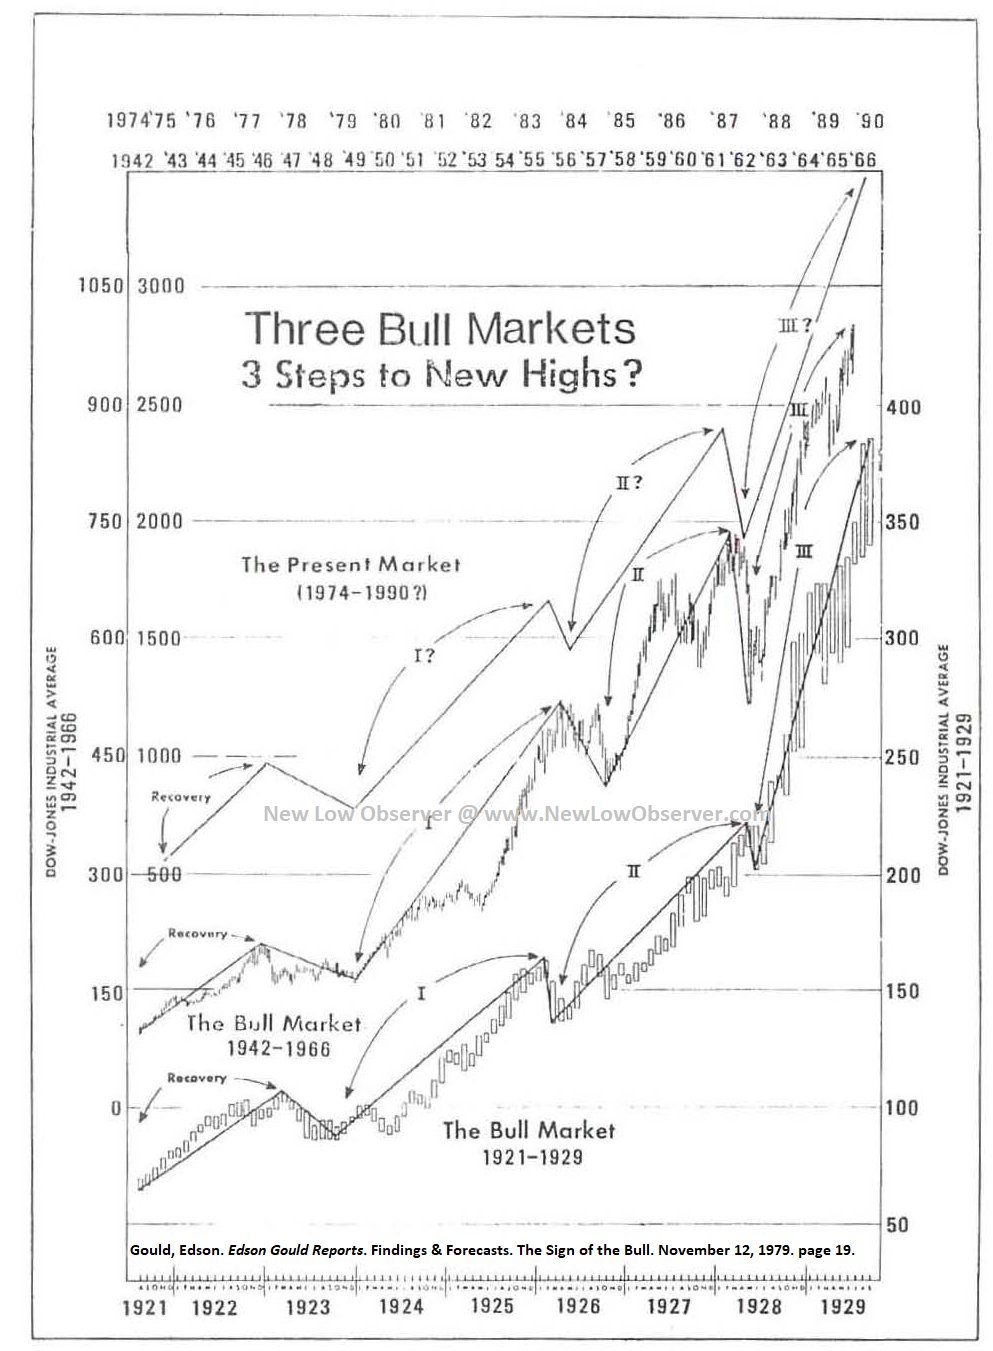
This brings us to the topic of an approach that Gould has dubbed “Price Relationships” and “Time Relationships” method. Gould outlines a mathematical formula on how to arrive at a projected PRICE and TIME of the top “bull move” in a market. We have not attempted to utilize the TIME approach because it generally seems too exaggerated to make such a claim with a straight face.
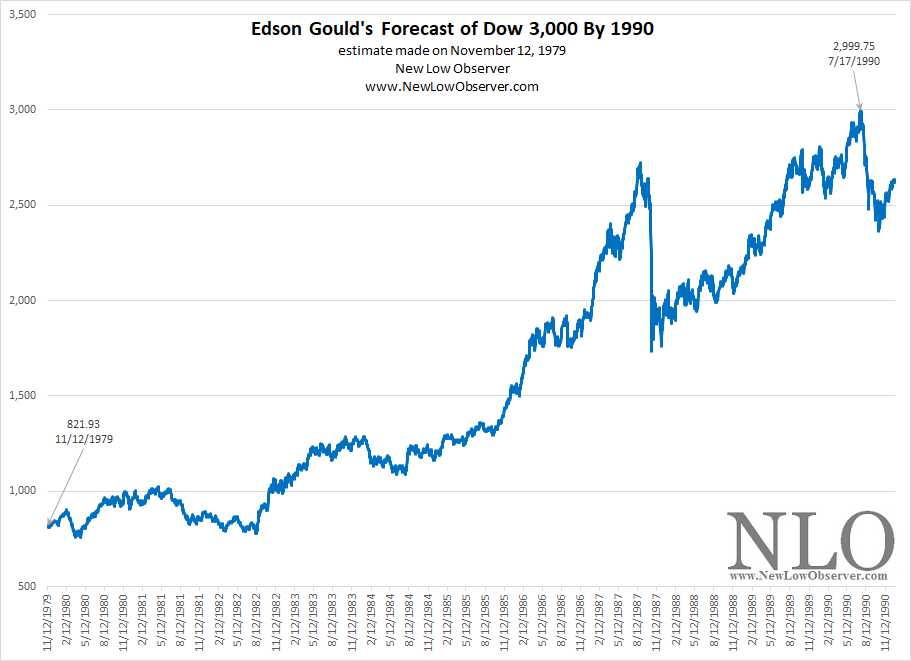
Below we have included a chart from Gould’s November 12, 1979 projection for the Dow Jones Industrial Average. Based on Gould’s work, it was estimated that the Dow Jones Industrial Average would climb to 3,000 by 1990.
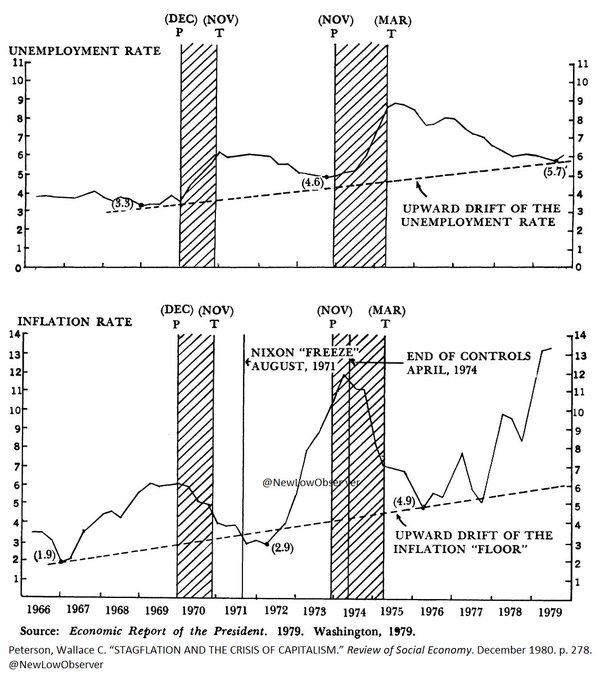
The magnitude of this claim needs to be put in the proper context. In the period from 1966 to 1979, the U.S. economy had mired through a period of stagnation.
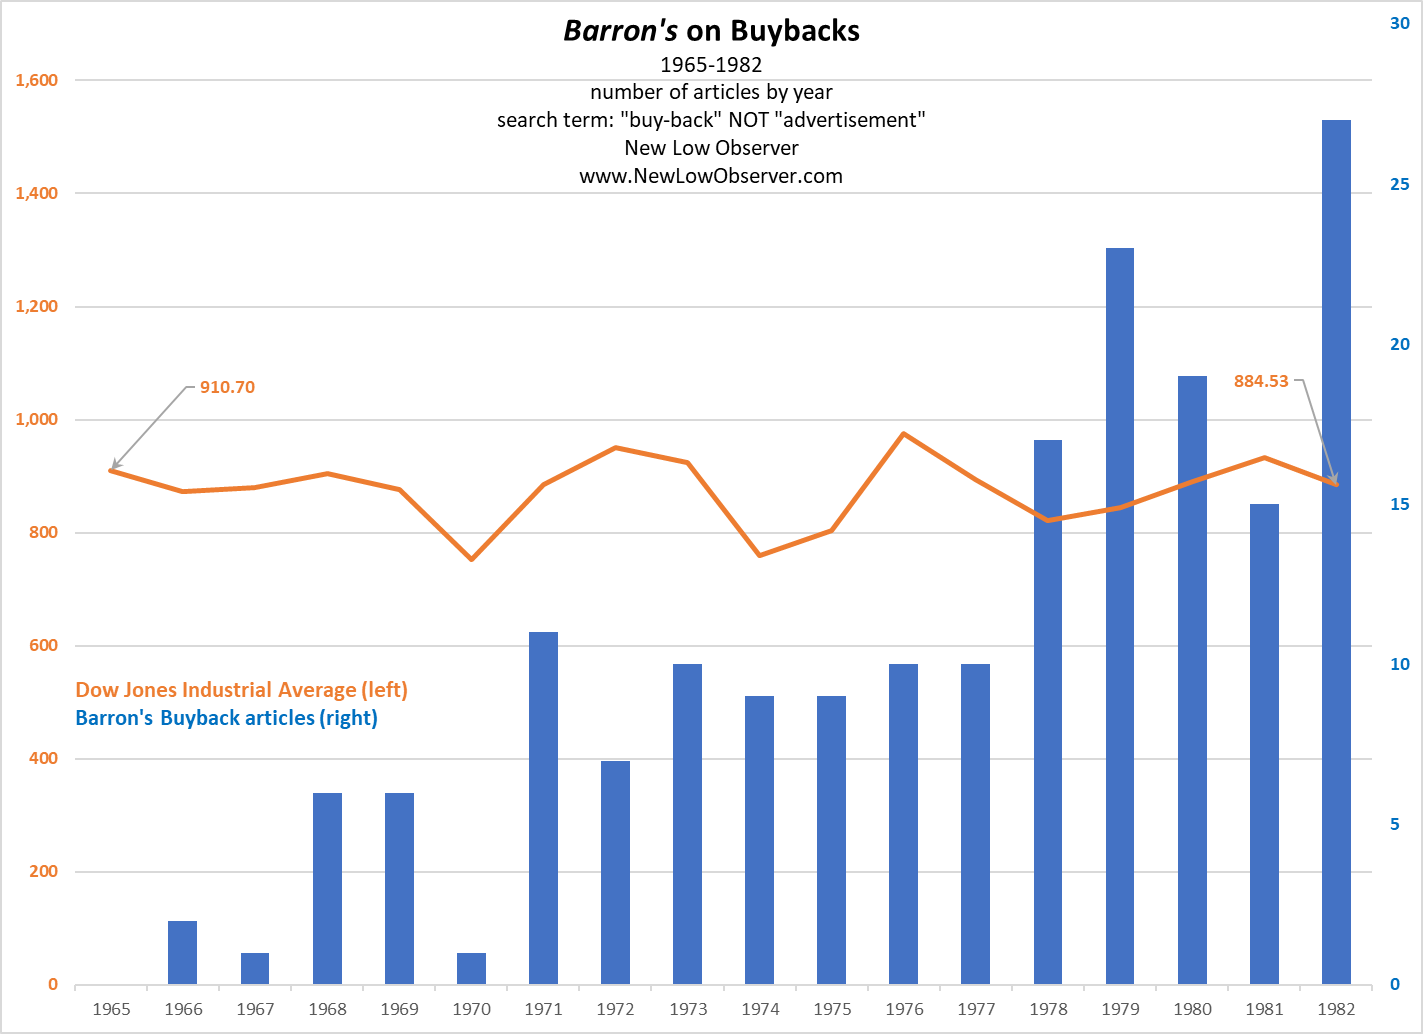
The stock market was rangebound on a nominal basis and in real terms, experiencing the equivalent of a crash, in spite of the increasing number of buybacks by corporations.
Sentiment in the economy and the stock market wasn’t all that great as rising interest rates were at the forefront of every discussion. Within this context, Gould proposed that the Dow Jones Industrial Average would somehow increase at least three times the current level by 1990.
The record, based on the work of Gould, speaks for itself.
This brings us to the question of how did Gould achieve this assessment. For now, we will present, for the first time, the number generated for the future price of Bitcoin based on Gould’s “Price Relationships” while avoiding the topic of Gould’s “Time Relationships.” We’re hesitant to roll out a time estimate until we have worked out some of the kinks.
In the coming days, we will issue a price projection for Bitcoin based on the work of Edson Gould that we have not used in the past. Before we submit this future price projection, we need to offer a brief review of our prior work on Bitcoin using the work of Edson Gould and Charles H. Dow.
Below are the highlights of our work on the topic of Bitcoin and the price of Bitcoin at the time the commentary was made:


We have never believed in Bitcoin. What we have done is track the price. Based on the work of Charles H. Dow, price informs us enough to not have faith in Bitcoin or any other assets/commodity but on the collective knowledge of the most informed participants, large and small. Dow and F.A. Hayek’s views are summarized in the following quotes:
On February 25, 1902, Dow said:
"The one sure thing in speculation is that values determine prices in the long run. Manipulation is effective temporarily, but the investor establishes price in the end. The object of all speculation is to foresee coming changes in values. Whoever knows that the value of a stock has run ahead of price and is likely to be sustained can buy that stock with confidence that as its value is recognized by investors, the price will rise (Dow, Charles H. Review and Outlook. Wall Street Journal. February 25, 1902.)."
This aligns with F.A. Hayek’s 1945 claim that:
“…the shipper who earns his living from using otherwise empty or half-filled journeys of tramp-steamers, or the estate agent whose whole knowledge is almost exclusively one of temporary opportunities, or the arbitrageur who gains from local differences of commodity prices, are all performing eminently useful functions based on special knowledge of circumstances of the fleeting moment not known to others.”
Our price projection for Bitcoin will be available to subscribers only.
Notes:
Posted in Bitcoin
Market lost traction this week and fell 1.6%. Nasdaq took a beating after 5% drop. As a result of this, more companies are trading closer to their yearly low than ever. Below is a list of companies on our watch list. Continue reading
Posted in Dividend Achiever Watch List, Dividend Achievers, Dividend Watch List
Tagged members
Below is a chart of the Masco Corp. (MAS) from 1982 to 2022, reflecting Price Momentum data.
Below is a chart of the Sempra Energy (SRE) from 2000 to 2022, reflecting Price Momentum data.
Below are the valuation targets for Stanley Black & Decker Inc. (SWK) for the next 10 years. Continue reading
Below are the valuation targets for Whirlpool Corp. (WHR) for the next 10 years. Continue reading
Market rebounded this week rising nearly 2%. That being said, there are a lot of companies to choose from. Of 86 companies on our list, 49 of them are current Dividend Achiever (green) and 12 or Dividend Aristocrats (blue). Below is the watch list for this week. Continue reading
Posted in Dividend Achiever Watch List, Dividend Watch List, NLO Dividend Watch List
Tagged members
Below are the valuation targets for Waste Connections Inc. (WCN.TO) for the next 10 years. Continue reading