Walgreen Co. (WAG): Sell at the Market

It is now time to recommend that Walgreen Co. (WAG) be sold at the market. The stock has severely underperformed since the research recommendation was issued on September 24, 2008. It is highly recommended that anyone who bought the stock based on my research should re-read the posting. It is hoped that the stock was researched and purchased well below the initiation price.

WAG has been on a steady rise since hitting a technical double bottom on March 9th 2009. At the current rate, WAG could easily breach the $39 level in the next few weeks. WAG is up an astounding 59% from the low in March. In the pursuit of "seeking fair profits" the returns that this stock has provided within the last 338 days say that it is necessary to consider alternative opportunities.

WAG was recommended when it was trading at $31. As of August 27, 2009, WAG was quoted at $33.83. This equals a compounded return of 11.03% in 11 months. Conservatively, this would equal approximately 11.91% return. Selling this stock now also generates a return of 6.23x greater than the amount of the dividend yield if the stock was held for that extra month.

As I have indicated in the purposes and function of this site, the goal is to:

  • maximize the annual yield of each trade.
  • reduce time between buying and selling of each stock.
  • exceed the annual yield of government guaranteed alternatives in each trade.


Sell recommendations are intended to deal with the short term reality of the market. The tracking of the Sell recommendations are the worst case scenario if you happen to have bought a stock at the time the research recommendation was made (please avoid making this mistake.) I aim for mediocrity in my returns, therefore I am happy with 9-12% annual gains. However, since codifying my approach to investing in 2005, I have had annual returns of 14% and above every year since.

It is always recommended that when selling a stock, one should not place stop orders, limit orders or orders after hours. This leaves the seller in the position of being vulnerable to the whims of the market makers. Instead, place your sell orders only as a market order during market hours. Some would complain that a market order during market hours might leave some profits on the table. However, I would rather leave some money on the table rather than have it taken away from me by the trades that are placed by institutions and market makers. Touc.


Please revisit Dividend Inc. for editing and revisions to this post.

A Well Reasoned Response

Today's posting is a rebuttal to my article on August 25th about Warren Buffett's seemingly conflicting stance on stocks and investing. I feel that this response is so important that everyone could learn from it. I will add my response in the comment section if you are interested.

By RandFan

"To be sure, investors are right to be wary of highly leveraged entities or businesses in weak competitive positions." -- Warren Buffett, from "Buy American, I Am."

Buffett's message has never changed over the years...but market conditions have....

"Even if you agree that the 12 percent equity coupon is more or less immutable, you still may hope to do well with it in the years ahead. It's conceivable that you will. After all, a lot of investors did well with it for a long time. But your future results will be governed by three variable's: the relationship between book value and market value, the tax rate, and the inflation rate." Warren Buffett, from "How Inflation Swindles the Equity Investor"

The author of "Will the Real Mr. Buffett Please Stand Up" is either a very sloppy student or a Sophist trying to stir up controversy. To make this argument, you have to make two fatal assumptions: 1) For the equity investor, 1977 is functionally equivalent to 2008 and, 2)An "equity investor" is functionally equivalent to a "value investor." Regarding the first fatal assumption: Market value to book value for many excellent companies was much lower in late 2008 than it was in 1977, so the "investor's equation" produced a different signal. Tax rates were also much higher in 1977 (and may not reach that level again for some time because of today's political climate--a point Buffett made recently in a NYTimes OP-ED piece)which effects return on book value and, thus, the results of the investor's equation.

Throughout his career, Buffett has allowed his disciples an audience to his life-long process of learning. He carries on "out loud" mental discussions with himself as he incorporates new, conflicting data into his world view and through a process of creative destruction strengthens his understanding. His 1977 article is, I think, simply an academic exercise for him. He just so happens to be letting the world in on it. He's going about the process of reconciling information which contradicted truisms that he had learned earlier in life from sources such as John Burr Williams' "The Theory of Investment Value," a book which I highly recommend to anyone who is interested in understanding what Buffett means by "the investor's equation." At any rate, long story short, this is just another pseudo-controversy about Buffett that boosts web-hits and proves that age-old frailty of man: Envy.

Please revisit Dividend Inc. for editing and revisions to this post.

Sell Bard Corp. (BCR) at the Market

It is now time to recommend that Bard Corp (BCR) be sold at the market. The stock has performed moderately since the research recommendation was issued on April 23, 2009. It is highly recommended that anyone who bought the stock based on my research should re-read the posting. It is hoped that the stock was researched and purchased well below the initiation price.

BCR has formed a powerful accumulation base which could indicate that the stock is headed much higher. BCR is among many of the medical device manufacturers that are being underpriced due to the debate about healthcare reform. In the pursuit of "seeking fair profits" the returns that this stock has provided within the last 126 days say that it is necessary to consider alternative opportunities.

BCR was recommended when it was trading at $71.28. As of August 26, 2009, BCR was quoted at $78.31. This equals a compounded return of 10.11% in a little over 4 months. Conservatively, this would equal approximately 29% return. Selling this stock now also generates a return of 10.64x greater than the amount of the dividend yield if the stock was held for a whole year.

As I have indicated in the purposes and function of this site, the goal is to:

  • maximize the annual yield of each trade.
  • reduce time between buying and selling of each stock.
  • exceed the annual yield of government guaranteed alternatives in each trade.

Research recommendations are intended to be a starting point for investigating a quality company at a reasonable price. It is hoped that after doing the background research you can buy the stock at a lower price. Ideally the stock should be held in a tax deferred account and should not consist of less than 20% of your holdings. Personally, I prefer holding only 2-3 stocks at a time.

Sell recommendations are intended to deal with the short term reality of the market. The tracking of the Sell recommendations are the worst case scenario if you happen to have bought a stock at the time the research recommendation was made (please avoid making this mistake.) I aim for mediocrity in my returns, therefore I am happy with 9-12% annual gains. However, since codifying my approach to investing in 2005, I have had annual returns of 14% and above every year since.

It is always recommended that when selling a stock, one should not place an order after hours or when the market is closed. This leaves the seller in the position of being vulnerable to the whims of the market makers. Instead, place your sell orders only as a market order during market hours. Some would complain that a market order during market hours might leave some profits on the table. However, I would rather leave some money on the table rather than have it taken away from me by the trades that are placed by institutions and market makers. Touc.


Please revisit Dividend Inc. for editing and revisions to this post.

Sell Sysco (SYY) at the Market

It is now time to recommend that Sysco (SYY) be sold at the market. The stock has underperformed since the research recommendation was issued on December 17, 2008. It is highly recommended that anyone who bought the stock based on my research should re-read the posting. It is hoped that the stock was researched and purchased well below the initiation price.

SYY has formed an upside down head and shoulders pattern which could indicate that the stock is headed much higher. SYY is the ultimate hedge against inflation and it may go as high as my first target price of $27.58. In the pursuit of "seeking fair profits" the returns that this stock has provided within the last 253 days say that it is necessary to consider alternative opportunities.

SYY was recommended when it was trading at $23.60. As of August 26, 2009, SYY was quoted at $25.34. This equals a compounded return of 10.85% in a little over 8 months. Conservatively, on an annualized basis this would equal approximately 15.65% return. Selling this stock now also generates a return 2.59x greater than the amount of the dividend yield if the stock was held for a whole year.

As I have indicated in the purposes and function of this site, the goal is to:

  • maximize the annual yield of each trade.
  • reduce time between buying and selling of each stock.
  • exceed the annual yield of government guaranteed alternatives in each trade.

Research recommendations are intended to be a starting point for investigating a quality company at a reasonable price. It is hoped that after doing the background research you can buy the stock at a lower price. Ideally the stock should be held in a tax deferred account and should not consist of less than 20% of your holdings. Personally, I prefer holding only 2-3 stocks at a time.

Sell recommendations are intended to deal with the short term reality of the market. The tracking of the Sell recommendations are the worst case scenario if you happen to have bought a stock at the time the research recommendation was made (please avoid making this mistake.) I aim for mediocrity in my returns, therefore I am happy with 9-12% annual gains. However, since codifying my approach to investing in 2005, I have had annual returns of 14% and above every year since.

It is always recommended that when selling a stock, one should not place an order after hours or when the market is closed. This leaves the seller in the position of being vulnerable to the whims of the market makers. Instead, place your sell orders only as a market order during market hours. Some would complain that a market order during market hours might leave some profits on the table. However, I would rather leave some money on the table rather than have it taken away from me by the trades that are placed by institutions and market makers. Touc.


Please revisit Dividend Inc. for editing and revisions to this post.

Dow Theory

The great Dow Theorist Richard Russell (www.dowtheoryletters.com) has indicated that based on today's market action we are now (again) in a bull market. This is after Mr. Russell had taken away his bullish stance from August 14, 2009 to August 24, 2009. While I respect Mr. Russell's over 50 year contribution to Dow Theory, the longest recorded history of Dow Theory from a single person, I have to disagree with the notion that we can say with confidence that the bullish indication needed to be taken out on the 14th and that we've achieved a confirmation of the trend today.

Regarding the matter of August 13th and 14th, on August 13th the Industrials and Transports both hit a new high (on a closing basis) from the March 9th low. On August 14th both indices fell in unison, achieving a temporary low on August 17th. However, what makes for a reversal of a bullish pattern according to Dow Theory is that both indices take out the point at which both indices initiated the bullish move to begin with. This means that both indexes would have had to fall below their respective July 23rd breakout levels. For the Industrials this would be the 8799.25 and for the Transports this would be 3404.11. The decline from the August 13th high never took out the levels that initiated the bull market indication.

It should be noted that on July 22nd, Richard Russell had a bear market indication at the end of the trading day. On July 23rd, Mr. Russell had a bull market indication prominently displayed at the end of the trading day. As I've said in the past, most if not all, Dow Theorist should come to the same conclusion at the same time. This is widely represented by searching "Dow Theory " and "July 23, 2009."

As I said in my July 24th Dow Theory commentary, what remains unresolved according to Dow Theory is the fact that the Dow Jones Transportation Average has not gone above the previous high of 3774.12 while the Industrials keep racking up new, albeit tepid on a percent basis, daily highs. What we have currently is what is known as a classic Dow Theory non-confirmation. This non-confirmation is resolved by the Transports exceeding 3774.12 along with the Industrials making a new high (above each previous high point since March 9th) or both indexes going below the breakout level that initiated the bull market.

I am hopeful that Mr. Russell will either correct me on my interpretation (giving me the chance to learn something new from the best) or that he revises his indication to reflect that the market is bullish with a pending non-confirmation that needs to be resolved. Touc.

Please revisit Dividend Inc. for editing and revisions to this post.

Will the Real Mr. Buffett Please Stand Up!

As an investor who has to take responsibility for my actions, I seek out as much information as I can. Although I am willing to take in as much information as possible, I attempt to discern quality from the junk, critically analyze the information and questioning my assumption along with the author that I’m reading. For this reason it did not go unnoticed when I read the October 16, 2008 New York Times op-ed piece written by Warren Buffett titled “Buy American. I Am.”

It turns out that in my zeal for seeking quality information, I found that Mr. Buffett had written an article in Fortune Magazine back in May of 1977 titled “How Inflation Swindles The Equity Investor.” If you didn’t know who the author was you’d probably think that the articles were written by two entirely different people.

In the article “How Inflation Swindles The Equity Investor,” Warren Buffett states in significant detail many reasons why and how inflation is the bane of equity investors. One such reason is that in order for companies to get through an inflationary period they are forced to issue new shares to service liabilities that had been accrued in prior years. This method of dealing with inflation was used to offset the payment of dividends.

In essence, a company would pay a dividend “…of $3.3 billion and asked investors to return $3.4 billion” (in the issuance of new stock). According to Mr. Buffett, the act of paying dividends and then issuing new stock exceeding the value dividend payments is among the problems that are part of the equity swindle. It should be known that Mr. Buffett’s article was extensive and left no doubt about the impact that inflation has on corporations.

Fast forward 31 years later, Mr. Buffett writes a concise op-ed piece in the New York Times titled “Buy American. I Am.” Published in the throes of a banking crisis, Mr. Buffett’s words were intended to provide assurance to a public that couldn’t trust either the banks, the government or regulators assigned to ensure stability in the financial system. Mr. Buffett points out that government policy to deal with the financial crisis “…will probably prove inflationary and therefore accelerate declines in the real value of cash…” Mr. Buffett goes on to suggest that individuals would be wise to invest in stocks.

I begin to wonder how an investor is supposed to make sense of the two articles. In the one case, Mr. Buffett offers an elaborate explanation for why equity investors are getting "swindled" during inflationary periods. In the other case, Mr. Buffett suggests that over the next ten years stocks will beat cash in a high inflation environment.

Is the only distinction that Mr. Buffett is making is the comparison between cash and stocks during inflation? If this is the case then we have to wonder which is the bigger swindle, cash that is being debased or stocks, where the management of a company can arbitrarily increase the number of shares denominated in a debased currency.

As far as I can tell, the last several months have had the largest increase in the issuance of secondary offerings (new stock) from major corporations. You'd think that Mr. Buffett would be speaking out about this based on his writings from the 1970's. I believe that I know which of the two articles is correct however, what is a person supposed to think when they hear the most successful investor in the world seemingly speak out of both sides of his mouth? I'm guessing that Mr. Buffett isn't expecting us to remember what he said 31 years ago.

“A patriot wraps himself around the flag to defend it; a scoundrel wraps it around himself to defend himself”

Sources:
  • Ellis, Charles. Classics: An Investor's Anthology. The Institute of Chartered Financial Analysts. 1989. p. 483.
  • Buffett, Warren. "Buy American. I Am." New York Times. October 16, 2008. accessed online August 21, 2009.

Suburban Propane (SPH) Says, "Just Add Water"

In a move that is not uncharacteristic of an overpriced stock, Suburban Propane Partners (SPH) has issued 2.2 million shares at a market price of $41.50. SPH, a 10 year-dividend achiever, might as well shout from the hilltops that they don't think their price can go much higher therefore if we can unload these share on the public then so much the better.

SPH basically said that it was going to pay down debt with the money raised from the sale of the stock. So what they're doing is watering down the stock (diluting per share earnings) in a maneuver known as "Robbing Peter to Pay Paul" method of accounting. You've got to admit, it is a great strategy from the perspective of the company with overvalued shares but current shareholders are getting the shaft. In a May 5th article, I pointed out that SPH was at a relatively high price and should be considered for selling, the recent issuance of shares is the final nail in that coffin.

By the way, who do we think is buying up all these dilutive shares? All the companies that were involved in the syndication like Wells Fargo Securities (WFC), BofA Merrill Lynch (BAC), Citi (C) and Goldman, Sachs & Co. (GS) distribute any unwanted shares to the mutual funds that they manage. In effect, the mutual fund shareholders become the neighborhood "chumps." Touc.


Please revisit Dividend Inc. for editing and revisions to this post.

Dow Theory

When it comes to Dow Theory, we have to carefully monitor the market to see if we get a clear sign of a non-confirmation of the trend. A non-confirmation of the trend can take place in many ways and is most prominent when one index goes up while the other goes down. Anyone interested in Dow Theory must be vigilant for signals that might indicate that a reversal of the primary or secondary trend is in the offing.

On Friday August 21, 2009, the Dow Jones Industrial Average (^DJI) exceeded the prior high of 9398.19 set on Wednesday August 12th. Unfortunately, the Dow Jones Transportation Index (^DJT) are lagging in the ability to exceed the high of 3774.12 set on Thursday August 13th. The only thing that favors the Transports in this instance is the fact that on a percentage basis the Transports rose 2.58% versus the Industrials 1.67% increase. This indicates that there is relatively strong interest in the Transports. Hopefully this enthusiasm will spill over into today's trading.

If the Transports do not break above the August 13th high then we might be on track for a non-confirmation. A non-confirmation means that the recent upward trend in the market will be coming to an end soon. Conversely, if the Transports break the indicated high while the Industrials move moderately higher then we could be in good shape for the short term.

Dow Theory Q & A

Q.When looking at a chart with weekly Dow prices, how is the weekly price calculated? Is it the Friday close or is it an average of the whole weeks close?

A. In all my readings of Dow Theory, I cannot remember anyone suggesting the use of weekly data for analysis. This doesn't mean that weekly data isn't useful, you might see a consistent pattern that I would otherwise overlook. Dow Theory is supposed to be calculated by using the closing price for both indices on a daily basis. I have bastardized Dow Theory by taking the high and low price of a given period as a way to get a sense of herd mentality or market psychology. This is in contrast to taking only the closing price.

Depending on the source, weekly data is calculated using the opening price from the open on Monday, the high and low price is from whichever days in the week that had either number and the closing price from the Friday close. An average of the week isn't how the weekly closing price is calculated. Touc.


Please revisit Dividend Inc. for editing and revisions to this post.

Article Flashback: April 20, 2009

Below is my response to a critic of my April 20, 2009 article about how past management of the Dow Jones Industrial constituents had contributed significantly to the declines in the market from 1929 to 1932. I feel that this response is so instructive about stock indexes and the crash of 1929 that all my new readers should see it again for the first time.

According to this critic (SivBum) the purpose of an index is, "not to pick stocks with strength but to reflect the overall market place."

My response was the following:

"I completely agree with your comment that the purpose of the index isn't to pick stocks with strength but to reflect the overall market. However, you need strong companies to last long enough to actually reflect the market. Otherwise, the companies chosen would go out of business and then have to be be replaced. As you'll see below, many other stocks that went in and out of the index never were either obsolescent or bankrupt.

Although AIG has been nationalized it conceivably could still be in the index. After all, even though the railroads were nationalized in 1914 they still were part of the Dow-Jones Transportation Index.

Regarding changes to the Dow it should be noted that many companies have been added and dropped in the fashion of an inexperienced trader. Here are some notable examples:

  • American Tobacco was dropped in 1899 and added in 1924, was dropped in 1928 and replace with the American Tobacco B shares, B shares were dropped in 1930
  • General Electric was dropped in 1898, added in 1899, dropped in 1901, added 1907.
  • IBM was added in 1932, dropped in 1939, added in 1979
  • International Paper preferred shares were added in April 1901, dropped July 1901, common shares were added in 1956, dropped in 2004.
  • Remington Typewriter was added in 1925, dropped in 1927
  • Texaco or Texas Company was added in 1916, dropped in 1924, added in 1925, dropped in 1997.
  • Goodrich was added 1916, dropped in 1924, added in 1928, dropped in 1930.
  • Coca Cola was added in 1932, dropped in 1935, added in 1987.

The evidence seems to indicate that the managers of indices act like traders rather than trying to reflect the overall economy or market."

I have to thank the critics on Seeking Alpha for forcing me to go the extra mile in my research to make an even better point than I had set out to. Touc.


Please revisit Dividend Inc. for editing and revisions to this post.

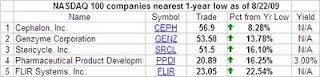
Nasdaq 100 Watch List

Industrial Production Index

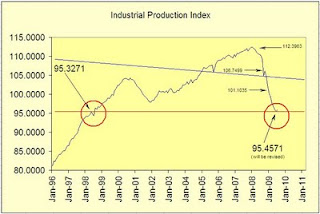
In my previous discussion of the Industrial Production Index (IPI), I clearly made a mistake in my interpretation of the “price” action of the index. On March 16, 2009, I said that if the IPI fell below 97.8399 then we would face the equivalent of economic “dark ages.”

In looking at the movement of the index, I dismissed the peak of 95.3271 on May 1998 and the trough of July 1998 as a significant technical support/resistance level for the index. This appears to be a critical oversight since the June 2009 low in the IPI at 95.4571 appears to have created a temporary support level. Even though the difference between 97.8399 and 95.4571 is only 2.32%, I feel it is necessary to identify this issue in my analysis as a potential learning opportunity.


Now for the shameless self-promotion, in my January 27, 2009 analysis of the IPI index, I said, "Based on this most recent move the IPI is expected to decline at least to the December 2001 level of 97.8399." This observation was about as accurate as you could get. Additionally, I said, “…we're in for at least another six months of declines in the IPI.” This assessment was off by 1 month which isn't bad. As mentioned before, the IPI hit a temporary bottom in June 2009. Some folks who snicker at the thought of technical analysis being applied to an economic indicator that isn’t even a critical component of the U.S. economy have every right to question the method. However, the fruitless effort, in this instance, “seems” to have been useful.

Finally, let’s look at where I think the IPI index is possibly going from here. In the 90-year history of the reporting of the IPI, there has been only one declining period in which the index had temporarily gone up and then down more than once (fake out.) We’ve already had one fake out of the index when it sharply rose in October of 2008 and then continued downward. I don’t see (revealing my limitations) this index falling below the current trough of 95.4571 until it does a Dow Theory retrace of at least one, and possibly all three, of the following upside targets:

  • 101.1035
  • 106.7499
  • 112.3963

Implicit in my discussion of the IPI is that we are at a turning point for the economy. Based on the combination of the Dow Theory confirmation of July 23, 2009 and the IPI turning up from the June low, I will have to guess that the National Bureau of Economic Research (NBER) is going to proclaim June 2009 as the official end to the recession. The end to this recession will be lackluster and questioned from all corners. Additionally, the stock market will only follow the pattern of a cyclical bull market (bear market rally) within a secular (long term) bear market. I doubt that the general public will agree that the recession is over since jobs will not be as plentiful as the past. However, from the standpoint of an economist the recession is over provided the IPI June low is sustained over an extended period of time.

Again, the IPI index generally lags the stock market by 6 to 9 months. Therefore, the index could continue to rise while the stock market has reversed to the downside. We’ll have to see just how much the most recent trough remains in place.Touc.

Monday's Article:

Dow Theory

Please revisit Dividend Inc. for editing and revisions to this post.

Dividend Achiever Watch List

The bull pushed the market up 227.41 points. The Dow closed at a yearly high of 9,505.96. My watch list shrank from 13 to 7 companies this week as the market pushed majority of the stocks above 20% range from the low. Here are the companies on my watch list as of August 21, 2009.

Cardinal Health (CAH): Right on Target

Like a bevy of bobby sock teenagers chasing their heartthrob crooner, analysts and reporters are falling all over themselves to point out the glowing earnings forecast of Cardinal Health (CAH.) Even the Cramer folks were crooning about CAH, too bad they're charging for information ex post. Any surprise to us? Naw, my June 4, 2009 research recommendation pointed out the obvious at a time when it was most useful to you. At the time, I was so stunned by the quality of the company I went so far as to say:

"Either the books are being cooked or this stock is ridiculously underpriced."

I went out on a limb with that remark but it was clear that, with a company that had increased its dividend every year for 12 years in a row, the quality of earnings wasn't an aberration. Just my luck, I issued a sell recommendation on July 29th. After all, I'm in pursuit of "fair profits" rather than holding and hoping. I love to sell my stocks to a frantic buying public. Rereading my June 4th post has a lot of insights that might be useful for new readers to my blog.

Again, research recommendations are meant to alert investors to potential long term opportunities while sell recommendations are intended to deal with the short term reality of the market. Touc.

Please revisit Dividend Inc. for editing and revisions to this post.

Becton Dickinson (BDX): On Our Radar First

It was no fluke that we pointed out Becton Dickinson (BDX) on our May 4, 2009 posting. Now we find that Warren Buffett was acquiring shares of BDX on June 30th at a price that was 16% above the price on May 4th. Using the strategy that has been outlined numerous times on this blog, I have noticed that, whenever Buffett has been reported buying domestic stocks they are companies that I have either purchased or researching almost 50% of the time. Too bad we recommended selling the stock on May 31st after an 11% gain. The good news is that if you didn't catch the boat the first time around then you can still buy the stock below the sell recommendation price.

When a company, in this case BDX, promises a dividend of 2.17% and the gain in the price is 500% what you could have earned if you held the stock for a whole year then the best thing to do is move on. This blog makes no illusions about the realities of the stock market. Research recommendations are meant to alert investors to potential long term opportunities while sell recommendations are intended to deal with the short term reality of the market. Touc.

"If people with either large or small capital would look upon trading in stocks as an attempt to get 12 per cent per annum on their money instead of 50 per cent weekly, they would come out a good deal better in the long run."

William Peter Hamilton. The Stock Market Barometer. 1922. p. 257.


Please revisit Dividend Inc. for editing and revisions to this post.

Dividend Achiever Watch List

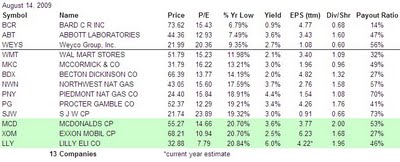
This was a volatile week for those who follow the market. We had a wild swing in the Dow which jumped from below 9,250 to above 9,400. At the end of the week, we are down 47 points. My watch list rose from 10 to 13 companies. Although the bottom three are marginally above 20%, they are great blue chip names that I can't leave them out. Here are the companies on my watch list as of August 14, 2009.

The companies that are within 10% of the low offer a great opportunity.
I flagged you to Becton Dickinson (BDX) last week in my watch list. It turns out that Warren Buffett is looking at the same thing. See this link for the related news.