Nasdaq 100 Watch List

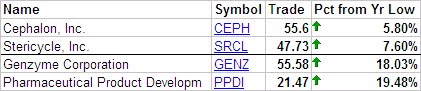
It is the firm belief of the New Low Observer team that anyone who does not investigate and acquire at least one of these stocks is, in our opinion, missing the sale of the decade. While the debate about nationalized healthcare begins to wane, there will be a palatable realization that the medical sector was unduly suppressed. Below I will feature BIIB and GILD. However, let's look at the Nasdaq 100 stocks that are within 20% of their 52-week low.

Nasdaq 100 Watch List (Yahoo!Quote Summary View):

  • Stericycle (SRCL) at $53.17
  • Gilead Sciences (GILD) at $43.83
  • Genzyme Corp. (GENZ) at $54.50
  • Cephalon, Inc. (CEPH) at $54.02
  • Biogen Idec (BIIB) at $43.81
Today’s watch list has the addition of Biogen Idec (BIIB). According to Valueline, BIIB has a historical mean price-to-cash flow of 12x. Based on the 2008 per share cash flow of $4.31, BIIB should revert, at some point, to the mean price of $51.72. At $43.81, BIIB is trading 18% below the mean price.

Below is the Coppock Curve for Gilead Sciences (GILD). The Coppock Curve is intended to provided the best risk-adjusted buy signal. If you review the price of the stock and have a short time frame, the buy signals were, at times, alarmingly accurate.

Using Yahoo!Finance's long term chart for GILD, we see the following prices for the above buy signals:

  • May 1994 at $0.48
  • Jan 1997 at $2.03
  • Aug 1998 at $1.14
  • July 2009 at $48.93

The fact that the stock trades below the July buy signal bodes well for those willing to investigate the qualitative elements of GILD. Touc.

Disclosure: Long CEPH

Dividend Achiever Watch List

The market was fighting hard at the 10,000 range but settled below that mark at the end of the week. The Dow gained 24 points (0%) this week. At the end of the week, my watch list expanded to 15 companies compared to 11 from the previous week. Here are the companies on my watch list as of October 23, 2009.

Symbol Name Price P/E % Yr Low Yield EPS Div/Shr Payout Ratio
SHEN Shenandoah Telecom 16.81 26.68 1.63% 1.90% 0.63 0.32 51%
WMT WAL MART STORES 50.44 14.79 9.06% 2.16% 3.41 1.09 32%
BCR BARD C R INC 76.74 16.09 11.31% 0.89% 4.77 0.68 14%
WEYS Weyco Group, Inc. 22.44 20.78 11.59% 2.67% 1.08 0.60 56%
WTR AQUA AMERICA INC 15.89 20.37 13.50% 3.65% 0.78 0.58 74%
NWN NORTHWEST NAT GAS 43.02 15.59 14.08% 3.86% 2.76 1.66 60%
PNY PIEDMONT NAT GAS
23.72 15.30 14.70% 4.55% 1.55 1.08 70%
CAH CARDINAL HEALTH
28.66 8.98 15.24% 2.44% 3.19 0.70 22%
BDX BECTON DICKINSON
67.50 14.00 16.10% 1.96% 4.82 1.32 27%
MCD MCDONALDS CP 59.43 15.76 17.82% 3.70% 3.77 2.20 58%
XOM EXXON MOBIL CP 73.57 11.80 18.93% 2.28% 6.23 1.68 27%
T AT&T INC. 25.73 12.74 20.01% 6.37% 2.02 1.64 81%
PGN PROGRESS ENERGY
37.68 13.13 20.19% 6.58% 2.87 2.48 86%
RLI R L I CP 51.11 23.66 20.23% 2.11% 2.16 1.08 50%
NJR N J RESOURCES CP 36.02 13.70 20.27% 3.44% 2.63 1.24 47%

15 Companies

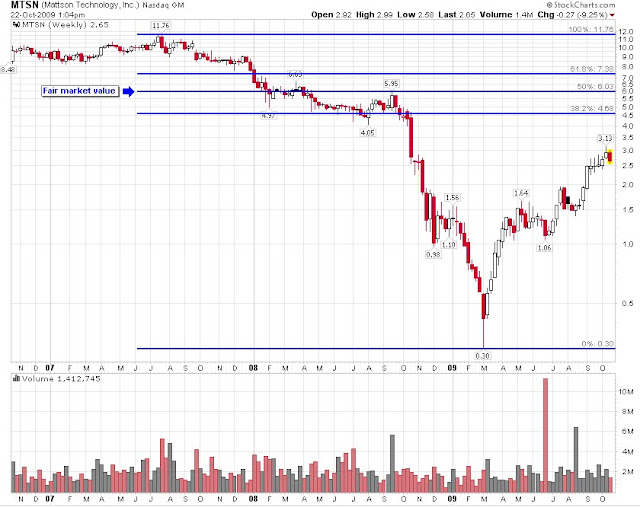
Speculation Observations: Mattson Technology (MTSN) at $2.65

Mattson Technology (MTSN) is a supplier of equipment to Semiconductor producers (i.e. Intel). Some of their competitors are Applied Materials (AMAT), Lam Research (LRCX), and Novellus (NVLS). These are 2 billion dollar plus companies versus a 130 million dollar company. Market cap doesn't tell me anything about valuation of the company, so I would ignore that figure for now.
Macro View
When the economy recovers, people feel better and they go out and buy a computer from suppliers like Dell or HP. These computer suppliers then have to ramp up their production and order more computer chips from Intel or Samsung. A demand surge triggered Intel to boost production by expanding their production capacity by purchasing more tools from the likes of Applied Materials or Mattson. This is what generally happens when the economy recovery takes place.
Market Exposure
In 2008, 19% of MTSN revenue came from Canon and 10% came from Samsung (from 2008 Annual Report). Because 90% of MTSN's revenue comes from overseas, this company is truly international company. The largest market they served is memory, which is estimated to be around 70% of their revenue. As you may guessed from going to Fry's or Best Buy, USB memory sticks sell for next to nothing. It's appropriate that this market has seen a fair share of margin contraction (lower profit). This may be the reason why the share price of Mattson and its competitors who are exposed to memory got cut in half.
Valuation
Mattson is currently trading around the $2.50 to $3.00 range. They hold $1.56 cash per share and $2.24 book value. As a result, you have a tech company with NO DEBT, trading at roughly 1.2x book value. That fits Benjamin Graham's formula. Tangible book value (this exclude IP value) is at $3.16 at the end of 2008. Because the company has negative earnings and no dividends, we can only assess valuation based on book value. Using Morningstar valuation tool, you see that over the prior of 10 years, the average trough book value is 1.2.
Some of the things I am concern about are negative earnings for this year and the next, possible burn in cash flow, and market liquidity issues. The company traded as high as $11.76 in 2007 then dropped to $0.30 in 2008. Assuming that you bought at the low and sold at $2.50, you would have gained 700%+ on your money. Such extreme low valuation will not likely return because the credit market have recovered somewhat.
So how do I come up with a fair market value for Mattson? Simple calculation based on Dow Theory suggest a fair market price of $6.03. The calculation is simple, take the peak price of $11.76, plus the absolute low of $0.30, then divide it by 2. That's the fair market value based on the Dow Theory interpretation. The chart below shows a graphical representation of from the peak to the most recent trough.
What You Need to Buy?
If you plan on buying MTSN as a speculation, here are things you need.
  • Strong and Healthy Heart for the up and down market. Don't be surprised if the price falls to $1.50 range.
  • Money you can "throw away". This is a speculation at best, so make sure you can lose it and still be ok.
  • Time. This company will need time to work through the current economic environment. It is safest to assume that the price will not revert to $6 simply because I wrote about it. The market will decide that.
Once again, this observation is on the deep end of the speculation pool. I've selected a stock that I believe has a lot more room on the upside but downside should be apparent based on the $0.30 low. Please do your homework and manage this speculation wisely.
Art

Disclosure: None

Follow-up Article:

Nasdaq 100 Watch List

This week the New Low Observer highlights four companies in the Nasdaq 100 that are within 20% of their 52-week low.
  • Cephalon Inc. (CEPH) at 3.56% above their 52-week low.
  • Gilead Sciences (GILD) at 17.27% above their 52-week low.
  • Stericycle (SRCL) at 17.76% above their 52-week low.
  • Genzyme Corp. (GENZ) at 18.79% above their 52-week low.

Cephalon (CEPH), according to Valueline, normally trades at 12 times cashflow. The cashflow for CEPH in 2007 was $5.41 per share (Mergent’s, was $5.78 for 2007.) Using the smaller figure, we get a price of $64.92 as the average price that the stock has typically reverted to. As the number of shares for CEPH have increased by 11% since 2007, I have adjusted lower the cash flow per share by 11% as a rough gauge of what the historical average price would be at 12x cash flow. The figure that I come up with is $57.72. This is 5.71% above the current price of $54.42. Valueline sees the negative cashflow figures persisting until the foreseeable future. (I have intentionally left out the negative cashflow figures for 2008 because the economy was in recession for the whole year.)

Gilead Sciences (GILD), according to Valueline, should be trading at 20x cashflow. With a cashflow of $2.32 in 2008, GILD averages a price of $46.40. Although Mergent’s has a cashflow figure that is higher, I will go with the most conservative figure that I can find. At the current price of $46.17, GILD is trading at the historical cashflow. Maybe this is a fading star but GILD has never traded below 20x cashflow for an extend period of time.

Based on 2008 cashflow figures from Valueline, Stericycle (SRCL) would trade around the $38.18 range. The 2008 cashflow for SRCL was $2.19 per share. This is significantly above the mean, which makes these share less inviting even though they are within 18% of the 52-week low.

Finally we have Genzyme Corp. (GENZ) at $55.94. This stock has historically traded at 19 times cashflow. The 2008 cashflow for this GENZ was $2.82, according to Mergent’s (Valueline had the higher figure.) GENZ, although selling 19% above the 52-week low, is a far superior value proposition. The shares outstanding have grown by 2.7% from 2006 to 2008 while the long-term debt has fallen by 85% over the same time frame.

Additional analysis will be provided on these companies as long as they stay within 20% of the 1-year low. Touc.

Disclosure: Long CEPH

Dividend Achiever Watch List

The market put on a bull horn and marched passed 10,000 but settled below that mark at the end of the week. The Dow gained 130 points (1.3%) this week.

We're mid way through October and if you recall the same time last year, this marked the beginning of the market freefall. As a result, many companies with their low mark have been pushed up by the moving 52-week range. At the end of the week, my watchlist expanded to 11 companies compared to 9 from the previous week. Here are the companies on my watch list as of October 16, 2009.

Symbol
Name
Price
P/E
% Yr Low
Yield
EPS
Div/Shr
Payout Ratio
SHEN
Shenandoah Telecom
16.81
26.68
1.63%
1.78%
0.63
0.30
48%
BCR
BARD C R INC
76.19
15.98
10.52%
0.89%
4.77
0.68
14%
WMT
WAL MART STORES
51.22
15.02
10.75%
2.13%
3.41
1.09
32%
WEYS
Weyco Group, Inc.
22.40
20.74
11.39%
2.68%
1.08
0.60
56%
NWN
NORTHWEST NAT GAS
43.39
15.72
15.06%
3.83%
2.76
1.66
60%
CAH
CARDINAL HEALTH
28.68
8.99
15.32%
2.44%
3.19
0.70
22%
MCD
MCDONALDS CP
58.78
15.58
16.53%
3.74%
3.77
2.20
58%
PNY
PIEDMONT NAT GAS CO
24.19
15.61
16.97%
4.46%
1.55
1.08
70%
WTR
AQUA AMERICA INC
16.65
21.35
18.93%
3.48%
0.78
0.58
74%
BDX
BECTON DICKINSON CO
69.26
14.37
19.13%
1.91%
4.82
1.32
27%
T
AT&T INC.
25.70
12.72
19.87%
6.38%
2.02
1.64
81%
11 Companies

Dividend Achiever Watch List

The market snapped out of the downtrend with force this week. The Dow gained 376 points or 4% this week. At the end of the week, our Dividend Achiever watch list has 9 companies compared to 12 from the previous week. Here are the companies on our watch list as of October 9, 2009.

Symbol
Name
Price
P/E
% Yr Low
Yield
EPS (ttm)
Div/Shr
Payout Ratio
WMT
WAL MART STORES
49.97
14.65
8.04%
2.18%
3.41
1.09
32%
CAH
CARDINAL HEALTH INC
27.32
8.56
9.85%
2.56%
3.19
0.70
22%
WEYS
Weyco Group, Inc.
22.65
20.97
12.63%
2.65%
1.08
0.60
56%
BCR
BARD C R INC
77.94
16.35
13.05%
0.87%
4.77
0.68
14%
PNY
PIEDMONT NAT GAS CO
23.73
15.31
15.64%
4.55%
1.55
1.08
70%
NWN
NORTHWEST NAT GAS
42.43
15.37
15.90%
3.91%
2.76
1.66
60%
BDX
BECTON DICKINSON CO
68.75
14.27
18.25%
1.92%
4.82
1.32
27%
PGN
PROGRESS ENERGY INC
37.45
13.05
19.46%
6.62%
2.87
2.48
86%
MKC
MCCORMICK & CO
33.67
16.75
19.91%
2.85%
2.01
0.96
48%
9 companies
Becton Dickinson (BDX) is still on this list and the price hasn't move much since Buffett announced back in August that he took a stake in the company. It may be worth reconsidering BDX based on the current lack of "action." Art.

Note: Abbott Lab (ABT) is no longer on this list after being on it since this list began in June. I flagged you to ABT on 9/24/09 and the stock has gained 8.5% since.

A Second Look at Cephalon Inc. (CEPH)

Speculative Observation
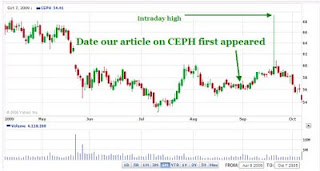
It is just our luck that Cephalon Inc. (CEPH) did exactly what we thought would happened based on the chart pattern in our August 27, 2009 article. In that posting, we said that we thought that Cephalon would experience a price breakout starting on the September 5th. The bias that we had in the article was clearly in favor of a stock price rise in the breakout formation. Part of our justification for this was due in part, on the fact that CEPH was, according to our metrics, relatively undervalued. However, we didn't know when and by how much the stock would rise.

On September 21st, Cephalon rose to an intraday high of $69.30, far exceeding our expectations for the stock in the short term. Because this stock does not pay a dividend we could not make a recommendation of this company as an investment observation. It appears that the speculative observation that we gave was appropriate for the recent moves in the price. However, the stock is now approaching the 52-week low again.
Below are the revised figures for the Dow Theory downside targets (since the upside takes care of itself):
  • $40
  • $31.66
  • $14.40
  • $6

For the reasons above, we highly recommend that you re-consider the article written on August 27th. With a $4 billion market cap, this stock should be among your choices of new speculative opportunities. Art and Touc.

Nasdaq 100 Watch List

Northwest Natural Gas (NWN) at $40.94

As I attempt to gather as much information on Northwest Natural Gas (NWN) before deciding to actually buy NWN, I found one bit of information that was almost astounding. As I have mentioned before, NWN has increased it's dividend every year for 53 years in a row. I have also talked about the fact that NWN will probably do everything in its power to maintain that dividend increasing history. So it is no surprise that the company announced on October 1, 2009 that will be increasing the dividend for the 54th year in a row.

In today's research recommendation of NWN, I will cover the issue of cyclicality, the Coppock Curve, natural gas prices, and Dow's theory as it relates to the stock. I have compiled this information as I consider buying NWN. It is hoped that you thoroughly review NWN from all angles before committing any money to this accomplished Dividend Achiever.

When someone asks me about any cyclical stocks that I might be able to suggest, I often stammer at the thought. In fact, I'm clueless as any true cyclical stocks. However, after a considerable review of NWN, I can prove that it is definitely a true cyclical stock. First, NWN has exhibited a pattern of hitting a relatively low price between the months of January and May since 1970.

The stock hitting a low during the first five months of the year occurred 87% of the time. New lows during the months of February, March and April took place 78% of the time within the period from January to May. The month of February comprised 33% of the new lows between January and May. From the numbers that I ran, February and April are the most optimum month to consider buying this stock.

Next up is the Coppock Curve for NWN. In the chart below, you can seen that the Coppock Curve along with a 14-month trendline. After falling below the zero line, the rise crossing over the trendline indicated a ideal buying point on the first day of November 1994 at an adjusted price of $7.67. Subsequently, the stock reached an adjusted high of $16.74 in December of 1997.
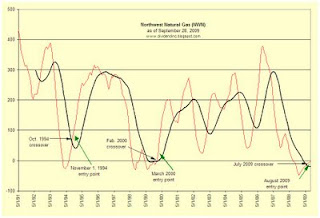
The next point when the Coppock Curve was crossed by the 14-month trendline was in February 2000. If you bought the stock on the first day of March 2000 at the adjusted price of $12.70, you would have seen the shares rise to an adjusted price of $52.19 on September 18, 2008. The rise from March 2000 to September 2008 is in spite of the bear market which began in October 2007. Currently, NWN's Coppock Curve has just crossed above the 14-month trendline. All indications are that this is a buying point based on the Coppock Curve.

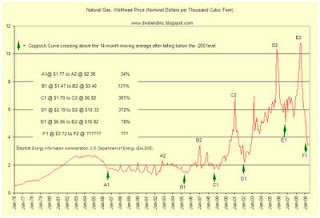
Next up is the natural gas wellhead price from 1977 to the present. In the chart below, I have indicated the points where, based on the Coppock Curve, the price crossed above the 14-month trendline. It appears that the Curve accurately called the bottom in the price, almost to the very lowest point possible. From this indication, it appears that the natural gas wellhead price is about to rise from here.
Finally, we'll look at the prospective upside and downside targets for NWN based on Dow's Theory.

Upside:

  • $42.31
  • $48.01
  • $53.71
Downside:
  • $36.20 (fair value)
  • $30.30
  • $18.50
All of the data points that I have mentioned should be included in your fundamental analysis of this stock. Pay particular attention to the downside targets since this is your best gauge of the risk you might be taking.
It appears that management feels confident about the prospects for the company down the road based on the most recent dividend increase. However, as the number of years of consecutive dividend increases ratchet higher the probability of a dividend cut increases. I am putting this stock on my personal watchlist so that I can buy it at the most optimal price, hopefully lower than the current level. Touc.
related Articles:
Please revisit Dividend Inc. for editing and revisions to this post.

Dividend Achiever Watch List

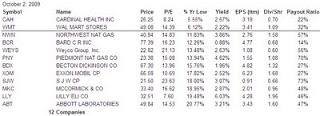
It was another down week for the Dow which gave back 175points (-1.81%) this week. At the end of the week, my watch list has 12 companies compared to 9 from the previous week. Here are the companies on my watch list as of October 2, 2009.
Recent Articles
Stock to Watch: Cardinal Health (CAH)

Research Request: Mylan, Inc. (MYL)

Research Request: Mylan, Inc. (MYL)

A reader request that I do some research on Mylan (MYL) back on 8/7.  On that day, MYL closed at $13.19. Today, it closed at $15.59 which is 18% higher.  Since Mylan used pay dividend but halted distributions in 3Q07 (but kept preferred shares dividend), investor will be investing for capital gain basis. With that, my model is based on earning, cash flow, and book value. My knowledge of pharmaceutical is limited but you don't need to know everything about the business as long as you can place a valuation on a stock. Let's take a look at Mylan.
Mylan engage in the generic pharmaceutical market. They do everything from development, manufacture, marketing, licensing, and distribution of their products. Check out their website for more detail about Mylan.
After obtaining data from Valueline, my model shows that Mylan is approaching fair value of $21.75. My "bargain" price is at $8.25. Another price target is the "buy" price of $16. Given that Mylan is at $15.60, your risk is 47% (8.25/15.60 - 1) and upside of 39% (21.75/15.60 -1). Risk / reward analysis tells me to be a seller not a buyer at this level. Let's dive deeper and see if there are more reasons for me to be a buyer or seller.
A closer look at  the balance sheet revealed a concerning story. Mylan engaged in many acquisitions and I am not the one to tell you if they were in fact good or bad acquisitions. I do not have the ability or capability to estimate what those future cash flow or earning will be. What I do know is that due of those acquisitions, Mylan had to raise  debt and take hit to their cash flow and earning. Not a good combination. Their debt level was $30.6 million in 1999. That figure rose to $51.3 Billion (with a B) in 2009, a 67% increase on a compound annual basis. At the same time their cash flow rose 15%, earning rose 6%, and book value rose 8%.
Currently, Mylan is trading at 17x trailing P/E, 10x F P/E, and 1.7x P/B. It may appeared to be "cheap" but a large debt over hang scares me. Debt due in five years is $145 million. If Mylan doesn't make enough to pay back their debt, they would have to refinance their debt at a time when I expect the interest rate to be at a much higher level. While cutting common stocks dividend, the company kept preferred dividend, issued more stocks, and raised more debt. I can't see why this is good for the common shareholders. As stated above, if price fall to $8.25 then I may consider it.
This is just one man's opinion. To get additional analysis, I recommend you cross check my analysis with Morningstar (report can be obtain freely from your local library), S&P (I get that from TDAmeritrade), or Valueline.

Art

End of September Market Commentary

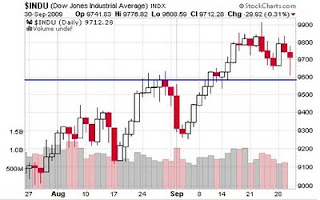
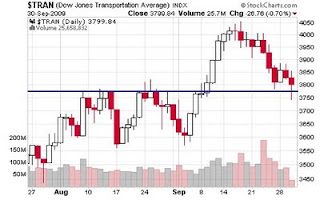
Today's action was a close one for the market. The Transport index, at one point, broke below the previous high from late August. The Industrial Index is still well above the previous high so nothing to worry about there. If the Transports were to closed below the previous high, we would have the first part of the non-confirmation move under the Dow Theory.
Note: If you are not familiar with the Dow Theory, please read a free description from Dow Theory Letter or StockCharts, but I recommend reading Richard Russell's Letter.
Coppock Curve
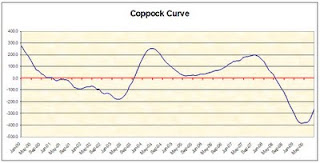
At the end of September, the Coppock Curve or Index remained bullish. People who understand the Coppock Curve may wonder why I still keep track of the curve since the buy signal was given to us in May. My answer is that I don't want to this to be a false buying signal such as the one in 2001. The curve rose by 53.8 points, the highest since the buy signal was triggered.


Summary
We are cautiously bullish on the market. We are looking to purchase Northwest Natural Gas (NWN) and Cardinal Health (CAH). This will depend on what the overall market does when we start October.
Art

Stock to Watch: Cardinal Health (CAH)

Cardinal Health (CAH) is one of the leading wholesale distributors of pharmaceuticals, medical/surgical supplies, and related products to a broad range of health care customers. The company completed a unit spin-off, CareFusion (CFN), on 9/1/09. Any investors with shares of CAH at the end of August received 0.5 shares of CFN. As a result, CAH price was adjusted down to $25.11 on 9/1/09 from $34.58 on the previous day. Two weeks later, Goldman Sachs upgraded CAH to a "buy" rating from "neutral" with a target price of $31. The stock closed at $27.29 on that day.
I pitched Cardinal Health to my readers several times prior to this writing. The first was a simple technical look at this stock on 6/11, 7/11, and 8/20. What I saw then was a stock with great fundamental developing a strong technical pattern called "triple bottom". Today I pitch you Cardinal Health once again with the different view. If you purchased this stock without selling them as I did, you would have done very well. As an added bonus, you would've gained some shares of CareFusion which rose 10.5% since it began trading. So let's dig into the number.
Cardinal Health came back on my radar on 9/18 watch list as because it appeared to be within 20% from the yearly low. A closer look at CAH shows a revealing valuation proposition. CAH is currently trading at 1.11x book value, 12x Forward P/E, 6x Cash, and 2.6% dividend yield. The undervaluation appeared to be because of the split but CFN is also trading at a discount value when you see it is trading at 0.88x book value. CAH is estimated to grow 8.4% (based on low estimate) and with yield of 2.6% that is a good 11% return. The great thing is the top line revenue is expected to stay relatively flat which mean they will be more efficient.
Using dividend as an insurance against price decline, investors will be rewarded with $0.70 per shares or 2.6% yearly. With low earning estimate of $1.89 for 2010, the payout ratio is 37%. Taking the previous year dividend increase rate, I project that CAH will raise payout to $0.74 for 2011. Low end estimate is projected at $2.05 which brings payout ratio down to 36%.
My model shows CAH should be at $40 range but this is based on previous year results including figures from CFN.  Surely I could be wrong and price fall, but as a value investor, I will not get many chances to buy a medical company at or near its book value. Given that all CAH competitors (ABC, MCK, and OMI) are trading at more than 2.3x book value, CAH is deeply discounted at 1.1. My estimate shows any 1.95x book to be low end of CAH and that would bring share price to $47. A 74% gain! That is just crazy. I will probably re-buy this stock in the days ahead.
Art

Disclosure: All figures are from Yahoo! Finance as of 9/29/09

Dividend Achiever Watch List

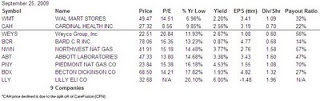
The Dow gave back 153 points (-1.56%) this week. At the end of the week, my watch list has 9 companies compared to 8 from the previous week. Here are the companies on my watch list as of September 25, 2009.
Recent Articles

Stock Checkup: Nacco Industries Inc. (NC)

Stock to Watch: Abbott Laboratories (ABT)

Abbott Laboratories (ABT) is a worldwide health care products provider. This $72.5 billion company, based on market capitalization, employs 69,000 employees worldwide. One of their well known products include FreeStyle, which is a blood glucose monitoring system. There are more products that ABT sell that I do not know but I am less concern about that. What struck me most about ABT is the valuation and its inability to move up during the most recent bull market run. This may be because upside momentum traders are trading name like Research In Motion (RIMM), Apple (AAPL), or Freeport McMoran (FCX). I'm just the opposite of a upside momentum trader, the less upside momentum, the easier it is for me to consider buying.
Fundamentals 

Currently, ABT is trading around $47, has a price-to-earnings (p/e) ratio of 14, sells at 10x cash flow, and has a dividend yield of 3.4%. ABT is less than 15% above its one year low. My model shows ABT is undervalued with a dividend yield of 3% or 13 p/e, 10x Cash flow or below $49. I weight more valuation on dividend yield and thus I believe the shares are relatively undervalued at this price. One of the most impressive things about this company is their ability to raise the dividend by 11% in April. The dividend payout went from $1.44 to $1.60.
Technicals 

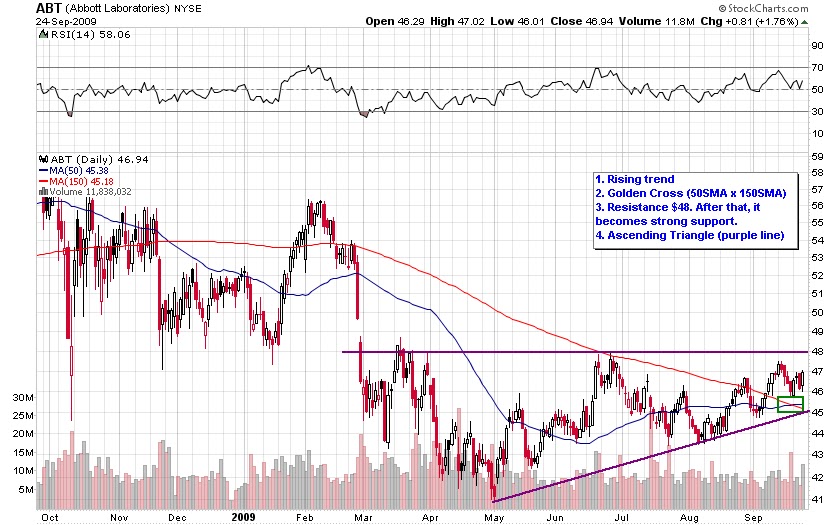
The technicals are another aspect I pay strong attention to prior to buying any stock. I wrote about ABT's technical back on 6/8/09 and showed a possible reversal or head-and-shoulderpattern.

To follow up with what I am seeing today, I have drawn the chart below. Two strong pattern I see are the golden cross which is when short-term moving average crosses mid-term moving average and an ascending triangle.

Finally, in the chart below we have the altimeter for ABT. The altimeter really puts thing in perspective.

As we can see, ABT has a low range at 103 and a high range at 171. In two prior instances, I have circled the areas where ABT went up and then fell back down before rising to a new overvalued level. Currently, ABT is either in the middle of another temporary rise before falling a little bit further or we could be in a full scale move straight to overvaluation. In either case, if you bought now, according to the altimeter, you wouldn't be overpaying for this stock.

I believe Abbott is at the right valuation and urge you to start looking at it. Do your research before committing your capital.