
- Japan
- Market Indicator
- Price Momentum Indicators
- Richard Russell
- Silver
- Speed Resistance Lines
- U.S. Dividend Watch List
Nasdaq 100 Watch List: July 12, 2013
Below are the Nasdaq 100 companies that are within 11% of their respective 52-week lows. Stocks that appear on our watch lists are not recommendations to buy. Instead, they are the starting point for doing your research and determining the best company to buy. Ideally, a stock that is purchased from this list is done after a considerable decline in the price and rigorous due diligence. Continue reading
Dividend Watch List: July 12, 2013
Below are the 9 companies on our U.S. Dividend Watch List that are within 11% of their respective 52-week lows. Stocks that appear on our watch lists are not recommendations to buy. Instead, they are the starting point for doing your research and determining the best company to buy. Ideally, a stock that is purchased from this list is done after a considerable decline in the price and rigorous due diligence.
Review: XAU Speed Resistance Lines
In our very first attempt at understanding Edson Gould’s Speed Resistance Lines, when the Philadelphia Gold and Silver Stock Index (XAU) was within 6 trading days of the top (found here), we said the following: Continue reading
Review: Royal Gold (RGLD) Speed Resistance Lines
On October 12, 2012 (found here), when Royal Gold (RGLD) was within 11 trading days of the all-time high at $89.27, we said the following: Continue reading
Posted in Edson Gould, RGLD, speed resistance line, SRL
Tesla Motors Added to Nasdaq 100, The Countdown Begins
On July 8, 2013, it was announced that Tesla Motors (TSLA) would join the Nasdaq 100 starting on July 15, 2013 (PR here). Our analysis of Tesla will follow the review and performance of additions and deletions to the NASDAQ 100 Index.
As has been well documented on our site, the Nasdaq OMX has a history of adding and deleting companies on the Nasdaq 100 Index in a manner that is consistent with a money losing speculator. The most recent example of the NASDAQ OMX follies, prior to TSLA, was when Netflix (NFLX) was added to the index after the stock price rose +141.32%…after being dropped from the index on December 24, 2012 (PR here). Not to be outdone by itself, the NASDAQ OMX team previously added NFLX to the Nasdaq 100 on December 20, 2010 (PR here).
Our NASDAQ OMX debrief on NFLX additions and deletion:
-
Added to Nasdaq 100 on 12/20/2010: stock declines –49.32%
-
Dropped from Nasdaq 100 on 12/24/2012: stock gains +141.32%
-
Added to Nasdaq 100 on 6/6/2013: to be determined; up +11.98% so far
In our annual Nasdaq 100 Re-Rank Review in December 2012 (found here; includes 2010 and 2011 reviews), we pointed out that the stocks being dropped from the index typically outperform the stocks that are added to the index within the first year (our minimum benchmark). Below is the performance of the stocks that were added or dropped since the Nasdaq 100 changes on December 24, 2012:
|
Symbol
|
Name | 12/24/2012 | 7/10/2013 | % change | |
| ADI | Analog Devices, Inc. | 41.35 | 46.73 | 13.01% | added |
| CTRX | Catamaran Corporation | 49.2 | 47.31 | -3.84% | added |
| DISCA | Discovery Comm. | 60.82 | 82.86 | 36.24% | added |
| EQIX | Equinix, Inc. | 198.56 | 190.84 | -3.89% | added |
| LBTYA | Liberty Global Inc. | 60.31 | 77.42 | 28.37% | added |
| LMCA | Liberty Media Corporation | 110.5 | 135.06 | 22.23% | added |
| REGN | Regeneron Pharmaceuticals | 179.71 | 236.7 | 31.71% | added |
| SBAC | SBA Communications Corp. | 69.62 | 75.94 | 9.08% | added |
| VRSK | Verisk Analytics, Inc. | 48.84 | 61.67 | 26.27% | added |
| WDC | Western Digital Corporation | 37.78 | 67.23 | 77.95% | added |
| Average | +23.71% | ||||
|
Symbol
|
Name | 12/24/2012 | 7/10/2013 | % change | |
| APOL | Apollo Group Inc. | 21.02 | 17.89 | -14.89% | dropped |
| EA | Electronic Arts Inc. | 15.3 | 23.9 | 56.21% | dropped |
| FLEX | Flextronics International | 6.09 | 7.86 | 29.06% | dropped |
| GMCR | Green Mountain Coffee | 40.32 | 70.09 | 73.83% | dropped |
| LRCX | Lam Research Corporation | 36.37 | 49.52 | 36.16% | dropped |
| MRVL | Marvell Technology Group | 8.21 | 11.71 | 42.63% | dropped |
| NFLX | Netflix, Inc. | 93.3 | 243.82 | 161.33% | dropped |
| RIMM | Research In Motion Limited | 14.04 | 9.28 | -33.90% | dropped |
| VRSN | VeriSign, Inc. | 35.9 | 45.66 | 27.19% | dropped |
| WCRX | Warner Chilcott plc | 11.7 | 19.53 | 66.92% | dropped |
| Average | +44.45% |
As can be seen in the table above, on average, the stocks that were “added” underperformed the stocks that were “dropped” by 87%. To be fair, if we exclude the gains of Netflix (NFLX), then the gains of the stocks “dropped” from the index would fall to +31.47%. However, this is still nearly 33% greater than the gains achieved by the stocks that were “added” to the Nasdaq 100 Index. Alternatively, if the highest performing stocks were deleted from each group, then the gains would be +17.69% for “added” versus +31.47% for “dropped”.
We understand that the parameters for addition and deletion of companies to the Nasdaq 100 are mechanical and therefore cannot discern qualitative aspects of the stocks being included in the index. However, individual investors should strategize around some of the demonstrated weakness and strengths of companies added to and dropped from the Nasdaq 100 Index.
Tesla Downside Targets
With Tesla being added to the Nasdaq 100 after the stock has climbed a parabolic wall of worry, it seems fitting that we are now able to project downside targets for the stock applying Edson Gould’s Speed Resistance Lines (SRL). Below is the SRL for Tesla Motors as of July 10, 2013:

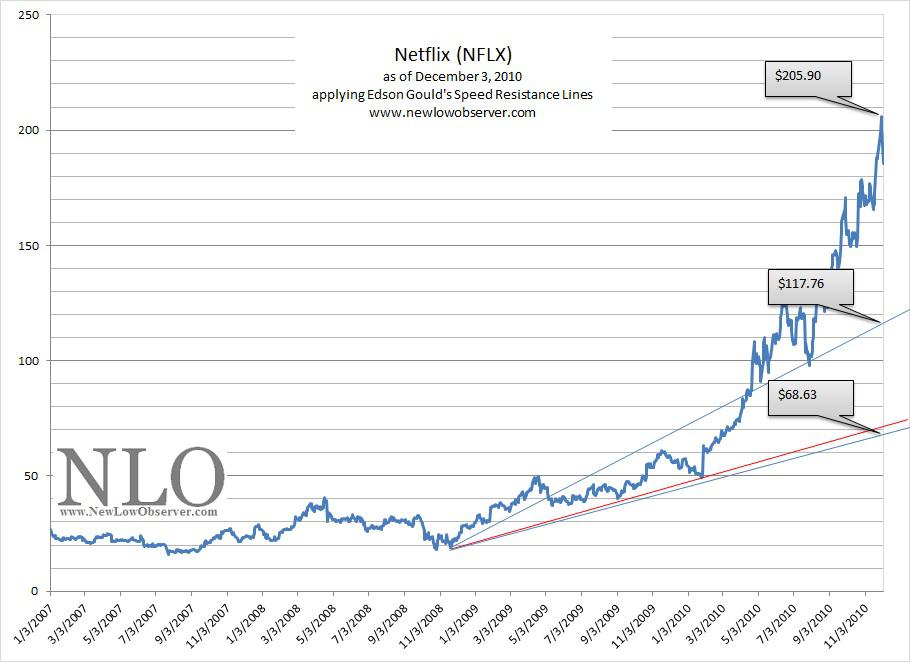
Few stocks that we have run the SRL on had such an extraordinary climb in price. Even our Netflix SRL (found here) from December 3, 2010 had a more gradual rate of increase. Based on Edson Gould’s SRL, TSLA has a conservative downside target of $64.56 while the extreme downside target is set at $41.77. There is the off-chance that TSLA could go as low as $30. However, this interpretation cannot be taken into consideration until TSLA reaches the $41 level.
Keep in mind that falling by half is not an easy task. As was the case with our Netflix SRL from December 3, 2010, NFLX climbed +61.08% before falling below both our conservative and extreme downside targets. We don’t short stocks based on SRL. Instead, we consider buying stocks once they achieve our downside targets.
With Tesla Motors being added to the Nasdaq 100 Index after having an increase in price by +264% in the last six months, there will be plenty of action for this stock in the short and long-term.
Posted in Nasdaq 100, Netflix, NFLX, Tesla Motors, TSLA
Gold Price: Affected by Gold ETF Outflows?
Subscriber F.H. brings our attention to a comment made by a gold fund manager. The manager suggested that the reason for gold’s weakness is primarily due to the liquidation occurring in gold ETFs. This implies that if there weren’t gold ETFs, then the price of gold would not decline as much as it already has (possibly not at all). However, our work on this topic is to check the data and show how easily this can be proven an incorrect analysis.
The chart below quickly demonstrates that gold outflows from ETFs is a symptom and not the cause in the decline of gold.

What did we do to arrive at the outcome above? First, we already knew that the price of gold declined -50% from the 1974 peak to the 1976 trough. This simple fact, within what is widely accepted as the last secular bull market for gold (1971-1980), acted as our starting point. In our myopic view, when comparing data, you must compare like to like, bull market to bull market and bear market to bear market. Therefore, selecting a set of data from the secular bear market in gold from 1980 to 1999 would result in flawed analysis.
Second, we took the period when gold went from $100 to its respective peak in 1974 and trough in 1976 then compared that period (in trading days; 833 days) to the current period going backwards 833 trading days.
Finally, we noted the fact that each period was with and without gold ETFs.
-
Please note that when we analyze any data, we only seek the “big picture” view, something akin to the horseshoes and hand grenades analogy.
What is our interpretation based on this rudimentary and potentially flawed approach?
First, gold ETF outflows are not the reason why gold is declining. Instead, gold ETF outflows are a mirror of the price of gold, albeit a somewhat distorted mirror.
Second, the decline in the price of gold has been normal within what we believe to be a secular bull market in gold. So far, gold has declined “only” –35% from the 2011 peak. This is contrasted with the aforementioned decline of –50% from the 1974 peak to the 1976 trough. What would change our view that we are no longer in a secular bull market in gold? Our highly biased view is that a bear market begins when gold and silver declines below our 1996 purchase price of the respective metals. However, the real world analysis says that a secular bear market is confirmed when gold attempts to go above the $1,895 price but fails. Lacking a qualified retest of the prior high, we will infer that we’re still within a secular bull market for precious metals.
Third, our view is that when a gold fund manager speaks they have only one message, gold related investments are always good and never bad. This opinion is the same for technology, biotechnology, small cap, large cap and international fund managers. There will never be a day when a fund manager says, “My fund is [I’m] not needed for the next several months or years.”
Our final interpretation is that when a gold fund manager uses the explanation that the outflow of funds from gold ETFs is the predominate reason for the price decline in gold, it demonstrates a significant lapse of analysis.
Transaction Alert
Posted in ABX, CRR, gold, gold bugs, Gold Stock Indicator, Transaction Alert
Tagged members
Does the Budget Surplus Affect the Price of Gold?
Subscriber R.G. asks:
“Will the precious metal sector be affected in anyway by the CBO budget surplus? http://www.marketwatch.com/story/cbo-sees-115-billion-june-budget-surplus-2013-07-09”
Our response:
As far as we can tell, a government budget surplus or deficit does not materially correspond to an increase or decrease in the price of gold. Take a look at the chart below:

Taking artistic license on the matter, over the past 36 years, we’ve seen equally as many periods of correlation as divergence in the budget deficit/surplus and gold on a short-term basis. In addition, although the deficit has dramatically increased since 1980, the price of gold has fallen and increased equally as much on a long-term basis.
Our only conclusion is that there is no substantive value in seeing a relationship between the U.S. budget and the price of gold.
Citations:
-
Federal Reserve Economic Data. Federal Surplus or Deficit [-] (FYFSD), Millions of Dollars, Annual, Not Seasonally Adjusted. Link: https://research.stlouisfed.org/fred2/graph/?id=FYFSD, accessed July 9, 2013
-
USA Gold. Daily Gold Price History. Link: http://www.usagold.com/reference/prices/history.html, accessed July 9, 2013
Precious Metal Juniors or Majors?
Reader T.H. asks:
“What is your position on miner shares since the absolute destruction of share prices across the board? does it make a difference to differentiate between juniors and large miners? this sector could be setting up with spectacular gains if timed right.”
Our Response:
There are two types of gold stocks right now, investments and speculations. The investment category are those gold stocks that are members of the XAU or HUI index. Constituents of Market Vectors Junior Gold Miners ETF (GDXJ) are the gold stocks that are speculations.
Because many of the gold stocks that are part of the GDXJ will die on the vine, the best opportunity for taking advantage of the juniors is with GDXJ. However, keep in mind that GDXJ is a "product" and not an asset. Theoretically, assets can be held for the long-term while products must have a "sell by" date or price.
Below we have listed the gold and silver stocks that are ranked by payout ratio:
| Symbol | Name | Price | P/E | EPS | Yield | P/B | % from yr low | payout ratio |
| ABX | Barrick Gold Corporation | 14.11 | - | -0.86 | 5.8 | 0.61 | 5.13% | -93.02% |
| KGC | Kinross Gold Corporation | 4.61 | - | -2.16 | 3.4 | 0.53 | 1.99% | -7.41% |
| GOLD | Randgold Resources Limited | 62.69 | 14.1 | 4.44 | 0.8 | 2.09 | 0.66% | 10.81% |
| GFI | Gold Fields Ltd. | 4.94 | 5.03 | 0.98 | 2.9 | 0.7 | 5.57% | 14.29% |
| HL | Hecla Mining Co. | 2.78 | 61.48 | 0.04 | 0.4 | 0.69 | 4.40% | 25.00% |
| BVN | Compa | 14.12 | 6.19 | 2.28 | 3.9 | 0.98 | 5.38% | 25.44% |
| AU | AngloGold Ashanti Ltd. | 12.79 | 17.3 | 0.74 | 1.7 | 0.88 | 2.28% | 28.38% |
| SLW | Silver Wheaton Corp. | 19.34 | 11.99 | 1.61 | 2.5 | 2.08 | 8.73% | 29.81% |
| HMY | Harmony Gold Mining | 3.475 | 10.63 | 0.33 | 2.7 | 0.36 | 5.32% | 30.30% |
| GG | Goldcorp Inc. | 24.31 | 13.74 | 1.77 | 2.5 | 0.84 | 9.45% | 33.90% |
| FCX | Freeport-McMoRan Copper & Gold | 27.6 | 8.96 | 3.07 | 4.6 | 1.45 | 4.27% | 40.72% |
| NEM | Newmont Mining Corporation | 27.12 | 8.27 | 3.29 | 5 | 0.97 | 2.26% | 42.55% |
| AUY | Yamana Gold, Inc. | 9.19 | 18.4 | 0.5 | 2.8 | 0.87 | 7.37% | 52.00% |
| AEM | Agnico Eagle Mines Limited | 27.8 | 18.6 | 1.49 | 3.3 | 1.37 | 0.22% | 59.06% |
| RGLD | Royal Gold, Inc. | 42.04 | 32.76 | 1.28 | 1.9 | 1.12 | 8.28% | 62.50% |
| GORO | Gold Resource Corp | 8.75 | 17.82 | 0.49 | 4.3 | 5.04 | 10.23% | 73.47% |
| AUQ | AuRico Gold Inc. | 4.54 | 27.67 | 0.16 | 3.6 | 0.55 | 12.47% | 100.00% |
| PAAS | Pan American Silver Corp. | 11.56 | 40.35 | 0.29 | 4.4 | 0.62 | 2.21% | 172.41% |
The precious metal stocks are arranged by the payout ratio, which in our opinion is the best measure of sustainability of the dividend. Dividend payout ratios of 50% and less are the most likely to be maintained. However, the trials that lay ahead in the precious metal sector may require more cuts in the dividend.
Two notes of caution are required. First, we’re not yield chasers and advise that gold stocks are not purchased based on dividend yield. Second, Barrick Gold (ABX) and Kinross Gold (KGC) are wild card speculations, with payout ratios in the minus column due to negative annual earnings. Investment in these companies are highly volatile plays that will pay off big. However, the challenge will be sitting through the gut wrenching declines that may be ahead.
Gold Stock Indicator
The Gold Stock Indicator (GSI) is on course to retest the June 26, 2013 low.

Our theory on the GSI at the current level suggests that a steady purchase of gold stocks at or below current prices.

Dividend Watch List: July 5, 2013
Below are the 12 companies on our U.S. Dividend Watch List that are within 11% of their respective 52-week lows. Stocks that appear on our watch lists are not recommendations to buy. Instead, they are the starting point for doing your research and determining the best company to buy. Ideally, a stock that is purchased from this list is done after a considerable decline in the price and rigorous due diligence.
Investing in Foreign & Emerging Stock Markets
Subscriber R.G. asks:
“If emerging markets possess such a gambit due to their lack of similar history in the past how can we analyze the markets in order to capitalize on their surges of demand which quickly taper[s] off?”
Our general view on foreign and emerging markets is similar to that of Warren Buffett’s when he said:
“'If I can't make money in the $4 trillion US market, I shouldn't be in this business. I get $150 million earnings pass-through from the operations of Gillette and Coca-Cola. That's my international portfolio’ (source: Ellis, Charles D. Wall Street People. page 56. link here.)”
There seems to be little need to invest in foreign or emerging markets. However, if there is a desire to invest in foreign markets then Dow Theory provides a reasonable template for how to approach investing in such a market. In a section titled “Dow's Theory True of Any Stock Market,” William Peter Hamilton says the following:
“The law which governs the movement of the stock market, formulated here, would be equally true of the London Stock Exchange, the Paris Bourse or even the Berlin Boerse. But we may go further. The principles underlying that law would be true if those Stock Exchanges and ours were wiped out of existence. They would come into operation again, automatically and inevitably, with the re-establishment of a free market in securities in any great capital. So far as, I know, there has not been a record corresponding to the Dow-Jones averages kept by any of the London financial publications. But the stock market there would have the same quality of forecast which the New York market has if similar data were available. (source: Hamilton, William Peter. Stock Market Barometer. Harper & Brothers Publishers, New York. page 14. link here.)”
When we speak of Dow Theory, we are referring to the emphasis of values, fundamentals in relation to price as they pertain to individual stocks and the stock market. We are putting less emphasis on the strict technical analysis of the equivalent industrial and transportation indexes.
To be clear, because we live in the United States we emphasize investing in the U.S. However, according to Hamilton, it does not matter which country that you’re in, investors should embrace the comparative advantage of living in a country other than the United States and should become experts of value opportunities in that region.
Posted in Dow Fair Value, Dow Theory, Value Investing, values
Gold: 50% Principle
From a Dow Theory perspective, downside targets rely heavily on the concept of the 50% principle. Although mistakenly attributed to E. George Schaefer by Richard Russell, the 50% principle is derived from Charles H. Dow’s “great law of action and reaction.” Dow describes the “law” in the following manner:
“The market is always responsive to the great law of action and reaction. The longer the swing one way the longer it will be the other. One of the best general rules in speculation is the theory that reaction in an advance or a decline will be at least one-half of the primary movement [50% principle].
“The fact that the law is working through short ranges and long ones at the same time makes it impossible to tell with certainty what any particular swing may do; but for practical purposes, it is not infrequently wise to believe that when a stock has risen 10 points, and as a result of one or two short swings [double tops] does not go above the high point, but rather recedes from it, that it will gradually work off 4 or 5 points.[1]”
In another excerpt from Dow’s work, on the topic of the 50% principle, Dow says:
“It often happens that the secondary movement in a market amounts to 3/8 to ½ of the primary movement.[2]”
Again, Dow emphasis the concept of the 50% principle:
“Whoever will study our averages, as given in the Journal for years past, will see how uniformly periods of advance have been followed by periods of decline, amounting in a large proportion of cases to from one-third to one-half of the rise. [3]”
Finally, George Bishop, one of the greatest authors on the topic of Charles H. Dow, concludes:
“The law of action and reaction applies to both the general market and to individual stocks. This law states that the reaction to an advance or decline will approximate half the original movement.[4]”
Dow Theory 50% Principle for Gold
Dow Theory downside targets for the price of gold, based on the peak of $1,895 and the initial low of $252.80 based on the closing price, is charted below (July 20, 1999 and September 5, 2011, respectively):

Citations:
-
[1] Dow, Charles H. Wall Street Journal. October 19, 1900.
-
[1] Bishop, George. Charles H. Dow and the Dow Theory. Appleton-Century-Crofts. New York. 1960. page 119.
-
[1] Sether, Laura. Dow Theory Unplugged. W&A Publishing. 2009. page 112.
-
[2] Dow, Charles H. Wall Street Journal. January 22, 1901.
-
[2] Bishop, George. Charles H. Dow and the Dow Theory. Appleton-Century-Crofts. New York. 1960. page 120.
-
[2] Sether, Laura. Dow Theory Unplugged. W&A Publishing. 2009. page 117.
-
[3] Dow, Charles H. Wall Street Journal. January 30, 1901
-
[3] Bishop, George. Charles H. Dow and the Dow Theory. Appleton-Century-Crofts. New York. 1960. page 120.
-
[3] Sether, Laura. Dow Theory Unplugged. W&A Publishing. 2009. page 199.
-
[4] Bishop, George. Charles H. Dow and the Dow Theory. Appleton-Century-Crofts. New York. 1960. page 231.
Posted in 50% principle, Charles Dow, Charles H. Dow, gold, gold bugs