Below are the valuation targets for Church & Dwight Co. (CHD) for the next 10 years. Continue reading
- Japan
- Market Indicator
- Price Momentum Indicators
- Richard Russell
- Silver
- Speed Resistance Lines
- U.S. Dividend Watch List

Below are the valuation targets for Church & Dwight Co. (CHD) for the next 10 years. Continue reading
Below is the annual 52-week low for Montana Power (MTP) from 1958 to 1968. We’ve also included the 3-month Treasury Bill as a comparison to show how utility stocks perform against the backdrop of rising interest rates.
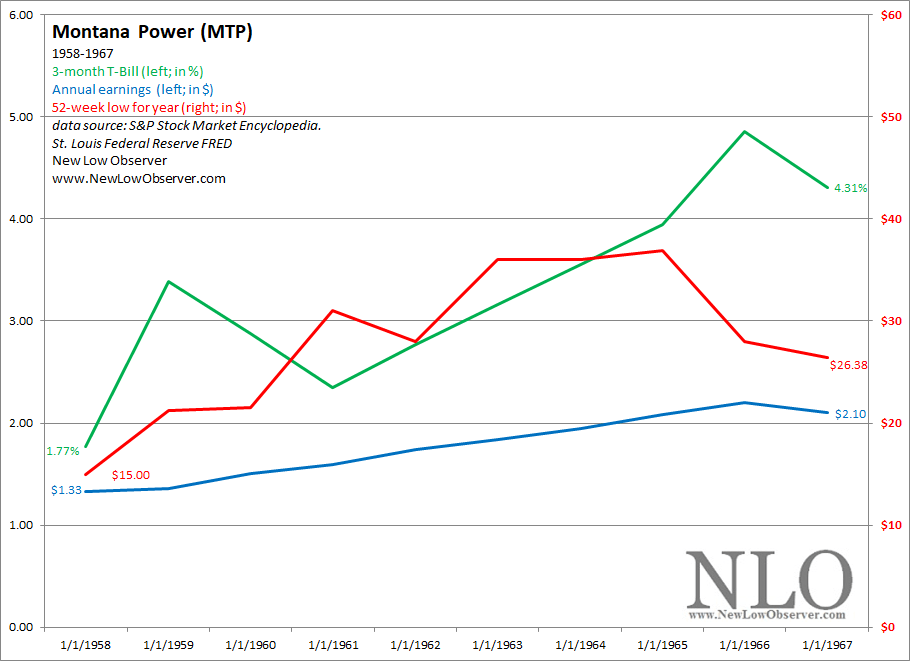
In this example, the 3-month Treasury Bill increased from 1.77% to 4.31%. Meanwhile, Montana Power (MTP) had a 52-week low range from $15.00 to $26.38.
Posted in 1958-1968, Chart of the Day, interest rates, Montana Power
Below is the annual 52-week low for Consolidated Edison (ED) from 1958 to 1967. We’ve also included the 3-month Treasury Bill as a comparison to show how utility stocks perform against the backdrop of rising interest rates.
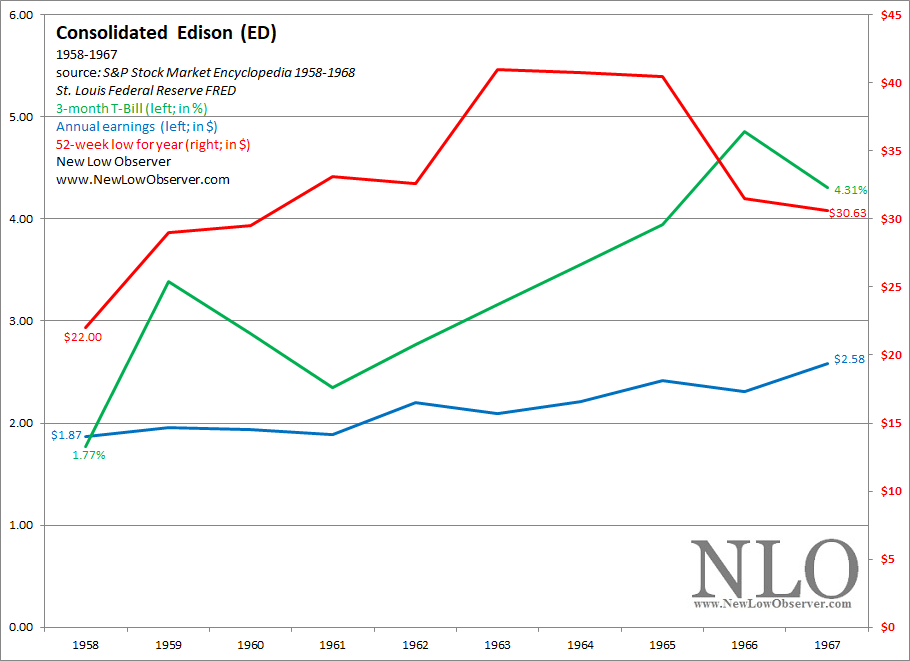
In this example, the 3-month Treasury Bill increased from 1.77% to 4.31%. Meanwhile, Consolidated Edison (ED) had a 52-week low range from $22.00 to $30.63.
Below is the annual 52-week low for Florida Power Corp. from 1958 to 1968. We’ve also included the Effective Fed Funds Rate as a comparison to show how utility stocks perform against the backdrop of rising interest rates.
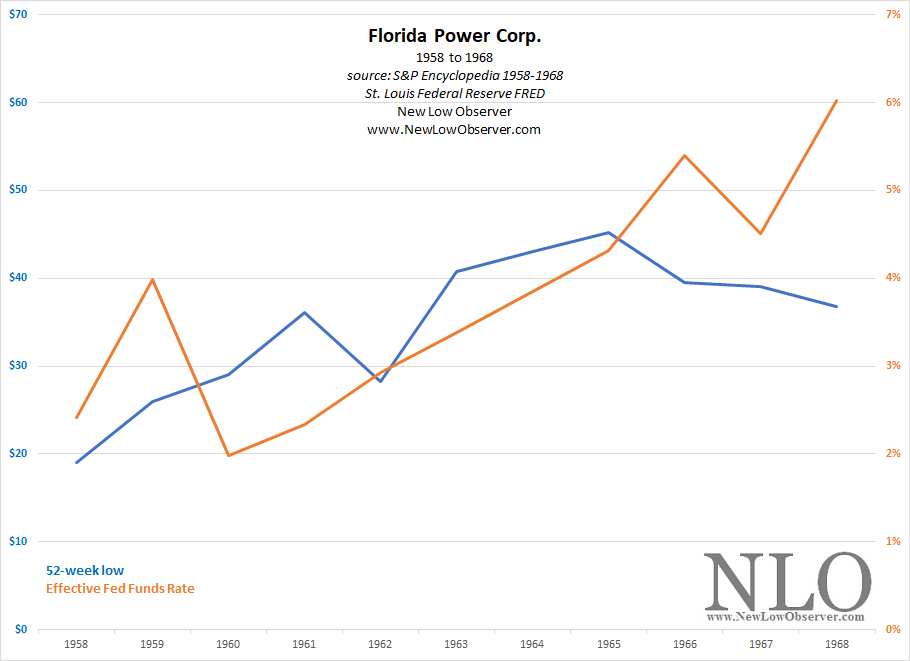
In this example, the Effective Fed Funds Rate increased from 2.42% to 6.02%. Meanwhile, Florida Power Corp. had a 52-week low range from $19 to $36.75.
Posted in 1958-1968, Chart of the Day, interest rates
The following are the established Bitcoin cycles since 2010 which are instrumental in our forecasting of the market price for Bitcoin going forward.
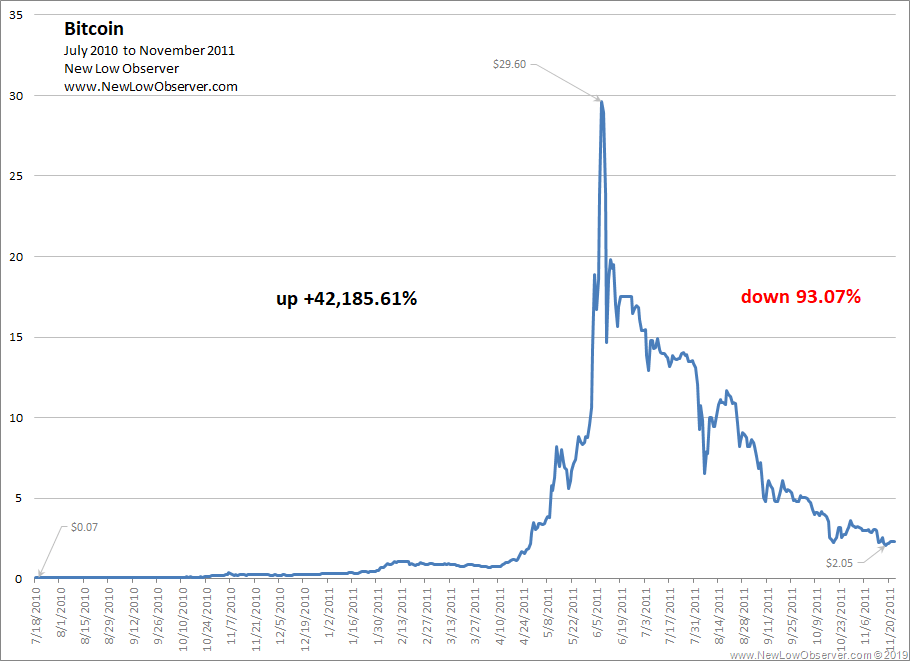
In the period from July 2010 to November 2011, Bitcoin increased +42,185.61% and decreased from the peak -93.07%.
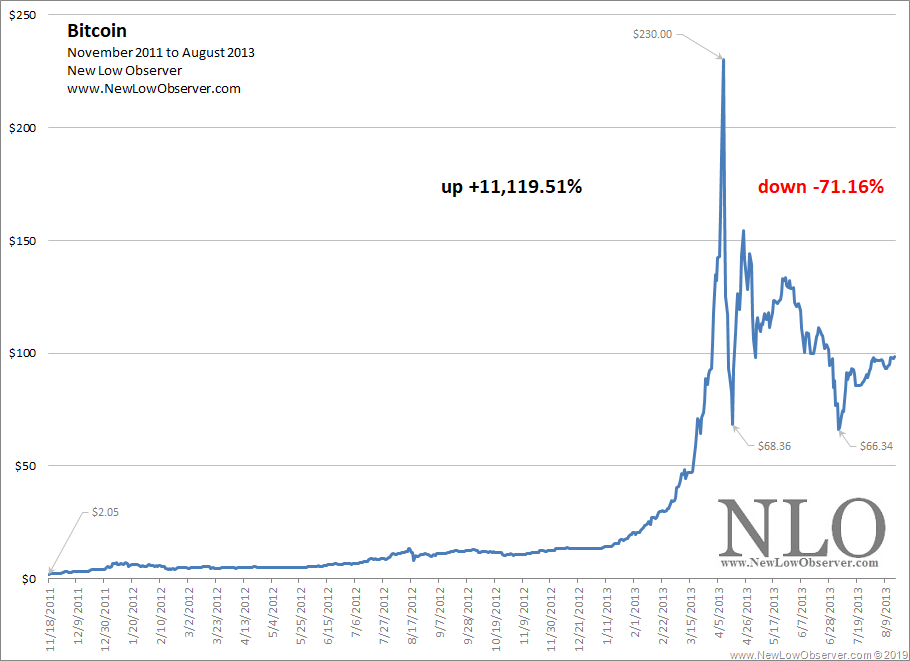
In the period from November 2011 to August 2013, Bitcoin increased +11,119.51% and decreased from the peak -71.16%.

In the period from April 2013 to October 2014, Bitcoin increased +1,629.35% and decreased from the peak -84.54%.
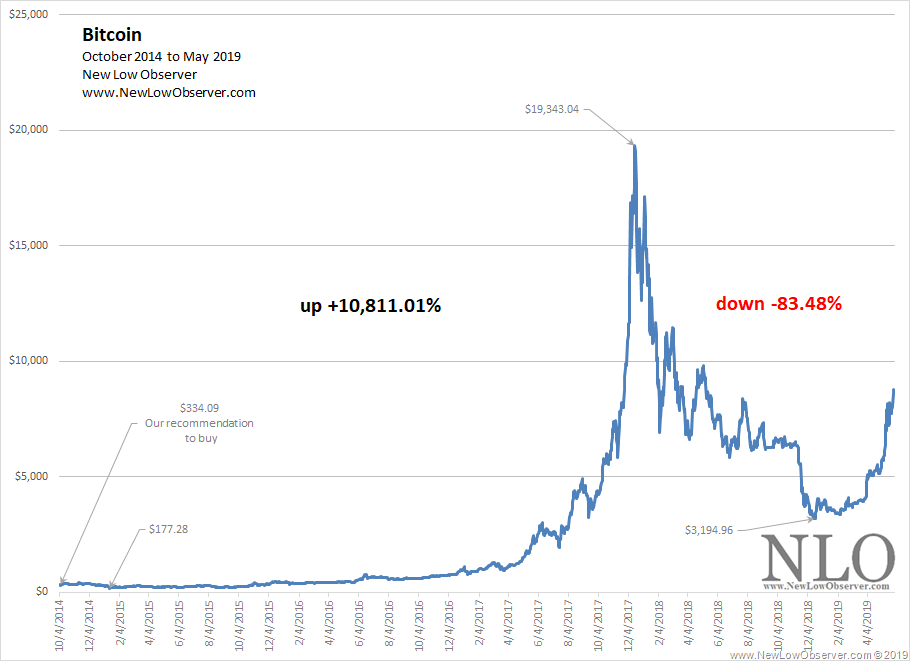
In the period from October 2014 to May 2019, Bitcoin increased +10,811.01% and decreased from the peak -83.48%. Our October 7, 2014 recommendation of Bitcoin at $334.09 found here.
Posted in Bitcoin, cycle analysis, Cyclical Trends, Market cycles
On January 17, 2018, we concluded our analysis with the following remarks:
“Anyone willing to participate in Bitcoin should be willing to accept that the price could easily decline –70%, as has been the average of all previous Bitcoin busts (found here). Anyone who participates in anything other than Bitcoin should expect a minimum –90% to –99% decline if, at the same time, Bitcoin declines –70% or more.”
From the peak in the price of Bitcoin at $19,343.04, the decline in Bitcoin that followed was –83%. This falls in alignment with our longstanding view that a drop of –70% is the average decline after a parabolic peak. In addition, the decline in Ethereum was –93%, confirming our work that a drop of –90% or more was possible.
As Bitcoin has increased from the low (so far), we have updated our upside and downside targets below.
Below is the annual 52-week low for Dome Mines (DM) from 1960 to 1968. We’ve also included the Effective Fed Funds Rate as a comparison to show how gold mining stocks perform against the backdrop of rising interest rates.
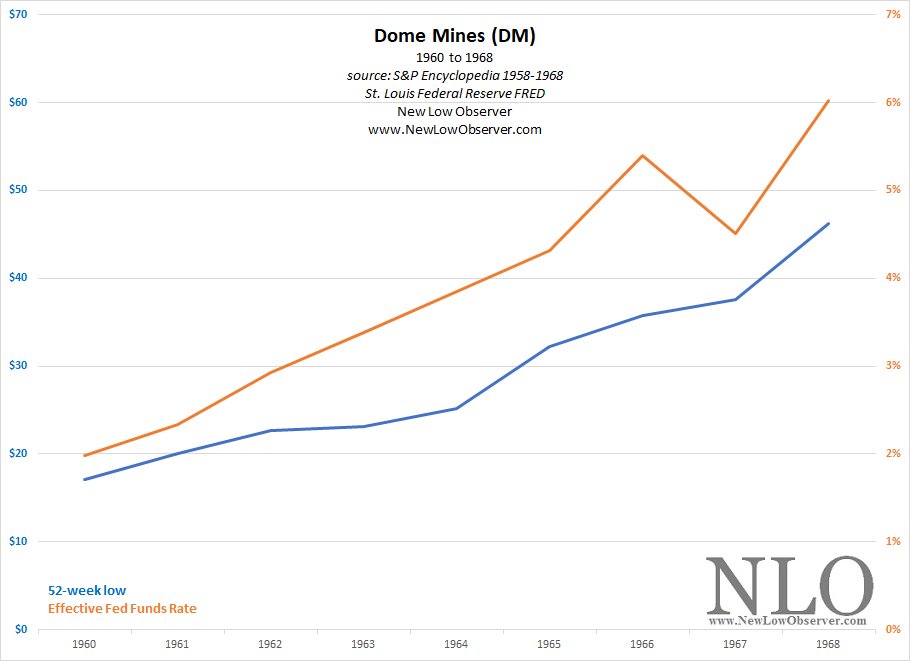
In this example, the Effective Fed Funds Rate increased from 1.98% to 6.02%. Meanwhile, Dome Mines (DM) had a 52-week low range from $17.12 to $46.25.
Posted in 1958-1968, Chart of the Day, Dome Mines, gold, interest rates
Below are the valuation targets for Marsh & McLennan Companies Inc. (MMC) for the next 10 years. Continue reading
Below is the annual 52-week low for American Electric Power (AEP) from 1958 to 1968. We’ve also included the Effective Fed Funds Rate as a comparison to show how utility stocks perform against the backdrop of rising interest rates.
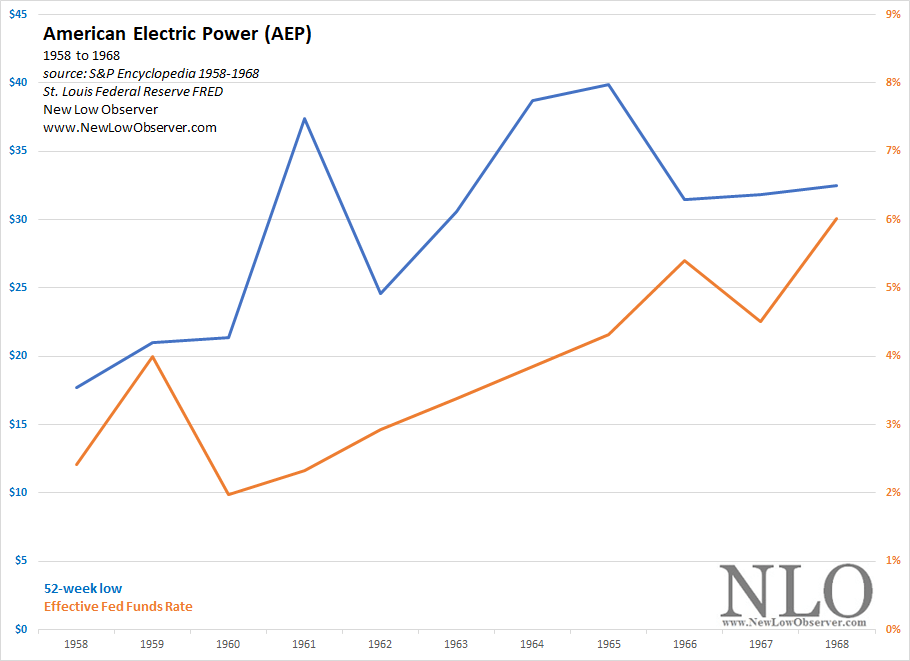
In this example, the Effective Fed Funds Rate increased from 2.42% to 6.02%. Meanwhile, American Electric Power (AEP) had a 52-week low range from $17.75 to $32.50.
Posted in 1958-1968, AEP, Chart of the Day, interest rates
Below is the annual 52-week low for Campbell Red Lake Mines (CRK) from 1960 to 1968. We’ve also included the Effective Fed Funds Rate as a comparison to show how gold mining stocks perform against the backdrop of rising interest rates.

In this example, the Effective Fed Funds Rate increased from 1.98% to 6.02%. Meanwhile, Campbell Red Lake Mines (CRK) had a 52-week low range from $9.63 to $24.00.
Previous Year Performance Review
In our ongoing review of the NLO Dividend Watch List, we have taken the top five stocks on our list from May 25, 2018 and have checked the performance one year later. The top five companies on that list can be seen in the table below.
| Symbol | Name | 2015 Price | 2016 Price | % change |
| ABM | ABM Industries | 29.23 | 37.10 | 26.9% |
| SAFM | Sanderson Farms, Inc. | 100.96 | 149.00 | 47.6% |
| CASY | Caseys General Stores | 96.25 | 133.28 | 38.5% |
| MDP | Meredith Corp. | 48.20 | 54.71 | 13.5% |
| ES | Eversource Energy | 56.26 | 74.88 | 33.1% |
| Average | 31.9% | |||
| DJI | Dow Jones Industrial | 24,753.09 | 25,585.69 | 3.4% |
| SPX | S&P 500 | 2,721.33 | 2,826.06 | 3.8% |
Top five companies did exceptionally well with an average gain of 31.9% compared to the index which gained 3.4%. Best performer of the five was Sanderson Farms (SAFM) which piqued our interest a year ago. It's interesting to note that a stock could gained 48% while earning collapsed. At the time of trading, Sanderson earned $13.47 per share and analysts expected the company to earn $9.18 a year later.
Another company we told our readers to explore is ABM Industries (ABM) which gained 27% in one year. Our team did research the stock and took position in October.
U.S. Dividend Watch List: May 24, 2019
What a week that was. The market opened the week strong but fell off the cliff because of the trade tension. Could this pull back turn into an opportunity or is this a beginning of protracted decline? Only time will tell and we will utilize Dow Theory to help guide us. Below is the watch list we'll use to search for opportunities. Continue reading
Posted in Dividend Achiever Watch List, Dividend Achievers, Dividend Watch List
Tagged members
The dividend payout ratio for companies that have a history of consecutive dividend increases provides counterintuitive results.
As we’ve highlighted in Procter & Gamble and Helmerich & Payne, high payout ratios can be found to result in higher investment returns. This is in stark contrast to the view that buying a stock with a low payout ratio would garner better returns.
Below, we outline the dividend payout ratio data for 3M Co. (MMM) as provided by Value Line Investment Survey from 1982 to 2019. The data should be compelling in highlighting the point that, at least in the past, buying a stock with a high relative dividend payout ratio could boost investment returns.
1982 to 2019 Payout Ratio
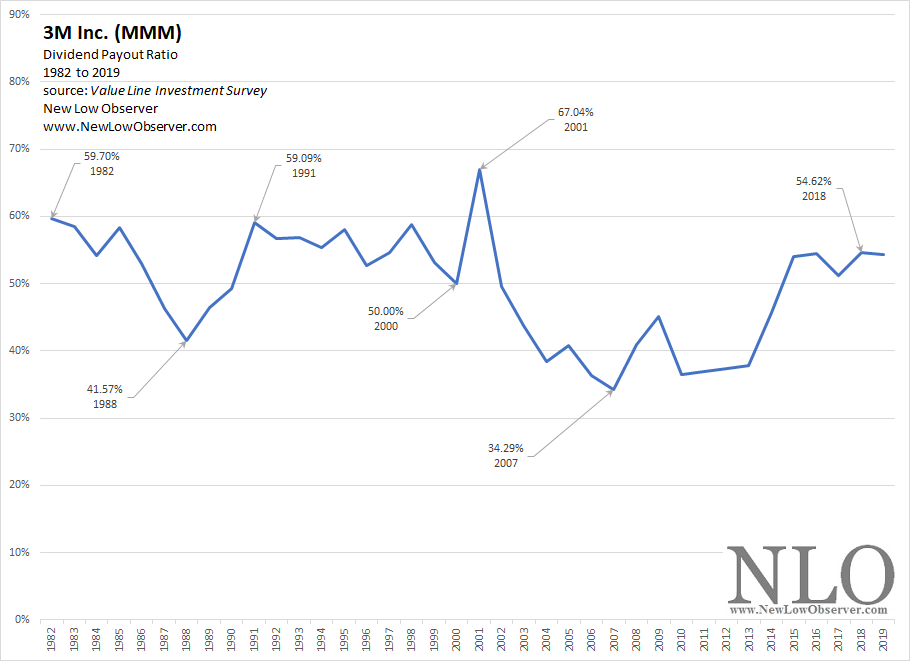
Our review of the data from the chart above will compare the price performance of 3M Co. (MMM) had an individual bought the stock at the lowest closing price for the given year indicated. In this case, the lowest closing price in 1982, 1988, 1991, 2000, 2001, 2007, and 2018.
Half and Full Cycle Data
There are two perspectives that we consider when looking at the data:
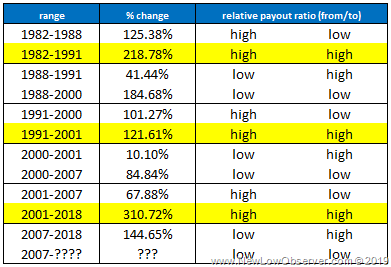
Within the data that we have selected, we only used the lowest closing price for the given year indicated. This allows for the most conservative assessment of performance which is a better guide for future expectations. While it is is unlikely that an investor could buy the exact low, it is equally as improbable that an investor could sell at an annual high (consistently).
Cycle Returns
In general, what can be seen in the table above is that in each case, the full cycle performance (high to high & low to low) of the stock price exceeded the half cycle performance (high to low & low to high).
Within the full cycle, the average gain in the full cycle high payout ratio period (+217.03%) exceeded the average gain from the full cycle low payout ratio period (+134.76%).
We also see that the half cycle performance of 3M Co., from high-to-low payout ratio and the low-to-high payout ratio, shows the high-to-low payout ratio period averaged gains of +98.17% which is contrasted to the low-to-high payout ratio average gains of +65.39%.
Conclusion
Counterintuitive as it may seem, considering a stock with a high dividend payout ratio might be a significant leading indication of the best time to buy a stock. However, our work relies heavily on several improbable elements:
All of these elements have been found in quite a few of the stocks that we have run the same payout ratio numbers on in the past. However, we always operate on the assumption that these rules will be violated going forward.
Payout Ratio Studies:
Posted in MMM, Payout Ratio Studies
In the Review and Outlook section of the Wall Street Journal dated February 27, 1902, Charles H. Dow said the following of labor and unemployment and their impact on prices:
“Periods of depression in business and in prices are invariably preceded by periods of good business and advance in prices. At such times, which usually last for several years, there is a gradual increase in the employment of labor until at the high point abundance of work, large production, large profits and high prices go together.
“It is equally certain that periods of depression begin with over trading, over production, over confidence and general excess in all directions. Upon this condition of affairs comes some sudden shock. It may be an important failure; it may be some great catastrophe or national event; it is something which arrests attention and makes people stop and think.
“They see that they are extended, and begin to restrict operations in whatever line of business they may be in. Lenders of money restrict credits, merchants restrict purchases, creditors urge payments, and, as a result of this shrinkage, the demand for labor lessens a little in each case, but enough to make a large aggregate. This begins to be felt in reduced consumption, and this is the first turn of the wheel which brings about general contraction.
“It is evident, therefore, that the bearing of the employment of labor upon prices of securities is only that restricted employment is one of a number of causes operating to produce smaller profits; hence lower prices.
As showing how closely the demand for labor follows the lines of expansion and contraction, which find their ultimate expression in the prices of securities (Sether, Laura. Dow Theory Unplugged: Charles Dows Original Editorials & Their Relevance Today. W & A Publishing, 2009. page 83.).”
The distinction of Dow’s theory on unemployment and labor is that it is based on a rationale of the active participants in the economy which reverberates throughout the economy generating cycles.
Stock prices follow the prospects affecting unemployment and not the reverse. However, the full scale reporting of unemployment data by government agencies lags that of stock prices. This causes a feedback loop in the period when the primary trend of the economy is at a reversal stage. The magnitude of declines in employment seem large in relation to the prior increase especially relative to the speed with which they occur as highlighted by Dow in the following August 8, 1901 commentary:
“If the general theory of swings is correct in the assumption that the top of the 'boom' has been seen, declines will average larger than rallies for some time to come (Sether, Laura. Dow Theory Unplugged: Charles Dows Original Editorials & Their Relevance Today. W & A Publishing, 2009. page 334.)”
The question of when and if a reversal is due is an important question as Dow makes clear in the following commentary on July 26, 1899:
“Reports from all directions are that business is active, labor is well employed and business men are making money. Such a condition has already brought about high prices in every department of trade.
"The question is now whether Wall Street has discounted this condition in full, or has it still more to discount? (Sether, Laura. Dow Theory Unplugged: Charles Dows Original Editorials & Their Relevance Today. W & A Publishing, 2009. page 67.)"
Consideration of Dow’s Theory has been the basis of our previous work on the unemployment rate which bears reviewing.
Stage 1: Recognizing the Change
On August 21, 2009, we said the following:
“Based on the combination of the Dow Theory confirmation of July 23, 2009 and the IPI [Industrial Production Index] turning up from the June low, I will have to guess that the National Bureau of Economic Research (NBER) is going to proclaim June 2009 as the official end to the recession. The end to this recession will be lackluster and questioned from all corners.”
Throughout the period from August 21, 2009 to the present, economists and analysts have questioned the legitimacy of the growth of the U.S. economy and based their opinion primarily on the rate of growth as an indication of the weakness or sustainability of the rising trend. Below is an excerpt from the Congressional Budget Office dated November 24, 2012:

Also a part of our August 21, 2009 commentary we said:
“Additionally, the stock market will only follow the pattern of a cyclical bull market (bear market rally) within a secular (long term) bear market. I doubt that the general public will agree that the recession is over since jobs will not be as plentiful as the past.”
Not surprisingly, many news outlets seized on the idea that anemic job growth was a reflection of poor policy action as highlighted in the following Washington Post article dated October 23 ,2012.

The first thing that stands out about Charles H. Dow’s commentary of employment and unemployment is that there is no reference to government intervention as the source of recovery (or contraction). Instead, active participants with skin in the game are the ones who, based on the level of prices, decide when to commit to hiring and firing.
The second observation is that even if we were lucky in our call that the National Bureau of Economic Research would say that the recession ended in June 2009 (the September 2010 announcement here), Dow’s Theory points to why we would say that the recovery would be “lackluster”, “questioned”, and that jobs wouldn’t be as plentiful in the past. Dow referenced the “gradual” increase for a boom and the “sudden” nature of busts.
With this in mind, it bears noting that if a recovery is actually in place (at the time), it will be slow and that if it is slow it will take a lot of time for the realization and acceptance of the change in conditions which highlights the importance of the famous quote by Charles Mackay, author of Extraordinary Popular Delusions and the Madness of Crowds:
“Men, it has been well said, think in herds; it will be seen that they go mad in herds, while they only recover their senses slowly, one by one (Goodreads. Charles Mackay; quotes. accessed April 11, 2019. link.).”
Stage 2: After the Turn, Assessing the Conditions
On July 26, 2013, we said the following:
“Applying Dow Theory’s 50% principle suggests that the best we could expect for the unemployment rate, on the downside, is for 6.9%. It is important to understand that the 10% and 3.8% unemployment rates are undesirable scenarios. The 10% unemployment rate is in the depths of a “recession” and the 3.8% unemployment rate at the height of a overextend economic boom.”
Many economists critical of the presences of an economic recovery would often say something like, “…there is no recovery, just look at the unemployment rate, it is nowhere near the prior low of 4%…” Again, the push for the belief that the recovery is finally in place once it achieves the prior low levels ignores the process and change in the economy that is necessary as outlined by Dow.
Other critics are concerned that the reported data on the declining unemployment rate doesn’t reflect “…all persons marginally attached to the labor force, plus total employed part time for economic reasons, as a percent of the civilian labor force." This set of unemployment data is commonly known as the U-6 rate which is contrasted by the more widely quoted data set of the U-3 rate. What’s the difference?
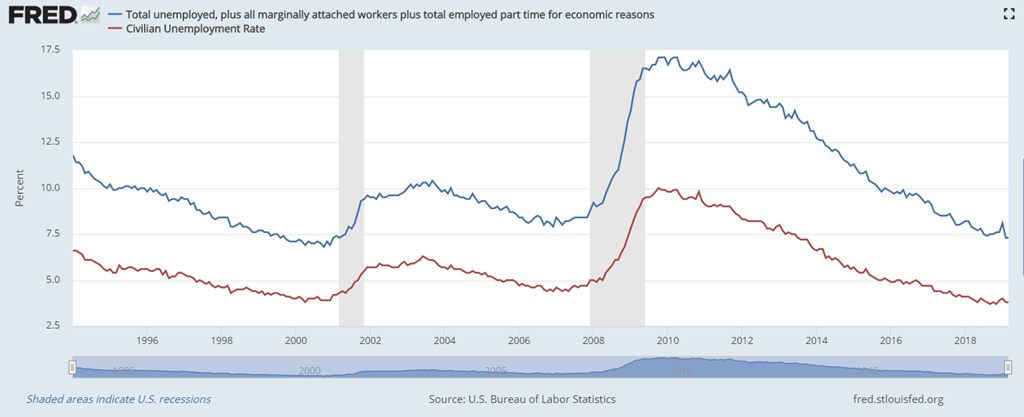
The chart above shows the U-6 rate (Total unemployed, plus all marginally attached workers plus total employed part time for economic reason) in blue and the U-3 rate (Civilian Unemployment Rate) in red from 1994 to January 2018. What should stand out is that there is a huge divide between the U-6 rate and the U-3 rate.
What some commentators get wrong when they look at these numbers is the absolute levels, which should never be done. Below, we have generated the appropriate way to determine how to look at the data from these two data sets when making a comparison.
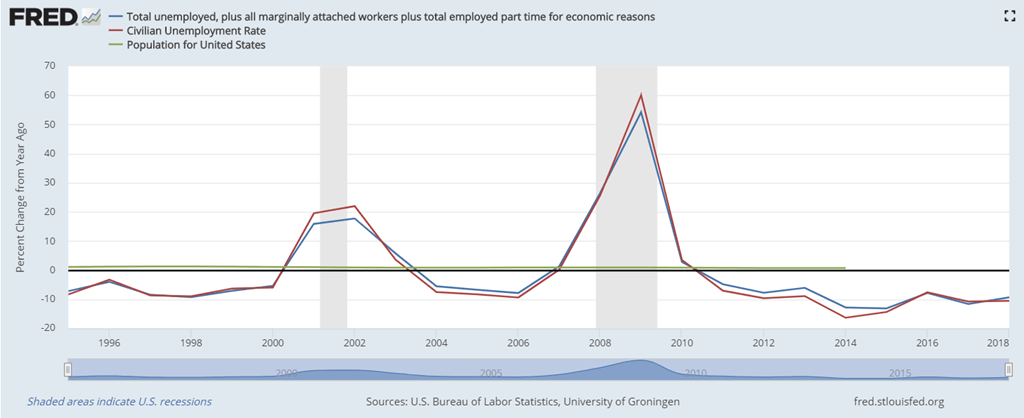
The chart above shows the annual Year-over-Year Percentage Change in the U-6 rate, U-3 rate and U.S. population since 1995. Using this method of comparison, a reviewer of the data can draw meaningful conclusions that are accurate (minus the absences of population data from 2015 to 2019).
By all accounts, U-6 and U-3 rates have improved at the same rate since the 2009 peak, with the U-6 data showing a marginally better rate of change than the U-3 rate, all this while the population of the U.S. has increased slightly more than 0.75% per year.
Critics of the use of U-3 data, when asked to look at the data from this perspective, often become defensive and attempt to revert to the “U-6 rate is better than the U-3 rate” argument. Unfortunately, the data as represented in the Year-over-Year Percentage Change is more definitive and appropriate when attempting to determine what has changed in the data since 2009.
Stage 3: The Primary Movement Revealed
In attempting to assess markets, Charles H. Dow’s April 27, 1899 commentary in the Wall Street Journal can be applied to any market where “price” is updated on a regular basis:
"The point of importance for those who deal in industrial stocks is whether the capitalization of the companies into which they propose to buy is moderate or excessive, when compared with the aggregate earnings of the various concerns forming the combination in a period of depression. It is probable that consolidated companies will be able to earn as much in the next period of low prices as the companies forming the combine were able to earn in the last one; hence the very foundation of investments in industrials should be knowledge of what these companies earned, say in 1893 to 1896, making, perhaps, reasonable allowances for economies under consolidation. Where the earnings so shown would have provided dividends for industrials now active, the fact must be regarded as a very strong point in favor of those stocks (George W. Bishop Jr., Charles H. Dow: Economist, Dow-Jones & Company,Princeton, 1967, page 11.)"
As we pointed out in July 2013, based on Dow’s claim, the 3.8% unemployment was the “period of depression” by which we measured the extent that the market could go before being over-extended. The last period that was lower than the 3.8% low was May 1969. We cannot account for this prospect at least until the 3.8% level is achieved. However, why would we even considered the 3.8% level when the previous low in unemployment was May 2007 at 4.4%?
In Dow’s reference to primary movements, he says the following in the Wall Street Journal on July 20, 1901:
“It is impossible to tell in advance the length of any primary movement, but the further it goes, the greater the reaction when it comes, hence the more certainty of being able to trade successfully on that reaction.”
From the May 2007 low in unemployment at 4.4%, the unemployment rate increased to as high as 10% by October 2009, which had not seen similar levels since June 1983. Dow’s perspective suggests that the reaction (decline) should be as dramatic as the preceding extreme. In this case, the last low after a 10% unemployment rate was the low of April 2000 at 3.8%.
The primary trend of any market is not revealed until many years have passed. This is unfortunate because by default it eliminates from the collective memory of the market those who were lucky enough to correctly assess (guess) the conditions, either in general or precisely.
Is Unemployment Really Low?
There are many concerns of whether the unemployment rate is actually as low as it is claimed to be. Again, as previously mentioned, there is a distinct difference between the U-6 and U-3 data on unemployment.
Without debate, the U-6 data has declined equally as much as the U-3 data from 2010 to 2019. However, there is the segment of the population which, by no fault of their own, cannot be participants in the labor market. As Described by Charles H. Dow in a December 11, 1901:
“One of the surest marks of the coming of bad times is the falling off in the employment of labor. As labor does not voluntarily deprive itself of employment, the cause of lack of employment must be found in inability to borrow money on favorable terms by those who depend on borrowed money to carry on lines of business in which labor is employed.”
The claim that “…labor does not voluntarily deprive itself of employment…” is reflected in a majority of the nonparticipation rate as outlined by the Brookings Institution’s paper on the topic, saying:
“After excluding caregivers (approximately 40 percent of nonparticipants), men and women report the same reasons—and at similar rates—for not participating in the labor force. Almost 30 percent of nonparticipants report being ill or disabled, while 8 percent are students, and 5 percent are early retirees (Diane Whitmore Schanzenbach, Lauren Bauer, Ryan Nunn, and Megan Mumford. “Who is Out of the Labor Force?”. August 17, 2017. link. accessed April 29, 2019.)”
A contrasting argument to the unemployment data being exceptionally low is that it isn’t as good as it is made out to be due to voluntarily leaving the marketplace for jobs. Some have cited the fact that since 2000, the labor participation rate, as reflected by employment relative to working age population, has been in considerable decline with a dramatic distance between the prior peak and the current level (Sherman, Erik. “Sure, Unemployment Went Down - Because More People Left The Workforce”. Forbes. May 5, 2018. accessed April 29, 2019. link.)
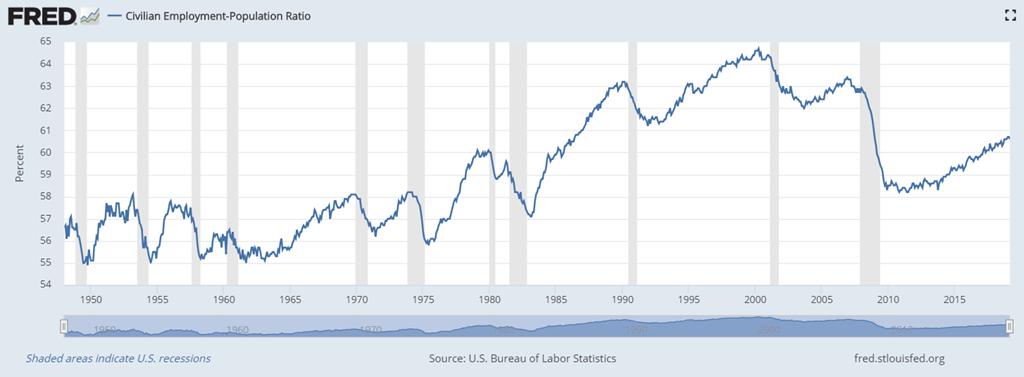
As indicated in the data above from the Brookings Institution, 30% of non-participants in the workforces were due to illness or disability while another 40% were caregivers. This confirms Dow’s claim that few are out of the workforce on a voluntary basis. Additionally, that small minority of individuals who voluntarily take themselves out of the work force (not related to health issues) are generally in a supportive environment that allows for such changes in their life.
Where does the work of Charles H. Dow leave us on the topic of employment and unemployment? In spite of technological changes and the dramatic shift from labor intensive and industrial jobs to service related industries over the last 120 years, the expectations from employers and employees remain the same. Being able to recognize these inherent needs allows for a reasonable model for what to expect when attempting to forecast the trend of employment and unemployment.
See Also:
Posted in Dow's Economic Indicator, Unemployment
On May 22, 2019, Citi analyst Itay Michaeli suggested that Tesla Motors (TSLA) could decline as low at $36.

Meanwhile, on May 21, 2019, Morgan Stanley has put a decline to $10 on the stock price into play.

Our work of September 8, 2018 laid bare the technical attributes that were likely outcomes for Tesla Motors. The upside of using technical indications is that it leaves out the narrative and only includes precedent, both positive and negative.
In that 2018 posting, we offered two types of technical review, Speed Resistance Lines (SRL) as outlined by Edson Gould and “Three Peaks and a Domed Housed (3PDh) as presented by George Lindsay.
Already, Tesla has achieved the $200.17 price target that was set by the SRL analysis. We’re curious to see if the $76 target is achieve as outlined in the 3PDh analysis.
As a reiteration of the more conservative downside analysis from September 8, 2018:
“The extreme downside target of $128.33 would be the last stop before a retest of the $100 level. In all the prior history of stocks that we’ve tracked using the SRL, 80% eventually go back to the extreme downside target before the bottom drops out or the stock attains new highs. Based on this observation, we’re highly confident that given the nature of Tesla, declining to the $150 to $127 level is a lock.”
Posted in 3PDh, Edson Gould, George Lindsay, SRL, TSLA
Below are the valuation targets for 3M Company (MMM) for the next 10 years. Continue reading