Below is the Qualcomm Inc. from 2001 to 2023 applying the Price Momentum Indicator.

- Japan
- Market Indicator
- Price Momentum Indicators
- Richard Russell
- Silver
- Speed Resistance Lines
- U.S. Dividend Watch List

Below is the Qualcomm Inc. from 2001 to 2023 applying the Price Momentum Indicator.
On April 16, 2019, Qualcomm (QCOM) and Apple (AAPL) agreed to settle their ongoing disputes. The outcome was significant for Qualcomm.
As Charles H. Dow, co-founder of the Wall Street Journal has said:
“The one sure thing in speculation is that values determine prices in the long run. Manipulation is effective temporarily, but the investor establishes price in the end. The object of all speculation is to foresee coming changes in values. Whoever knows that the value of a stock has run ahead of price and is likely to be sustained can buy that stock with confidence that as its value is recognized by investors, the price will rise (Dow, Charles H. Review and Outlook. Wall Street Journal. February 25, 1902.)."
For many years, the market price of QCOM appeared to be reflecting the neglect of speculators. In the meantime, investors slowly and selectively accumulated shares of QCOM in anticipation of the high risk proposition that QCOM would prevail against AAPL.
As seen in our chart below, QCOM has found its share price at the undervalued level several times since 2016. The September 13, 2018 announcement of the accelerated share buyback seems as though it was at an elevated prices. However, as our updated 10-Year price target indicates, the prospects for QCOM are far in excess of current levels.

In many respects, the price of Qualcomm has been at the mercy of Apple and their ongoing lawsuits. However, Charles H. Dow has the following to say of such conditions:
“The manipulator is all-powerful for a time. He can mark prices up or down. He can mislead investors inducing them to buy when he wishes to sell, and to sell, when he wishes to buy; but manipulation in a stock cannot be permanent, and, in the end, the investor learns the approximate truth. His decision to keep his stock or to sell it then makes a price independent of speculation and, in a large sense, indicative of true value (Dow, Charles H. Review and Outlook. Wall Street Journal. October 18, 1901.).”
We believe that Apple has played into the hands of value investors and we’re thankful for it. Now the test becomes whether Qualcomm will realize the overvalued targets that we have set for the stock, as seen here.
Posted in Charles H. Dow, Dow's Value Theory, qcom, Qualcomm
Below are the valuation targets for Qualcomm (QCOM) for the next 10 years. Continue reading
Posted in 10-year Targets, Altimeter, qcom
On January 29, 2015, Qualcomm (QCOM) announced that a “…key customer passed on new chip…” On the news, QCOM stock fell as much as –12%.
Below are the Nasdaq 100 companies that are within 10% of their respective 52-week lows. Stocks that appear on our watch lists are not recommendations to buy. Instead, they are the starting point for doing your research and determining the best company to buy. Ideally, a stock that is purchased from this list is done after a considerable decline in the price and rigorous due diligence.
| symbol | Name | Price | P/E | EPS | Yield | P/B | % from Low |
| SYMC | Symantec Corporation | 14.57 | 9.28 | 1.57 | - | 2.06 | 2.17% |
| DELL | Dell Inc. | 12.12 | 6.92 | 1.75 | - | 2.28 | 2.71% |
| CHRW | CH Robinson Worldwide Inc. | 57.92 | 21.6 | 2.68 | 2.3 | 7.51 | 3.65% |
| EA | Electronic Arts Inc. | 13.47 | 58.57 | 0.23 | - | 1.75 | 4.74% |
| INFY | Infosys Ltd. | 43.62 | 14.54 | 3 | 1.3 | 3.81 | 5.36% |
| NVDA | NVIDIA Corporation | 12.12 | 14.8 | 0.82 | - | 1.72 | 5.67% |
| GMCR | Green Mountain Coffee Roasters | 23.13 | 11.11 | 2.08 | - | 1.76 | 6.25% |
| EXPD | Expeditors Int'l of WA | 39.36 | 22.75 | 1.73 | 1.4 | 3.95 | 6.49% |
| CTRP | Ctrip.com Int'l | 18.66 | 17.86 | 1.04 | 0 | 2.38 | 6.63% |
| SPLS | Staples, Inc. | 12.86 | 9.23 | 1.39 | 3.4 | 1.24 | 7.71% |
| LRCX | Lam Research | 37.62 | 16.65 | 2.26 | - | 1.72 | 8.07% |
| NFLX | Netflix, Inc. | 65.64 | 22.22 | 2.95 | - | 5.41 | 8.14% |
| WYNN | Wynn Resorts Ltd. | 104.21 | 22.1 | 4.72 | 1.9 | 46.53 | 8.76% |
| NTAP | NetApp, Inc. | 30.33 | 19.2 | 1.58 | - | 2.65 | 9.14% |
| MCHP | Microchip Technology Inc. | 32.01 | 19.4 | 1.65 | 4.4 | 3.08 | 9.25% |
| VOD | Vodafone Group | 26.58 | 12.6 | 2.11 | 7.5 | 1.1 | 9.34% |
| MRVL | Marvell Technology | 12.28 | 13.15 | 0.93 | 2 | 1.4 | 9.35% |
| ORCL | Oracle Corporation | 27.16 | 14.23 | 1.91 | 0.9 | 3.16 | 9.87% |
| CTSH | Cognizant | 58.85 | 19.81 | 2.97 | - | 4.14 | 9.92% |
Watch List Summary
Of interest on our watch list is NVIDIA (NVDA). According to Yahoo!Finance, “NVIDIA Corporation provides graphics chips for use in smartphones, personal computers (PC), tablets, and professional workstations markets worldwide.” As we’ve described in the past, we have a strong interest in chip sector stocks and believe that the long-term prospects for companies in the chip industry is very appealing.
NVDA first appeared on our watch list on June 12, 2010. At that time, NVDA was trading at $11.61. By February 18, 2011, NVDA was trading as high as $25.68 which was a gain of over +120%. We’re not certain that NVDA’s decline has ended. According to Edson Gould’s Speed Resistance Lines, NVDA has already declined below the conservative downside target of $17.87 based on the February 2011 high. The persistence of the current decline suggests that the stock could decline to the extreme downside target of $8.67. We’re doing everything we can to hold off buying this stock at the current time.

Watch List Performance Review
The following is a performance review of the top five Nasdaq 100 Watch List from June 4, 2010. Keep in mind that this is a 2 year performance review instead of a 1 year review.
|
Symbol
|
Name | 2010 | 2012 | % change |
| GILD | Gilead Sciences, Inc. | $34.71 | 49.21 | 41.77% |
| SYMC | Symantec Corporation | $13.92 | 14.43 | 3.66% |
| ERTS | Electronic Arts Inc. | $15.81 | 13.07 | -17.33% |
| APOL | Apollo Group, Inc. | $51.48 | 32.42 | -37.02% |
| QCOM | QUALCOMM | $35.30 | 55.85 | 58.22% |
| average | 9.86% | |||
| NDX | Nasdaq 100 | 1,832.04 | 2,478.13 | 35.27% |
As can you can see, the list of top five stocks significantly underperformed the Nasdaq 100 (NDX), mainly due to Apple Inc. (AAPL) having an outsized impact on the index. However, underneath the static 2-year performance data is a story to be told, which is the basis of our New Low investment strategy.
In the chart below, take note of the period around July 2011. At that time, Qualcomm had gains of +60%, Electronic Arts had gains of +55%, Symantec had gains of +42% and Gilead Sciences had gains of +21%. Only Apollo Group had losses to compare against the other stocks.

In the case of Symantec and Electronic Arts, they have come full circle after a 2-year period. This cycle is not unusual for most of the stocks that we track. Even when the stock does not approach the prior low of a watch list, many stocks attain a 52-week low after 2 to 2.5 years (as in the NVDA example above). Be on the lookout for stocks that have similar cycles like EA, SYMC and NVDA since their ability to replicated such moves adds to the prospect that they could pull a repeat performance.
Posted in apol, EA, electronic arts, GILD, gilead sciences, Nasdaq 100 Watch List, NVDA, Nvidia, qcom, Qualcomm, SYMC
At the end of that article, we came to a conclusion that AMAT was too rich for our blood and suggested QCOM as a better alternative. In addition, we offered a specific strategy on the purchase and how to allocate capital which panned out beautifully. On April 22, 2010 QCOM dropped like a rock after reporting earnings. With a recent dividend increase of 12% and a good entry point of $38, we took a position in QCOM.
For those that followed suit, they would be sitting on an 18% gain or 48% annualized gain. In addition to buying outright stock, we also incorporated an option strategy as a way to add extra cash. This strategy added 1.2% to our bottom line. In addition, QCOM paid 3 dividend payments during this time adding more to our bottom line.
Timeline:
1/30/10 - QCOM appeared on our watch list.
3/23/10 - Research Request on AMAT but we suggested QCOM.
4/22/10 - QCOM drop, possible entry point.
4/23/10 - we took position with option strategy.
7/16/10 - options expired, we sat on 3.5% loss.
9/30/10 - we have taken the 18% and go back to our drawing board, the watch list.
Watch List Summary
Performance Review
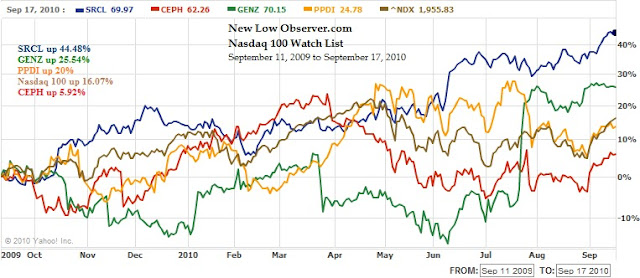 |
| *chart does not reflect dividend reinvestment for PPDI |
Nasdaq 100 Watch List
| Symbol | Name | Price | P/E | EPS | Yield | P/B | % from Low |
| PAYX | Paychex, Inc. | 25.95 | 19.67 | 1.32 | 4.80% | 6.67 | 5.27% |
| INTC | Intel Corporation | 18.81 | 11.26 | 1.67 | 3.40% | 2.3 | 6.87% |
| AMAT | Applied Materials, Inc. | 11.02 | 24.44 | 0.45 | 2.50% | 2.03 | 7.33% |
| YHOO | Yahoo! Inc. | 13.89 | 22.77 | 0.61 | N/A | 1.59 | 7.34% |
| MXIM | Maxim Integrated Products, Inc. | 16.91 | 41.86 | 0.4 | 5.00% | 2.15 | 7.91% |
| GILD | Gilead Sciences, Inc. | 34.56 | 10.47 | 3.3 | N/A | 4.58 | 8.93% |
| ATVI | Activision Blizzard, Inc | 10.82 | 41.94 | 0.26 | 1.30% | 1.21 | 8.96% |
| DELL | Dell Inc. | 12.45 | 15.74 | 0.79 | N/A | 3.92 | 9.80% |
| RIMM | Research In Motion Limited | 46.72 | 10.24 | 4.56 | N/A | 3.2 | 9.85% |
| AMGN | Amgen Inc. | 55.22 | 11.73 | 4.71 | N/A | 2.28 | 9.87% |
| DISH | DISH Network Corporation | 18.77 | 11.26 | 1.67 | N/A | N/A | 10.02% |
| CSCO | Cisco Systems, Inc. | 21.86 | 16.46 | 1.33 | N/A | 2.82 | 10.31% |
| XRAY | DENTSPLY International Inc. | 30.66 | 16.55 | 1.85 | 0.70% | 2.6 | 10.45% |
| MSFT | Microsoft Corporation | 25.22 | 12 | 2.1 | 2.10% | 4.76 | 10.95% |
| SPLS | Staples, Inc. | 19.49 | 17.26 | 1.13 | 1.80% | 2.2 | 11.69% |
| PDCO | Patterson Companies Inc. | 27.15 | 14.67 | 1.85 | 1.50% | 2.3 | 12.52% |
| SHLD | Sears Holdings Corporation | 66.83 | 27.38 | 2.44 | N/A | 0.9 | 12.87% |
| GOOG | Google Inc. | 490.15 | 21.29 | 23.03 | N/A | 3.77 | 13.03% |
| LIFE | Life Technologies Corporation | 46.51 | 29.91 | 1.56 | N/A | 1.97 | 13.16% |
| STX | Seagate Technology. | 11.16 | 3.55 | 3.14 | N/A | 1.95 | 13.41% |
| FLIR | FLIR Systems, Inc. | 27.24 | 18.52 | 1.47 | N/A | 3.25 | 13.50% |
| GRMN | Garmin Ltd. | 29.64 | 8.95 | 3.31 | 5.10% | 2.21 | 13.52% |
| TEVA | Teva Pharmaceutical Industries | 53.48 | 19 | 2.82 | 1.20% | 2.48 | 13.81% |
| FLEX | Flextronics International Ltd. | 5.55 | 15.72 | 0.35 | N/A | 2.26 | 14.20% |
| COST | Costco Wholesale Corporation | 61.29 | 21.93 | 2.8 | 1.30% | 2.43 | 14.75% |
| HSIC | Henry Schein, Inc. | 56.35 | 15.82 | 3.56 | N/A | 2.31 | 14.77% |
| CERN | Cerner Corporation | 79.18 | 31.31 | 2.53 | N/A | 3.83 | 14.85% |
| CELG | Celgene Corporation | 55.25 | 29.99 | 1.84 | N/A | 5.11 | 15.06% |
| CA | CA Inc. | 20.44 | 13.43 | 1.52 | 0.80% | 2.02 | 15.48% |
| ERTS | Electronic Arts Inc. | 16.26 | N/A | -1.06 | N/A | 1.96 | 15.63% |
| VRTX | Vertex Pharmaceuticals Incorpor | 36.25 | N/A | -3.53 | N/A | 9.01 | 16.00% |
| KLAC | KLA-Tencor Corporation | 31.05 | 25.31 | 1.23 | 3.30% | 2.32 | 16.34% |
| STLD | Steel Dynamics, Inc. | 15.01 | 15.73 | 0.95 | 2.00% | 1.58 | 16.45% |
| WCRX | Warner Chilcott plc | 22.75 | 11.2 | 2.03 | N/A | 2.82 | 16.55% |
| LOGI | Logitech International S.A. | 15.39 | 22.57 | 0.68 | N/A | 2.68 | 16.86% |
| CEPH | Cephalon, Inc. | 62.26 | 12.48 | 4.99 | N/A | 2.09 | 17.36% |
| URBN | Urban Outfitters, Inc. | 34.11 | 22.19 | 1.54 | N/A | 4.26 | 18.85% |
| FWLT | Foster Wheeler AG. | 24.19 | 10.8 | 2.24 | N/A | 3.46 | 18.99% |
| FISV | Fiserv, Inc. | 53.56 | 17.16 | 3.12 | N/A | 2.57 | 19.55% |
| JBHT | J.B. Hunt Transport Services, I | 35.26 | 26.73 | 1.32 | 1.40% | 7.56 | 19.73% |
| CTAS | Cintas Corporation | 27.71 | 19.64 | 1.41 | 1.70% | 1.67 | 19.96% |
Below are the Nasdaq 100 companies that are within 20% of their respective 52-week low. Stocks that appear on our watch lists are not recommendations to buy. Instead, they are the starting point for doing your research and determining the best company to buy. Ideally, a stock that is purchased from this list is done after a considerable decline in the price and considerable due diligence.
| Name | Price | P/E | EPS | Yield | P/B | Pct from Yr Low | |
| Gilead Sciences, Inc. (GILD) | $38.37 | 12.31 | 3.12 | 0.00% | 4.71 | 0.95% | |
| Apollo Group, Inc. (APOL) | $54.41 | 13.61 | 4.00 | 0.00% | 6.23 | 3.07% | |
| QUALCOMM (QCOM) | $36.50 | 19.47 | 1.88 | 2.10% | 2.90 | 3.60% | |
| Ryanair Holdings plc (RYAAY) | $24.60 | 0.00 | 0.00 | 0.00% | 0.00 | 3.89% | |
| Activision (ATVI) | $10.56 | 124.24 | 0.09 | 1.40% | 1.22 | 6.34% | |
| Yahoo! Inc. (YHOO) | $15.29 | 27.40 | 0.56 | 0.00% | 1.81 | 9.45% | |
| Genzyme (GENZ) | $51.77 | 125.66 | 0.41 | 0.00% | 1.84 | 9.94% | |
| Symantec (SYMC) | $15.62 | 40.57 | 0.39 | 0.00% | 3.02 | 11.82% | |
| Electronic Arts (ERTS) | $17.63 | 0.00 | 0.00 | 0.00% | 2.29 | 12.29% | |
| Cephalon, Inc. (CEPH) | $59.38 | 11.84 | 5.01 | 0.00% | 1.90 | 13.00% | |
| Logitech (LOGI) | $14.63 | 40.41 | 0.36 | 0.00% | 2.65 | 14.03% | |
| Staples (SPLS) | $21.66 | 21.17 | 1.02 | 1.60% | 2.35 | 15.71% | |
| Amgen Inc. (AMGN) | $54.46 | 11.56 | 4.71 | 0.00% | 2.37 | 17.22% | |
| RIMM (RIMM) | $64.92 | 0.00 | 0.00 | 0.00% | 0.00 | 19.56% | |
| Cintas (CTAS) | $25.54 | 23.87 | 1.07 | 1.80% | 1.61 | 19.91% |
Watch List Summary
| Company | Change from Last Week |
| Gilead Sciences, Inc. (GILD) | -3.49% |
| Apollo Group, Inc. (APOL) | -5.51% |
| QUALCOMM (QCOM) | -5.97% |
| Ryanair Holdings plc (RYAAY) | -14.47% |
| Activision (ATVI) | -4.92% |
| Yahoo! Inc. (YHOO) | -8.11% |
| Genzyme (GENZ) | -2.80% |
| Symantec (SYMC) | -7.36% |
In all, the Nasdaq 100 Watch List of last week lost -6.58% as compared to the Nasdaq 100 index which lost a total of -7.56%. As with our Dividend Achiever Watch List, the smaller losses and larger gains make the Watch Lists a good place to start investigating your next investment opportunities. Naturally, we expect that all investment decisions should be done with an eye for selectivity and a willingness to harbor a lot of patience.
| Symbol | Name | Price | P/E | EPS | Yield | P/B | % from low |
| GILD | Gilead | 39.71 | 12.74 | 3.12 | 0 | 4.86 | 0.40% |
| APOL | Apollo | 57.41 | 14.36 | 4 | 0 | 6.53 | 8.75% |
| QCOM | QUALCOMM | 38.68 | 20.63 | 1.88 | 2.00% | 3.09 | 9.08% |
| ATVI | Activision | 11.08 | 130.35 | 0.09 | 1.40% | 1.31 | 11.58% |
| GENZ | Genzyme | 53.22 | 129.17 | 0.41 | 0 | 1.91 | 13.02% |
| RYAAY | Ryanair | 28.16 | 0 | 0 | 0 | 0 | 13.46% |
| YHOO | Yahoo! Inc. | 16.53 | 29.62 | 0.56 | 0 | 1.93 | 18.84% |
| SYMC | Symantec | 16.77 | 43.56 | 0.39 | 0 | 3.13 | 20.04% |
Below are the Nasdaq 100 companies that are within 21% of the 52-week low.
| Symbol | Name | Price | P/E | EPS | Yield | P/B | % from Low |
| GILD | Gilead Sciences | 41.67 | 14.77 | 2.82 | 0 | 5.74 | 4.44% |
| QCOM | QUALCOMM | 38.25 | 30.7 | 1.25 | 1.90% | 3.08 | 7.87% |
| GENZ | Genzyme Corporation | 53.93 | 35 | 1.54 | 0 | 1.85 | 14.53% |
| ATVI | Activision Blizzard | 11.6 | 136.47 | 0.09 | 1.30% | 1.35 | 16.82% |
| RYAAY | Ryanair Holdings | 29.19 | N/A | - | 0 | 0 | 17.61% |
| APOL | Apollo Group, Inc. | 63.53 | 15.89 | 4 | 0 | 7.34 | 20.34% |
Related:
| Symbol | Name | Trade | P/E | EPS (ttm) | Yield | P/B | % from Low |
| GILD | Gilead | 45.7975 | 16.2 | 2.822 | 0 | 6.48 | 10.86% |
| GENZ | Genzyme | 52.8 | 34.3 | 1.54 | 0 | 1.81 | 12.13% |
| SRCL | Stericycle | 54.58 | 27 | 2.03 | 0 | 5.44 | 18.76% |
| QCOM | QUALCOMM | 42.17 | 33.8 | 1.25 | 1.60% | 3.32 | 18.92% |
| APOL | Apollo Group | 63.14 | 15.8 | 4 | 0 | 7.13 | 19.61% |
| RYAAY | Ryanair | 29.75 | N/A | - | 0 | N/A | 19.86% |
Below are the Nasdaq 100 companies that are within 20% of the 52-week low.
| Symbol | Name | Price | P/E | EPS (ttm) | Yield | P/B | % from Yr Low |
| GILD | Gilead Sciences | 45.34 | 16.1 | 2.82 | 0 | 6.5 | 9.76% |
| GENZ | Genzyme Corp. | 53 | 34.4 | 1.54 | 0 | 1.8 | 12.55% |
| APOL | Apollo Group | 61.28 | 14.7 | 4.16 | 0 | 6.7 | 16.08% |
| QCOM | QUALCOMM | 41.83 | 33.6 | 1.246 | 1.60% | 3.3 | 17.96% |
| FSLR | First Solar, Inc. | 116.5 | 15.5 | 7.53 | 0 | 3.6 | 18.02% |
| SRCL | Stericycle, Inc. | 54.5 | 26.9 | 2.03 | 0 | 5.5 | 18.58% |
Email our team here.