Below is a chart of Northwest Natural Holdings (NWN) from 1973 to 2021 reflecting the year-over-year (YoY) percentage change.
- Japan
- Market Indicator
- Price Momentum Indicators
- Richard Russell
- Silver
- Speed Resistance Lines
- U.S. Dividend Watch List

Below is a chart of Northwest Natural Holdings (NWN) from 1973 to 2021 reflecting the year-over-year (YoY) percentage change.
Below are the valuation targets for Northwest Natural Holdings (NWN) for the next 10 years. Continue reading
Below are the valuation targets for Northwest Natural Gas (NWN) for the next 10 years. Continue reading
Below are the valuation targets for Northwest Natural Gas (NWN) for the next 10 years. Continue reading
Below are the 12 companies on our U.S. Dividend Watch List that are within 11% of their respective 52-week lows. Stocks that appear on our watch lists are not recommendations to buy. Instead, they are the starting point for doing your research and determining the best company to buy. Ideally, a stock that is purchased from this list is done after a considerable decline in the price and rigorous due diligence.

NWN's stock price has gone nothing but up since the recommendation. However, in the pursuit of "seeking fair profits" the returns that this stock has provided within the last 80 days say that it is necessary to consider alternative opportunities.
NWN was recommended when it was trading at $40.94. As of December 21, 2009, NWN was quoted at $45.25. This equals a return of 10.53%. Selling this stock now generates a return of 2.6x greater than the amount of the dividend yield. Additionally, the 10.53% gain exceeds the return on a 30-year treasury purchased on October 2, 2009 by 2.63x.
As I have indicated in the purposes and function of this site, the goal is to:
Research recommendations and investment observations are intended to be a starting point for investigating a quality company at a reasonable price. It is hoped that after doing the background research you can buy the stock at a lower price. Ideally the stock should be held in a tax deferred account and should not consist of less than 20% of your holdings. Personally, I prefer holding only 2-3 stocks at a time.
Sell recommendations are intended to deal with the short term reality of the market. The tracking of the Sell recommendations are the worst case scenario if you happen to have bought a stock at the time the research recommendation was made (please avoid making this mistake.) I aim for mediocrity in my returns, therefore I am happy with 9-12% annual gains. However, since codifying my approach to investing in 2005, I have had annual returns of 20% and above every year since.
It is always recommended that when selling a stock, one should not place stop orders, limit orders or orders after hours. This leaves the seller in the position of being vulnerable to the whims of the market makers. Instead, place your sell orders only as a market order during market hours. Some would complain that a market order during market hours might leave some profits on the table. However, I would rather leave some money on the table rather than have it taken away from me by the trades that are placed by institutions and market makers. -Touc
Posted in Northwest Natural Gas, NWN, Sell Recommendations
In today's research recommendation of NWN, I will cover the issue of cyclicality, the Coppock Curve, natural gas prices, and Dow's theory as it relates to the stock. I have compiled this information as I consider buying NWN. It is hoped that you thoroughly review NWN from all angles before committing any money to this accomplished Dividend Achiever.
When someone asks me about any cyclical stocks that I might be able to suggest, I often stammer at the thought. In fact, I'm clueless as any true cyclical stocks. However, after a considerable review of NWN, I can prove that it is definitely a true cyclical stock. First, NWN has exhibited a pattern of hitting a relatively low price between the months of January and May since 1970.
The stock hitting a low during the first five months of the year occurred 87% of the time. New lows during the months of February, March and April took place 78% of the time within the period from January to May. The month of February comprised 33% of the new lows between January and May. From the numbers that I ran, February and April are the most optimum month to consider buying this stock.
Next up is the Coppock Curve for NWN. In the chart below, you can seen that the Coppock Curve along with a 14-month trendline. After falling below the zero line, the rise crossing over the trendline indicated a ideal buying point on the first day of November 1994 at an adjusted price of $7.67. Subsequently, the stock reached an adjusted high of $16.74 in December of 1997.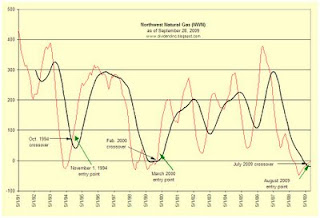
The next point when the Coppock Curve was crossed by the 14-month trendline was in February 2000. If you bought the stock on the first day of March 2000 at the adjusted price of $12.70, you would have seen the shares rise to an adjusted price of $52.19 on September 18, 2008. The rise from March 2000 to September 2008 is in spite of the bear market which began in October 2007. Currently, NWN's Coppock Curve has just crossed above the 14-month trendline. All indications are that this is a buying point based on the Coppock Curve.
Next up is the natural gas wellhead price from 1977 to the present. In the chart below, I have indicated the points where, based on the Coppock Curve, the price crossed above the 14-month trendline. It appears that the Curve accurately called the bottom in the price, almost to the very lowest point possible. From this indication, it appears that the natural gas wellhead price is about to rise from here.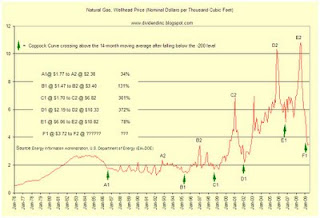
Finally, we'll look at the prospective upside and downside targets for NWN based on Dow's Theory.
Upside:
Comments Off on Northwest Natural Gas (NWN) at $40.94
Posted in Northwest Natural Gas, NWN
Comments Off on Northwest Natural Gas (NWN) Altimeter
Posted in Altimeter, Edson Gould, Northwest Natural Gas, NWN