
We begin the year with an impressive move upward in the S&P 500 index. Two weeks have passed and the market has gained 2.5% despite the financial trouble that continues to brew in the Europe. Our 2012 dividend list has 25 companies that are within 11% of the 52-week low.
January 13, 2012
| Symbol | Name | Price | % Yr Low | P/E | EPS (ttm) | Dividend | Yield | Payout Ratio |
| TR | Tootsie Roll Industries Inc | 23.63 | 3.55% | 32.82 | 0.72 | 0.32 | 1.35% | 44% |
| BCR | CR Bard, Inc. | 85.45 | 5.75% | 21.97 | 3.89 | 0.76 | 0.89% | 20% |
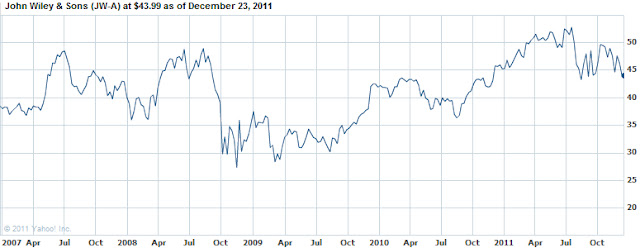
| JW-A | John Wiley & Sons Inc. | 44.59 | 6.45% | 15.65 | 2.85 | 0.80 | 1.79% | 28% |
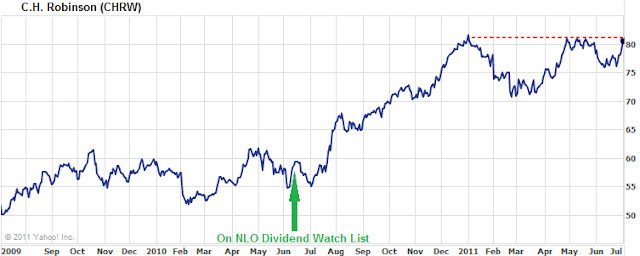
| CHRW | C.H. Robinson Worldwide | 66.73 | 7.11% | 25.96 | 2.57 | 1.32 | 1.98% | 51% |
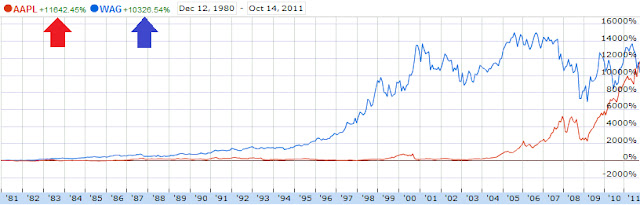
| WAG | Walgreen Co. | 32.63 | 7.55% | 11.02 | 2.96 | 0.90 | 2.76% | 30% |
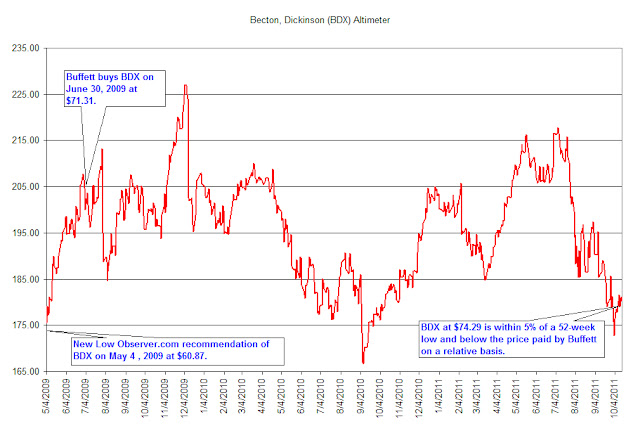
| BDX | Becton, Dickinson and Co. | 74.91 | 7.64% | 13.33 | 5.62 | 1.80 | 2.40% | 32% |
| CWT | California Water Service | 17.94 | 7.75% | 18.31 | 0.98 | 0.62 | 3.46% | 63% |
| WST | West Pharmaceutical | 38.29 | 7.86% | 21.15 | 1.81 | 0.72 | 1.88% | 40% |
| OMI | Owens & Minor, Inc. | 27.96 | 8.08% | 15.71 | 1.78 | 0.80 | 2.86% | 45% |
| ANAT | American National Insurance | 71.06 | 8.14% | 11.03 | 6.44 | 3.08 | 4.33% | 48% |
| CLX | Clorox Co. | 68.03 | 8.38% | 19.61 | 3.47 | 2.40 | 3.53% | 69% |
| AVP | Avon Products, Inc. | 17.52 | 8.89% | 10.31 | 1.70 | 0.92 | 5.25% | 54% |
| MATW | Matthews International Corp. | 31.19 | 9.17% | 12.68 | 2.46 | 0.36 | 1.15% | 15% |
| KO | Coca-Cola Co | 66.99 | 9.30% | 12.31 | 5.44 | 1.88 | 2.81% | 35% |
| AROW | Arrow Financial Corp. | 23.58 | 9.67% | 12.75 | 1.85 | 1.00 | 4.24% | 54% |
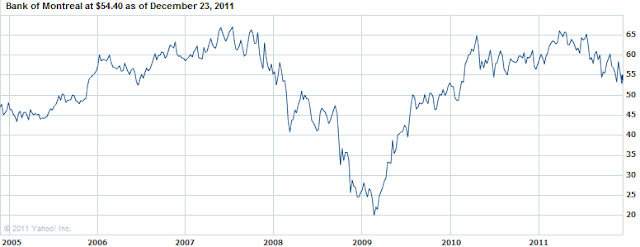
| BMO | Bank of Montreal | 56.92 | 9.82% | 11.07 | 5.14 | 2.73 | 4.80% | 53% |
| BMS | Bemis Co Inc | 29.89 | 9.85% | 15.02 | 1.99 | 0.96 | 3.21% | 48% |
| CAH | Cardinal Health, Inc. | 41.25 | 9.91% | 16.11 | 2.56 | 0.86 | 2.08% | 34% |
| TGT | Target Corp. | 49.82 | 10.03% | 11.59 | 4.30 | 1.20 | 2.41% | 28% |
| PEP | PepsiCo Inc. | 64.4 | 10.09% | 16.14 | 3.99 | 2.06 | 3.20% | 52% |
| WTR | Aqua America Inc | 21.26 | 10.27% | 21.47 | 0.99 | 0.66 | 3.10% | 67% |
| T | AT&T Inc | 30.07 | 10.55% | 15.26 | 1.97 | 1.76 | 5.85% | 89% |
| SJW | SJW Corp. | 23.11 | 10.73% | 19.42 | 1.19 | 0.69 | 2.99% | 58% |
| NFG | National Fuel Gas Co. | 49.35 | 10.87% | 15.97 | 3.09 | 1.42 | 2.88% | 46% |
| CATO | Cato Corp. | 23.98 | 10.97% | 10.90 | 2.20 | 0.92 | 3.84% | 42% |
| 25 Companies | ||||||||
Not much movement has occurred since our last watch list on December 23, 2011.
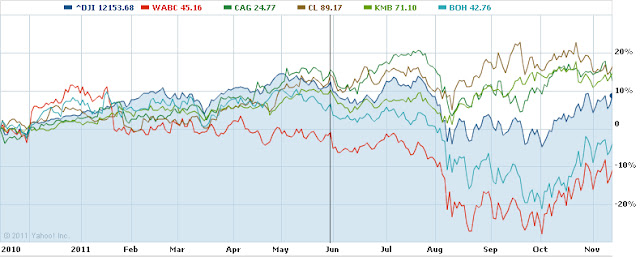
Top Five Performance Review
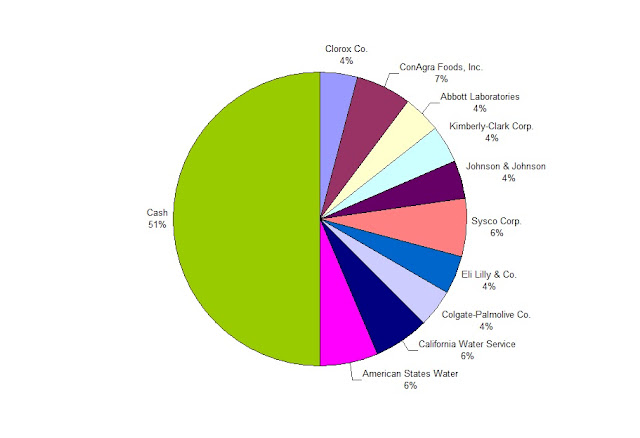
In our ongoing review of the NLO Dividend Watch List, we have taken the top five stocks on our list from January 14, 2011 and have check their performance one year later. The top five companies on that list can be seen in the table below.
| Symbol | Name | 2010 Price | 2011 Price | % change |
| ABT | Abbott Laboratories | 46.89 | 55.43 | 18.21% |
| CL | Colgate-Palmolive Co. | 78.31 | 88.52 | 13.04% |
| CLX | Clorox Co. | 63.98 | 68.03 | 6.33% |
| LLY | Eli Lilly & Co. | 34.91 | 39.94 | 14.41% |
| KMB | Kimberly-Clark Corp. | 63.64 | 72.7 | 14.24% |
| Average | 13.25% | |||
| DJI | Dow Jones Industrial | 11,787.38 | 12,422.06 | 5.38% |
| SPX | S&P 500 | 1,293.24 | 1,289.09 | -0.32% |
Disclaimer
On our current list, we excluded companies that have no earnings. Stocks that appear on our watch lists are not recommendations to buy. Instead, they are the starting point for doing your research and determining the best company to buy. Ideally, a stock that is purchased from this list is done after a considerable decline in the price and extensive due diligence. We suggest that readers use the March 2009 low (or the companies' most distressed level in the last 2 years) as the downside projection for investing. Our view is to embrace the worse case scenario prior to investing. A minimum of 50% decline or the November 2008 to March 2009 low, whichever is lower, would fit that description. It is important to place these companies on your own watch list so that when the opportunity arises, you can purchase them with a greater margin of safety. It is our expectation that, at the most, only 1/3 of the companies that are part of our list will outperform the market over a one-year period.
Please consider donating to the New Low Observer. Thank you.


