Below are the Nasdaq 100 companies that are within 10% of the 52-week low. This list is strictly for the purpose of researching whether or not the companies have viable business models. Continue reading
-
Topics
Archives
-
-
Recent Posts
-
-
-
-

Below are the Nasdaq 100 companies that are within 10% of the 52-week low. This list is strictly for the purpose of researching whether or not the companies have viable business models. Continue reading
Below are the Nasdaq 100 companies that are within 11% of their respective 52-week lows. Stocks that appear on our watch lists are not recommendations to buy. Instead, they are the starting point for doing your research and determining the best company to buy. Ideally, a stock that is purchased from this list is done after a considerable decline in the price and rigorous due diligence. Continue reading
Below are the Nasdaq 100 companies that are within 10% of their respective 52-week lows. Stocks that appear on our watch lists are not recommendations to buy. Instead, they are the starting point for doing your research and determining the best company to buy. Ideally, a stock that is purchased from this list is done after a considerable decline in the price and rigorous due diligence.
Posted in FFIV, gold, INTU, Nasdaq 100 Watch List, NUAN, TEVA, Teva Pharmaceutical
Below are the Nasdaq 100 companies that are within 11% of their respective 52-week lows. Stocks that appear on our watch lists are not recommendations to buy. Instead, they are the starting point for doing your research and determining the best company to buy. Ideally, a stock that is purchased from this list is done after a considerable decline in the price and rigorous due diligence. Continue reading
Below are the Nasdaq 100 companies that are within 11% of their respective 52-week lows. Stocks that appear on our watch lists are not recommendations to buy. Instead, they are the starting point for doing your research and determining the best company to buy. Ideally, a stock that is purchased from this list is done after a considerable decline in the price and rigorous due diligence.
Below are the Nasdaq 100 companies that are within 10% of their respective 52-week lows. Stocks that appear on our watch lists are not recommendations to buy. Instead, they are the starting point for doing your research and determining the best company to buy. Ideally, a stock that is purchased from this list is done after a considerable decline in the price and rigorous due diligence.
| Symbol | Name | Price | P/E | EPS | Yield | P/B | % from yr low |
| BIDU | Baidu, Inc. | 85.02 | 17.87 | 4.76 | - | 7.77 | 2.46% |
| EXPD | Expeditors International. | 35.42 | 22.56 | 1.57 | 1.6 | 3.61 | 3.57% |
| FFIV | F5 Networks, Inc. | 74.2 | 21.2 | 3.5 | - | 4.24 | 5.10% |
| TEVA | Teva Pharmaceutical | 38.55 | 17.13 | 2.25 | 2.8 | 1.44 | 5.24% |
| ALTR | Altera Corp. | 31.2 | 18.14 | 1.72 | 1.3 | 3.16 | 5.44% |
| GRMN | Garmin Ltd. | 34.72 | 12.58 | 2.76 | 5.1 | 1.96 | 6.77% |
| ISRG | Intuitive Surgical, Inc. | 486.76 | 28.57 | 17.04 | - | 5.16 | 6.94% |
| AVGO | Avago Technologies Limited | 32.11 | 14.27 | 2.25 | 2.4 | 3.19 | 8.11% |
| AAPL | Apple Inc. | 417.205 | 9.46 | 44.11 | 2.7 | 3.01 | 8.34% |
| WFM | Whole Foods Market, Inc. | 88.61 | 33.43 | 2.65 | 0.9 | 4.62 | 8.87% |
| CTXS | Citrix Systems, Inc. | 61.8 | 33.23 | 1.86 | - | 3.76 | 9.25% |
Watch List Summary
Baidu (BIDU) has topped our list this week. Despite having “unfettered” access to the Chinese market for search, the stock continues its long slide from the high price of $165.

Apparently, in the controlled environment of internet search in China, competitors are gaining ground in terms of market share. Since Google (GOOG) exited the search arena in China on April 10, 2010, the stock price performance of Google and Baidu has been exactly the same, albeit through opposite routes as indicated in the chart below.

There is at least one lesson in this reversal of fortune for Baidu and the departure from China by Google as it relates to the stock price, the largest market in the world is not necessary for a stock price to rise. In fact, it could be considered that if you’re in the largest market, after having tapped into every other market on the planet, then you’re probably at the end of the line in terms of growth. This brings us to the view that Baidu has some opportunity for growth since its global reach is limited, for now.
In the February 15, 2013 Value Line Investment Survey, fair value estimates for Baidu are:
The Speed Resistance Lines for Baidu are very compelling at this time as shown below:
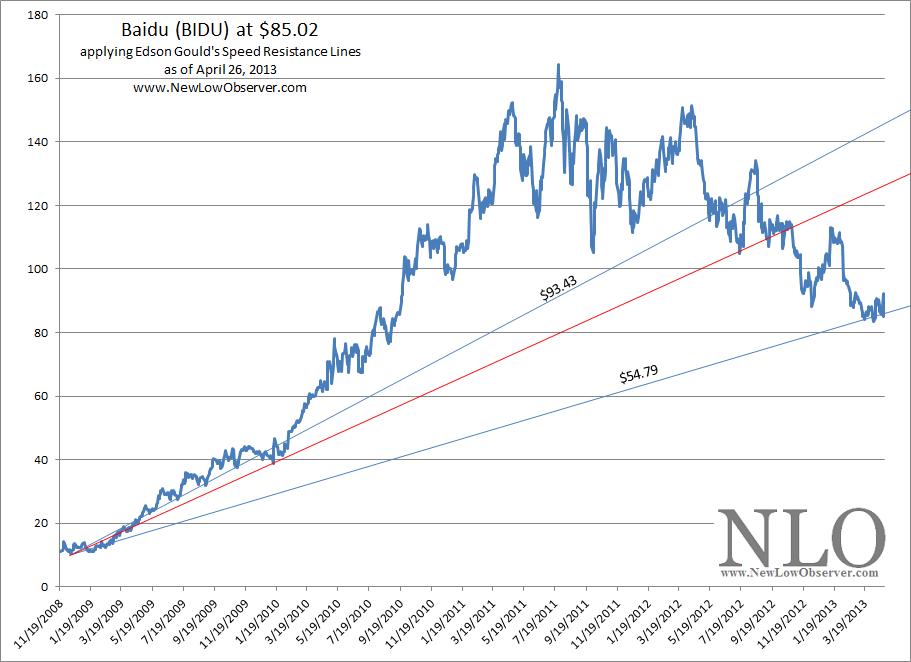
The conservative downside target of $93.43 has been achieved and we are now sitting at the extreme downside target of $54.79. All indications, based on the SRL, are that Baidu is worth considering in a two stage purchase plan, once at the current level and again at $67 or lower.
Watch List Performance Review
In our ongoing review of the Nasdaq 100 Watch List, we have taken the top 5 stocks from April 27, 2012 (found here). The top 5 companies from the watch list are provided below with the closing price from April 27, 2012 to April 26, 2013.
|
Symbol
|
Company | 2012 | 2013 | % Change |
| CHRW | CH Robinson Worldwide | 59.02 | 58.44 | -0.98% |
| FSLR | First Solar, Inc. | 18.35 | 44.08 | 140.22% |
| EXPD | Expeditors Int’l | 39.90 | 35.42 | -11.23% |
| CTRP | Ctrip.com Int’l | 21.66 | 22.22 | 2.59% |
| EA | Electronic Arts Inc. | 15.32 | 17.88 | 16.71% |
| Average | 29.46% | |||
| NDX | Nasdaq 100 Index | 3420.80 | 3747.15 | 9.54% |
As can been seen in the table above, First Solar (FSLR) is the stock that carried the performance for the top 5 stocks. If FSLR were excluded the gain for the top 5 if bought and held for the full year would have been +1.42%. To be honest, we would not have bought FSLR at that time but this explains why we run these numbers. We want to see how well or poorly an investor would do if they knew nothing about the names and simply bought the top five stocks. Four of the top five stocks gained at least +10% with Expeditors Intl (EXPD) being the only stock to fall short of that mark.
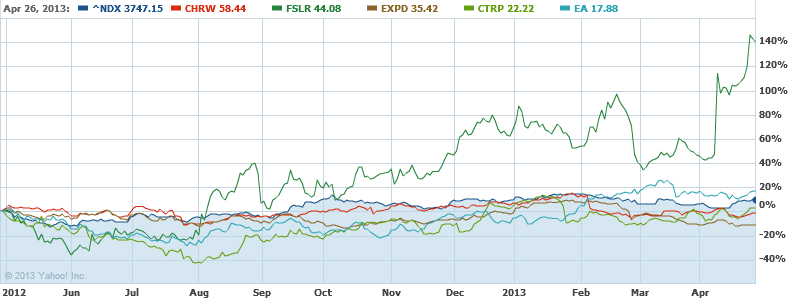
The three stocks that we identified to be of interest from the April 27, 2012 watch list had the following performance in the last year as compared the Nasdaq 100 Index.
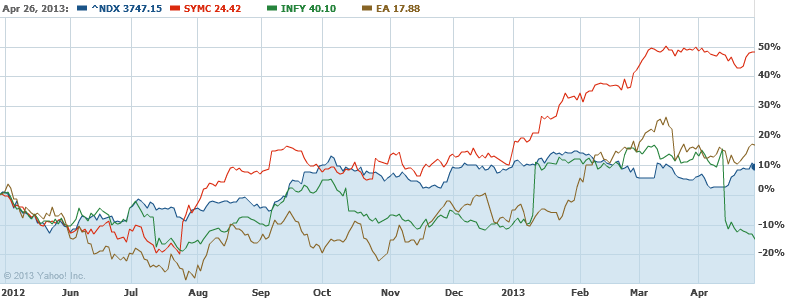
All three of the stocks, Symantec (SYMC), Infosys (INFY) and Electronic Arts (EA) hit the first estimated downside target before rising above the watch list price. All three of the stocks gained at least +15% within the year.
Below are the Nasdaq 100 companies that are within 10% of their respective 52-week lows. Stocks that appear on our watch lists are not recommendations to buy. Instead, they are the starting point for doing your research and determining the best company to buy. Ideally, a stock that is purchased from this list is done after a considerable decline in the price and rigorous due diligence.
Below are the Nasdaq 100 companies that are within 11% of their respective 52-week lows. Stocks that appear on our watch lists are not recommendations to buy. Instead, they are the starting point for doing your research and determining the best company to buy. Ideally, a stock that is purchased from this list is done after a considerable decline in the price and rigorous due diligence.
Posted in Nasdaq 100 Watch List
Below are the Nasdaq 100 companies that are within 10% of their respective 52-week lows. Stocks that appear on our watch lists are not recommendations to buy. Instead, they are the starting point for doing your research and determining the best company to buy. Ideally, a stock that is purchased from this list is done after a considerable decline in the price and rigorous due diligence.
Below are the Nasdaq 100 companies that are within 10% of their respective 52-week lows. Stocks that appear on our watch lists are not recommendations to buy. Instead, they are the starting point for doing your research and determining the best company to buy. Ideally, a stock that is purchased from this list is done after a considerable decline in the price and rigorous due diligence.
Below are the Nasdaq 100 companies that are within 10% of their respective 52-week lows. Stocks that appear on our watch lists are not recommendations to buy. Instead, they are the starting point for doing your research and determining the best company to buy. Ideally, a stock that is purchased from this list is done after a considerable decline in the price and rigorous due diligence.
Below are the Nasdaq 100 companies that are within 10% of their respective 52-week lows. Stocks that appear on our watch lists are not recommendations to buy. Instead, they are the starting point for doing your research and determining the best company to buy. Ideally, a stock that is purchased from this list is done after a considerable decline in the price and rigorous due diligence.
Below are the Nasdaq 100 companies that are within 10% of their respective 52-week lows. Stocks that appear on our watch lists are not recommendations to buy. Instead, they are the starting point for doing your research and determining the best company to buy. Ideally, a stock that is purchased from this list is done after a considerable decline in the price and rigorous due diligence.
Comments Off on Nasdaq 100 Watch List: January 11, 2013
Posted in BBBY, DLTR, MSFT, Nasdaq 100 Watch List, TEVA, Teva Pharmaceutical, VOD
Below are the Nasdaq 100 companies that are within 10% of their respective 52-week lows. Stocks that appear on our watch lists are not recommendations to buy. Instead, they are the starting point for doing your research and determining the best company to buy. Ideally, a stock that is purchased from this list is done after a considerable decline in the price and rigorous due diligence.
| Symbol | Name | Price | P/E | EPS | Yield | P/B | % from low |
| VOD | Vodafone Group Public Limited Company | 25.12 | - | -0.55 | 4.1 | 1.11 | 0.68% |
| TEVA | Teva Pharmaceutical Industries Limited | 37.79 | 15.4 | 2.45 | 2.1 | 1.44 | 1.04% |
| ATVI | Activision Blizzard, Inc. | 10.68 | 13.78 | 0.78 | 1.7 | 1.09 | 2.20% |
| BBBY | Bed Bath & Beyond Inc. | 55.66 | 12.71 | 4.38 | - | 3.13 | 2.45% |
| MSFT | Microsoft Corporation | 27.06 | 14.63 | 1.85 | 3.4 | 3.36 | 5.05% |
| SPLS | Staples, Inc. | 11.28 | - | -0.01 | 3.8 | 1.26 | 6.72% |
| INTC | Intel Corporation | 20.64 | 9 | 2.29 | 4.3 | 2.1 | 7.33% |
| DLTR | Dollar Tree, Inc. | 40.05 | 16.09 | 2.49 | - | 5.91 | 7.89% |
| PAYX | Paychex, Inc. | 31.5 | 20.45 | 1.54 | 4.2 | 6.73 | 8.17% |
| NVDA | NVIDIA Corporation | 12.25 | 15.29 | 0.8 | 2.4 | 1.63 | 9.87% |
| ^NDX | NASDAQ-100 | 2,658.05 | - | - | - | - | 17.50% |
Watch List Summary
The last time that Vodafone (VOD) was this close to the low and on our watch list was September 9, 2011 (found here). At the time, our data indicated that Vodafone had a dividend yield of 7.30% and a price to book ratio of 1.01. In two months VOD rose +12% and after two years, the highest VOD was able to rise was $30 or nearly 17% from the Sept 2011 low. For us, this is an indication to be mindful of the fact that high dividend yields are not necessarily the clearest path to exception gains, unless in some cases the investor has the willingness to accept the 10% achieved within 2 months.

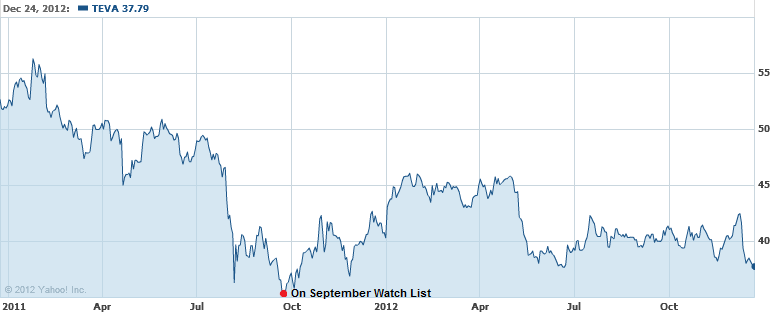
Teva Pharmaceutical (TEVA) was on the watch list on September 23, 2011 (found here) when the stock was trading at $35.26. At its highest point in January 2012, TEVA increased +30% from the September 2011 low. However, since the January 2012 high, TEVA has fallen –18% to the current price of $37.79 or +7.18% above the price of September 23, 2011. On September 23, 2011, TEVA sported a dividend yield of 2.10% and a P/E ratio of 10.08. Now, TEVA has a P/E of 15.4 and a dividend yield of 2.10%.
Activision Blizzard (ATVI) was on the watch list on August 12, 2011 (found here) when the stock was trading at $10.71. No sooner than ATVI was on our list that it rose +30% to the November 8, 2011 high. ATVI is now selling at the same price as August 2011, however, the stock has a lower P/E ratio and a lower P/B ratio. If we suppose that the stock has not moved up at all in the last year, this could be considered an undervalued stock.
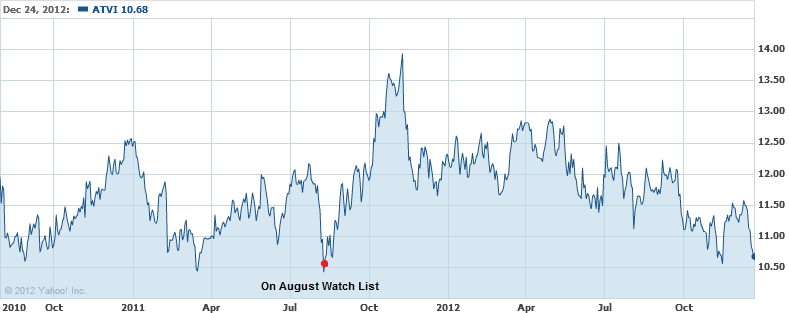
As is often the case with most stocks, early gains are offset with declines, at least in the first year, which explains why we’re so focused on the 52-week low. Most stocks seem to run in cycles of 1 to 2 years. Stocks that fall to a new low after one year should be at or below the price from the prior year. Stocks that fall to a new low after 2 years could be significantly above the low of two years prior but a 52-week low.
Watch List Performance Review
In our ongoing review of the Nasdaq 100 Watch List, we have taken the stocks from our list of December 16, 2011 (found here) and have checked their performance one year later. The companies on that list are provided below with the closing prices from December 16, 2011 to December 14, 2012.
|
Symbol
|
Name |
2011 | 2012 | % change |
| BMC | BMC Software, Inc. | 33.17 | 40.18 | 21.13% |
| VMED | Virgin Media Inc. | 20.95 | 36.07 | 72.17% |
| CTRP | Ctrip.com International, Ltd. | 23.1 | 21.15 | -8.44% |
| SYMC | Symantec Corporation | 15.46 | 18.68 | 20.83% |
| BRCM | Broadcom Corporation | 28.72 | 32.06 | 11.63% |
| Average | 23.46% | |||
| NDX | Nasdaq 100 | 2,238.18 | 2,658.05 | 18.76% |
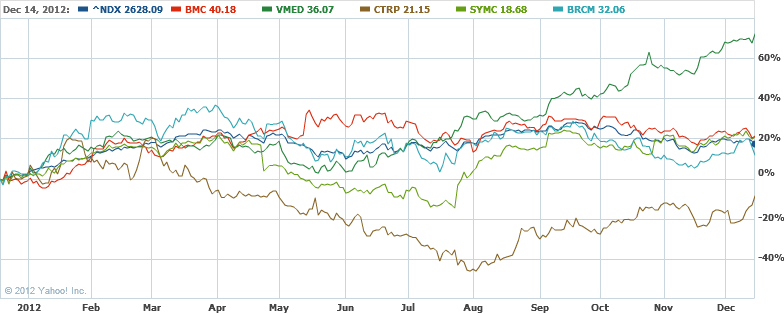
The performance of the top five stocks from the December 16, 2011 watch list was reasonable. However, despite the outcome after a year, all five of the stocks achieved +20% gains within the first three months.
Below are the Nasdaq 100 companies that are within 10% of their respective 52-week lows. Stocks that appear on our watch lists are not recommendations to buy. Instead, they are the starting point for doing your research and determining the best company to buy. Ideally, a stock that is purchased from this list is done after a considerable decline in the price and rigorous due diligence.
| Symbol | Name | Price | P/E | EPS | Yield | P/B | dividend | payout ratio | % from low |
| WCRX | Warner Chilcott plc | 11.3 | 7.73 | 1.46 | 4.4 | -4.33 | 0.5 | 34.25% | 2.26% |
| DLTR | Dollar Tree, Inc. | 38.65 | 15.53 | 2.49 | - | 5.61 | - | - | 4.12% |
| VOD | Vodafone Group | 26 | - | -0.55 | 3.9 | 1.14 | 1.02 | -185.45% | 4.21% |
| BBBY | Bed Bath & Beyond Inc. | 58.18 | 13.52 | 4.3 | - | 3.34 | - | - | 4.68% |
| TEVA | Teva Pharmaceutical | 39.47 | 16.08 | 2.45 | 1.9 | 1.58 | 0.81 | 33.06% | 5.53% |
| MSFT | Microsoft Corporation | 27.24 | 14.72 | 1.85 | 3.4 | 3.34 | 0.92 | 49.73% | 7.08% |
| INTC | Intel Corporation | 20.67 | 9.01 | 2.29 | 4.5 | 2.09 | 0.9 | 39.30% | 7.49% |
| KLAC | KLA-Tencor Corporation | 47.08 | 11.45 | 4.11 | 3.4 | 2.36 | 1.6 | 38.93% | 8.96% |
| MCHP | Microchip Technology Inc. | 31.7 | 30.16 | 1.05 | 4.5 | 3.12 | 1.41 | 134.29% | 9.61% |
| ^NDX | NASDAQ-100 | 2,674.57 | - | - | - | - | - | - | 21.04% |
Watch List Summary
A stock that we’re interested in is Dollar Tree (DLTR). Dollar Tree has had a substantial run in the last five years. As the price of the stock has recently peaked at $56.34 on June 20, 2012, the decline has almost been as substantial.

Dollar Tree (DLTR) has declined -31% from the most recent peak. The highlight of this stock is the ability to remain in a rising trend from the low in January 2008 in spite of the -40% decline in the general stock market.
From a technical standpoint, the stock has established a significant support level at $37.71. So far, the stock has the potential to increase from the current level to at least $42.18 level on the upside. However, falling below the support level means that the stock could easily achieve the conservative downside target of $25.88 (extreme downside target is $18.78).
A decline to $25.88 is equal to –54%. Such a decline would not be unusual as it would only be slightly more than the decline in the stock from July 2007 at $14.74 to January 2008 at $7.41.
According to Dow Theory, Dollar Tree has the following downside targets:
More research and a potential purchase should take place at $25.88 and below.
Watch List Performance Review
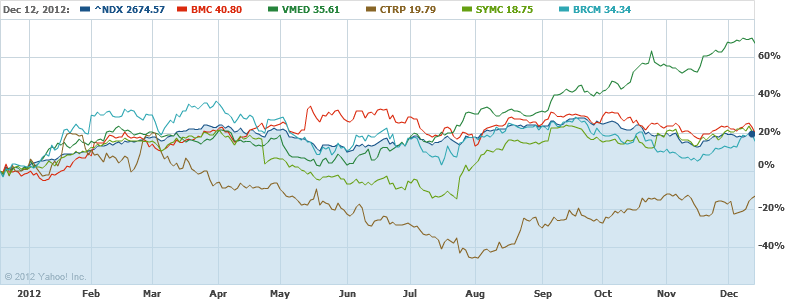
In our ongoing review of the Nasdaq 100 Watch List, we have taken the stocks from our list of December 16, 2011 (found here) and have checked their performance one year later. The companies on that list are provided below with the closing prices from December 16, 2011 to December 12, 2012.
|
Symbol
|
Name |
2011 | 2012 | % change |
| BMC | BMC Software, Inc. | 33.17 | 40.8 | 23.00% |
| VMED | Virgin Media Inc. | 20.95 | 35.61 | 69.98% |
| CTRP | Ctrip.com Int'l | 23.1 | 19.79 | -14.33% |
| SYMC | Symantec Corp. | 15.46 | 18.75 | 21.28% |
| BRCM | Broadcom Corp. | 28.72 | 34.34 | 19.57% |
| Average | 23.90% | |||
| NDX | Nasdaq 100 Index | 2238.18 | 2674.57 | 19.50% |
Overall, the watch list slightly exceed the Nasdaq 100 index by +4.40%. All stocks achieved gains of +20% within 5 months. Virgin Media (VMED) exceeded our expectations by a wide margin. In fact, the stock only went up after being on the watch list by rising +69% in the last year.
Comments Off on Nasdaq 100 Watch List: December 12, 2012
Posted in BBBY, DLTR, Nasdaq 100 Watch List, TEVA, Teva Pharmaceutical, VOD, WCRX