Below is a chart of iShares MSCI Japan Small-Cap ETF (SJC) from 2008 to 2019 reflecting the year-over-year (YoY) percentage change.
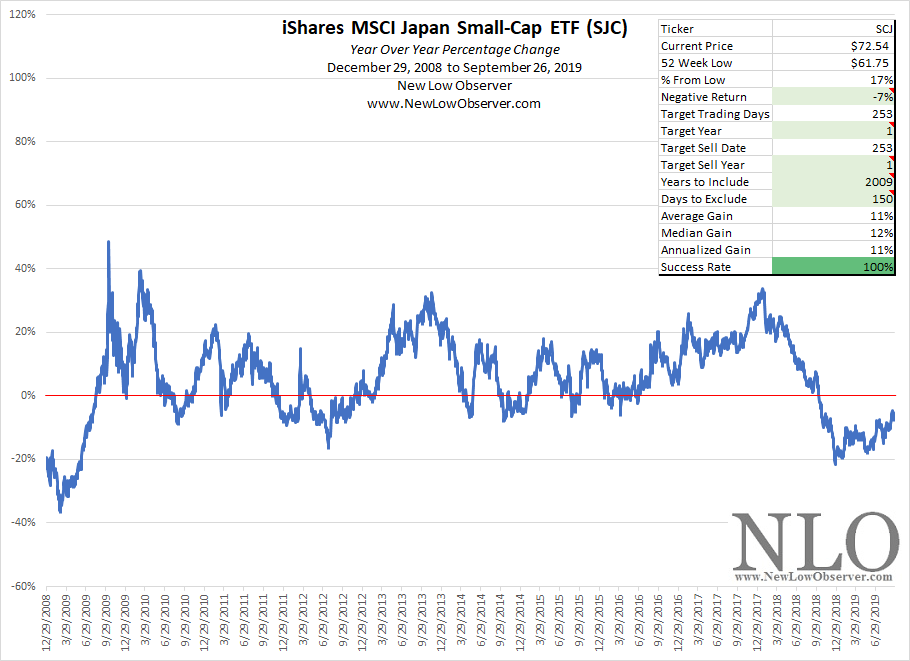

Below is a chart of iShares MSCI Japan Small-Cap ETF (SJC) from 2008 to 2019 reflecting the year-over-year (YoY) percentage change.
Below is the next upside resistance target for Yokohama Reito (2874.T) along with the downside support level.
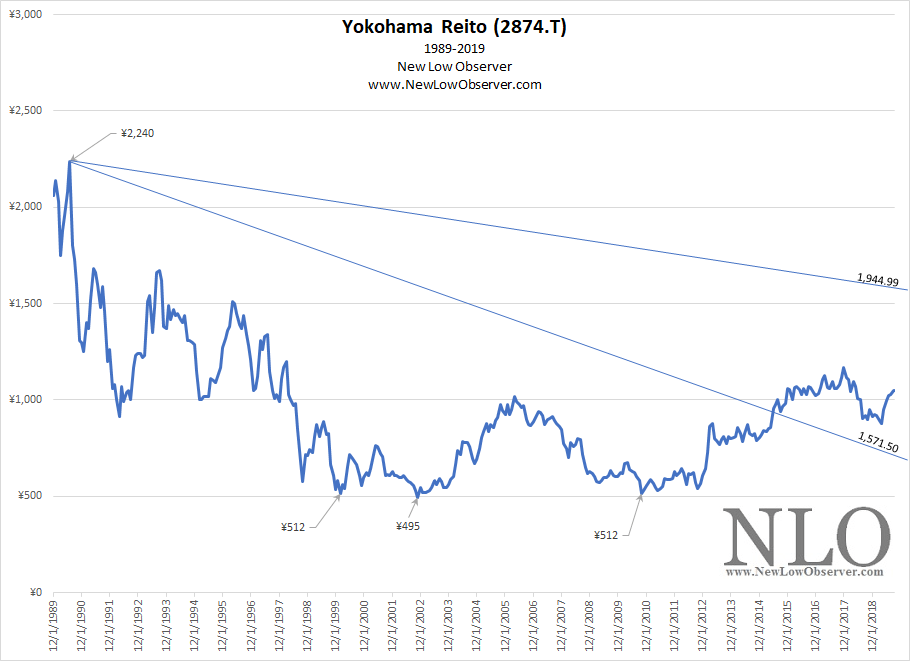
Our expectation is that the 1999 low along with the 2009 re-test of the same level at ¥512 was the confirmation of the reversal in the declining trend from the ¥2,670 peak in September 1989.
As the saying goes, “it is a recession when it happens to others and a depression when it happens to you.”
In the last “Great” Depression from 1929 to 1945, Americans were well aware of the pain and misery that was wrought on the nation. There are even some who wrongly claim that the only reason the United States got out of the “Great” Depression was World War II. Debates aside, below is a percentage change chart of the Dow Jones Industrial Average from 1929 to 1954, the period of time that it took for the index to get back to “break even.”

There is no debate among the average American or Harvard economist about when the last “Great” Depression occurred in the United States. However, when the exact same thing happens to one of our allies, it seem difficult for even the most esteem experts on the “Great” Depression to recognize the current depression simply because it isn’t happening to us.
That ally is Japan. To put our claim in context, we will show you the stock market of Japan as represented by the Nikkei 225 Index in exactly the same format as the Dow Jones Industrial Average above.
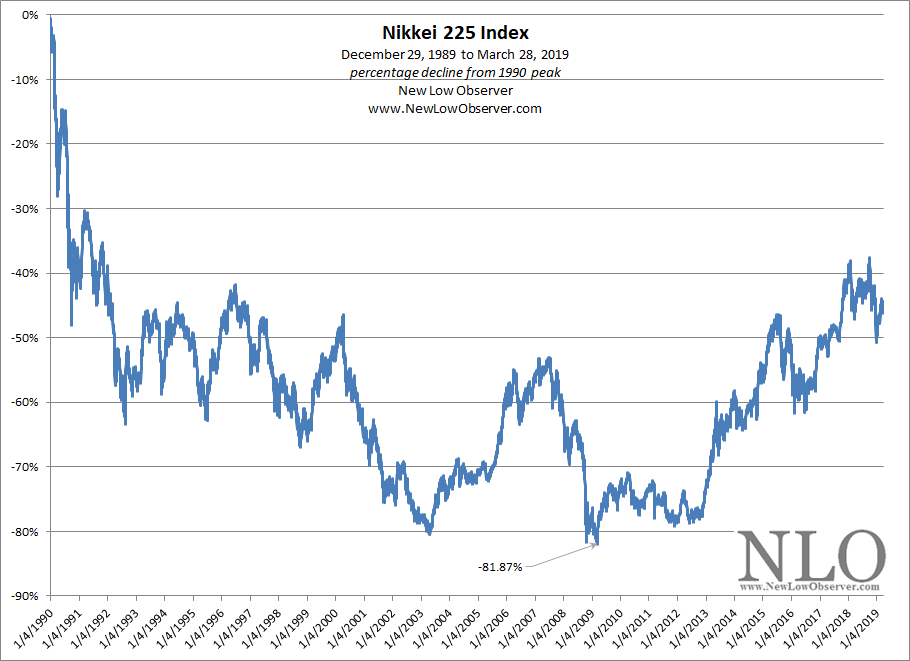
Someone please tell us that what Japan is going through isn’t a depression. We use the stock market as the most accurate real-time reflection of the economy, politics, and social well being, which is nothing new to long-time readers of our work.
Let’s reflect for a moment, in Japan from 1989 to 2008:
How is it possible, that a key measure of the health of a nation like Japan could suffer so much and not be recognized to be in an “Even Greater” Depression?
Look at the Dow Jones Industrial Average from 1929 to 1954 again. It took 25 years for the index to break even. Now look at the Nikkei 225 Index, it has already been 29 years and the index is still –40% below the prior peak.
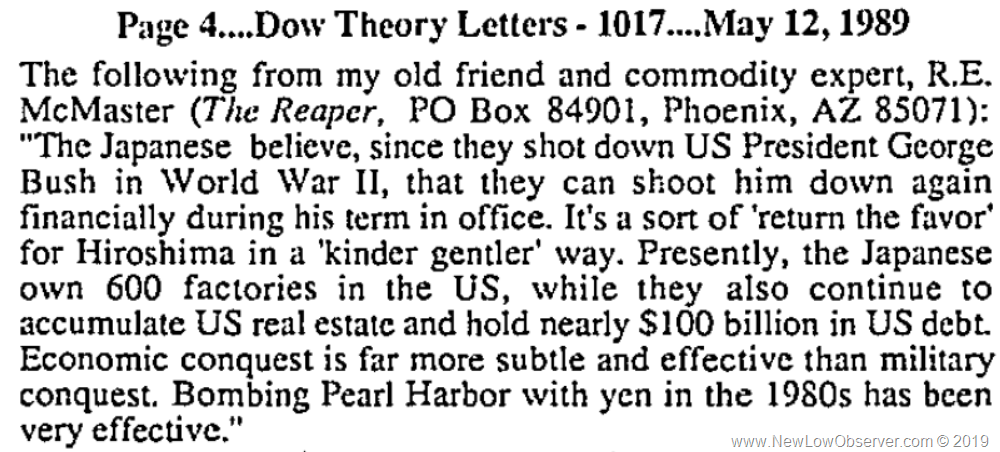
Let’s take a brief refresher course on what was said of Japan prior to the decline of 1990, this from the Dow Theory Letters as published by Richard Russell and dated May 12, 1989:
Or how about the following, dated October 18, 1989:

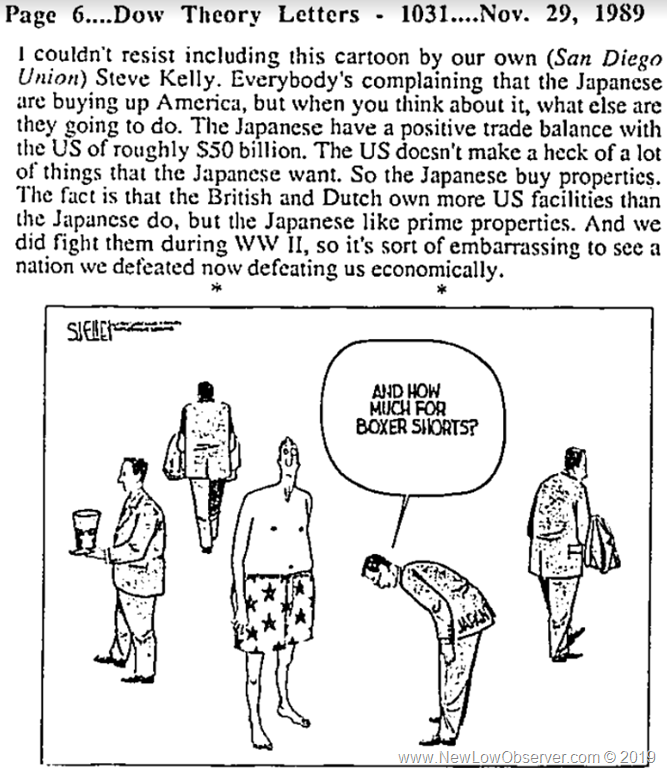
And this from November 29, 1989:
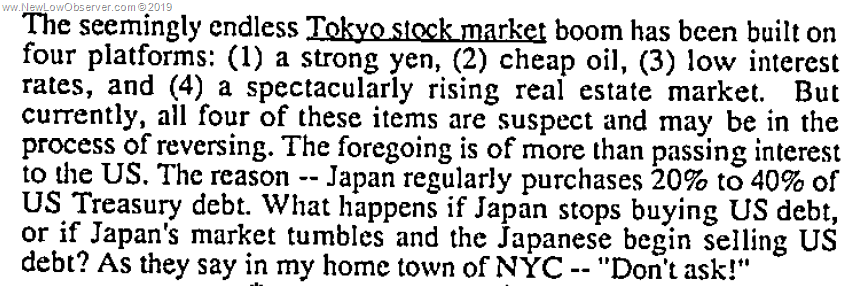
And finally, this from April 5, 1989:
It is not an uniquely American attribute to forget the past but to blithely walk past the “Even Greater” Depression within our midst while it impacts our ally is a brewing storm.
Investors, politicians, and citizens alike would do well to note the exact same (subtle and not so subtle) slights and invectives being lobbed around today. Meanwhile, due diligence is necessary to first acknowledge the plight of an ally and act in the interest of both nations before it is too late.
Posted in 1929, DJIA, interest rates, Japan, Nikkei, QE, Quantative Easing