Category Archives: Coppock Curve

Speculative Observation: Cephalon Inc. (CEPH) at $62.42

The new year brings new challenges and opportunities. The first opportunity for this year may come from Cephalon (CEPH) which engages in the discovery, development, and commercialization of products for central nervous system, inflammatory disease, pain, and oncology therapeutic areas. It competes against GlaxoSmithKline plc (GSK), Johnson & Johnson (JNJ), and Sepracor Inc. Because the company doesn't pay a dividend, the New Low Observer team has to classify such a security as a speculation.

CEPH came onto our radar when we began compiling the new low data back in July when the stock was trading around $57. This was 8% above the 52 week low of $52.55. At the low, CEPH was trading at less than 15 times earnings. Although appearing to be risky, selected stocks at or near their low offer investors the opportunity to investigate quality companies for potential price increases. Our concept is laid out in the "Buy Low, Sell High" article.

CEPH has a market cap of $4.6 billion dollar. The relatively small size compared to its rivals doesn't discourage us. We only care about the market cap as a means for liquidity when buying and selling the stock. CEPH earned $3.62 per share over the last 12 months and thus has a price to earnings ratio (P/E) of 17 and a forward P/E of 10, an extraordinarily low multiple. Low P/E multiples imply that investors are paying less for every dollar of earnings (more on our view of P/E). CEPH has a book value of $28.71 per share. At $62, price-to-book is north of 2. A positive operating cash flow of $232.48M is a plus but a negative free cash flow is one of my concern ($-12.71M).

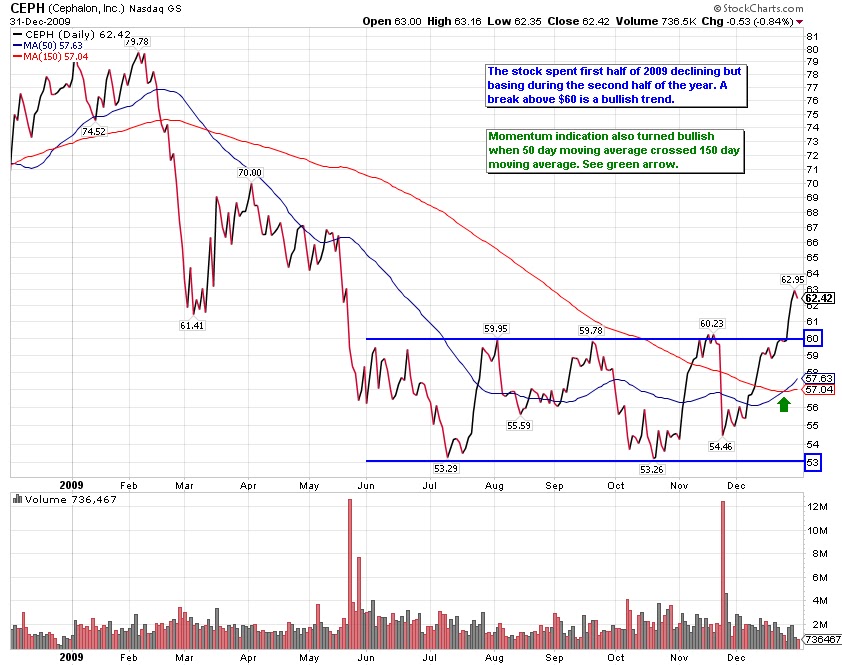
Fundamentals aside, the stock may have discounted all the negative news based on the chart pattern. In 2009, Cephalon dropped 19% as opposed to the Dow Industrials which rose 19%. Unlike the Dow which hit the yearly low in March, Cephalon bottomed in July and formed what appears to be a base. This pattern is prominent because it shows that the stock failed to move either up or down and traded in range between $60 and $53. Any break above $60 or below $53 will reveal its potential direction of the stock. Sure enough, the stock broke above $60 in late December and will look for that to be a support for the stock. The momentum indication also turned bullish as the 50-day moving average crossed the upward sloping 150-day moving average as indicated in the chart below.

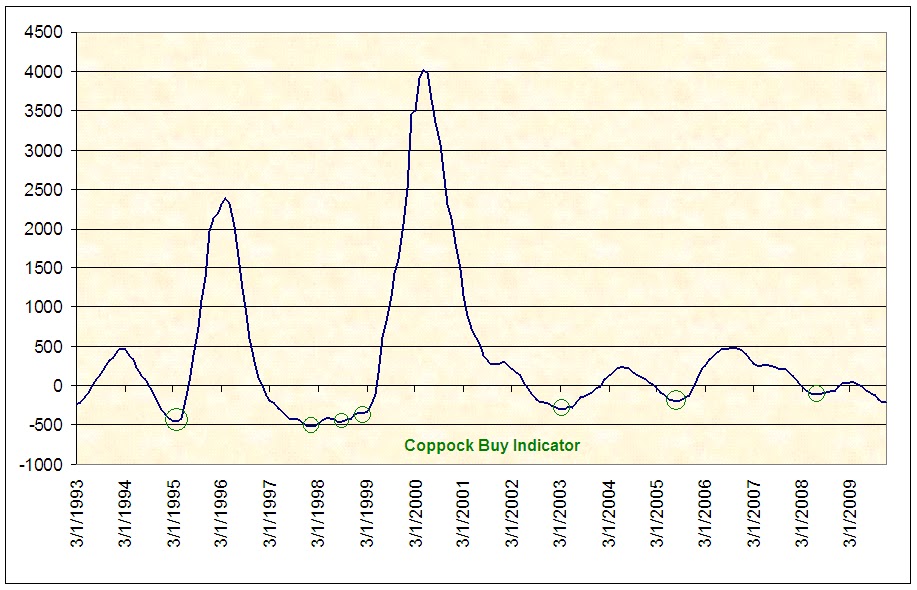
Another indicator I like to refer to is the Coppock Curve (click here for more on the Coppock Curve). For Cephalon, the curve dates back to 1993. The table below shows my findings.

Date Price 3 Mo After % Change
May-95 9.81 24.25 147%
Feb-98 12.00 10.63 -11%
Sep-98 7.31 9.00 23%
Mar-99 8.75 17.38 99%
May-03 45.16 44.35 -2%
Sep-05 46.42 64.74 39%
Aug-08 76.62 73.48 -4%

The average percentage gain if you sell three months after the buy indication is 42%. Excluding the 1995 data, it is 24%. We are waiting for the indicator to turn for a possible buy signal.

A buy strategy would be to purchase this stock as close as possible to $60 or the 50 day moving average which is dynamic and constantly changing. Use the Coppock indicator as another gauge to buy and watch your gains or losses closely. - Art

Coppock Curve Review

"Too much too soon." Those are the words of E.S.C. Coppock in describing the emotional state of the uninitiated investors response to the ups and downs of the stock market. The purpose of the Coppock Curve is to measure the emotional overreaction to the movement of the stock market.

Mr. Coppock observed that investors tend to ignore the fact that earnings are stable or rising and instead sell off a stock which is thought to be in trouble. Therefore, the monthly averaging of an index like the Dow Jones Industrials allows for better clarification of the what the price action is telling us.

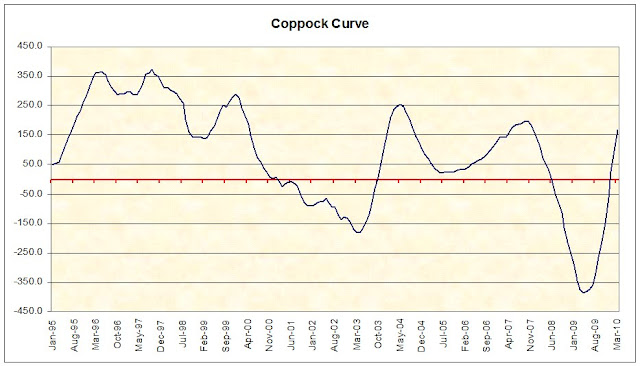
So far the Coppock curve is indicating that, although we may not be at the bottom in the stock market, we are still in a relatively risk free period to invest in stocks. The following is the movement of the index from the lowest point since April 2009:

  • Apr 2009: -388
  • May 2009: -383
  • Jun 2009: -378
  • Jul 2009: -359
  • Aug 2009: -321

With the Coppock Curve indicating that we're at a relatively risk free period for stocks along with the Industrial Production Index moving up and the Dow Theory bull market indication of July 23rd, it appears that we could be on our way to higher levels in the stock market and the economy over an extended period of time. Dow Theory still has a pending non-confirmation to be worked through but I will not report on that until we get a resolute signal. Touc.

related articles:

Please revisit Dividend Inc. for editing and revisions to this post.

Coppock Curve Review

Today is the end of the month which means that we can now review the Coppock Curve(also known as the Coppock Index) to determine if the direction for stocks is indicated to be moving higher overall. Since the last bottom in the Coppock Curve back in April the index has had the following monthly figures:

  • April 2009:-388
  • May 2009:-383
  • June 2009:-378
  • July 2009: -359

From what I can tell we need another 3 months of rising numbers along with an increase above -260 for the Coppock Curve to establish a clear signal that a sustainable market reversal is at hand. I know that asking for 3 more months of rising figures seems like a lot. However, I just don't want to get faked out like what occurred in May of 2002. The actual turn in the index took place in March of 2003, almost a full year later. Would I be missing a lot of market "action" by taking this stance? Absolutely. However, the risk to your hard earned principal is what is at stake. It is always best to take the cautious stance on these matters.


Remember, The Coppock Curve is a relative strength index. In almost every instance that this index rises from a negative number to a positive number it has coincided with a relatively risk-free time to invest in stocks. In turn, an improvement in the stock market is a reflection of the better times in the U.S. economy overall. Let us hope that the trend continues. Touc.


Please revisit Dividend Inc. for editing and revisions to this post.