Author Archives: nlo-admin

Gold Stock Indicator: November 6, 2015

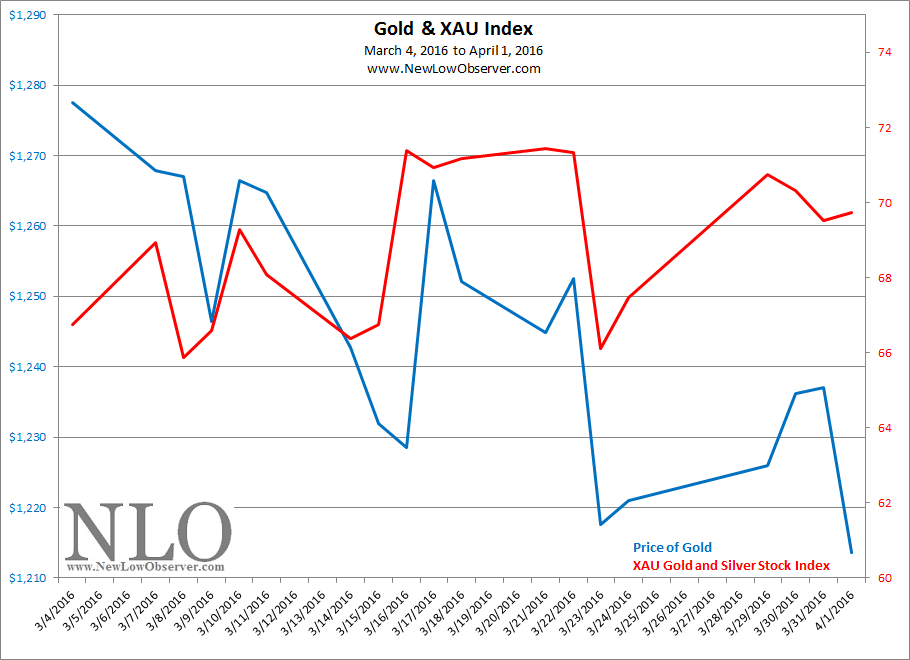
Since our last posting, gold has slumped an additional –5.44% while gold stocks have declined –17.90%.

image

U.S. Dividend Watch List: November 6, 2015

The S&P 500 started the week strong but finished just shy of 2,100. There are 39 companies in our complete watch list this week. Continue reading

Nordstrom Inc.

image

CNA Financial

image

Qualcomm Inc.

image

Bitcoin Targets

On November 19, 2013, we said the following:

“Our conservative downside target for Bitcoin, based on the peak closing price of $785.50 is $384.83.  The extreme downside target is $261.83.  The worst case scenario is for Bitcoin to fall as low as $152.83 as indicated by the red line on the chart.

As we’ve written many pieces on the topic of Edson Gould’s Speed Resistance Line, we’ve made some observations that we think should be highlighted at this time.  For the first time, we’re going to provide what we believe might be an upside target.  In the case of Bitcoin, the next conservative upside target is $1,154.49 if the most recent peak of $785.50 is exceeded.  This is a tentative estimate based on observations of the many successful downside SRLs that we have run in the past.  We’ll be on the lookout for what may come next.”

After offering up our upside target of $1,154.49, Bitcoin peaked at $1,147.25.  The downside targets, a standing number for when and if a decline ensued, were promptly followed by Bitcoin declining to $177.28.

image 

image

It has taken some time but Bitcoin appears to be on the rebound.  The last quote received was $424 which is above our previous worst case scenario for the digital currency.

Below is the latest downside target based on the current peak price of $424.

image

We focus on the downside risk to prepare for prudent employment of capital.  Any and all ventures, whether speculative or investment related, should be with the expectation that the worst case scenario is likely.  For this reason, we have indicated the conservative and midrange downside targets on the chart.  One number that has been left out of the chart above (but should be factored in) is the extreme downside target of $141.33.  These numbers will change when and if Bitcoin charges higher.

Currently, the upside targets  are:

  • $525.00
  • $788.25
  • $1051.00

If the current run-up is anything like those in the past, $1,051 could be a relatively small number.  However, each of the indicated upside targets must be achieved first before we can start giving estimates of how far beyond $1,051 Bitcoin could go.

Everest Re Group

image

The Jean Coutu Group

image

Carlisle Companies

image

USG Corporation

image

Transaction Alert

Insurance Watch List: October 30, 2015

Performance Review

Below is the Insurance Watch List from November 6, 2012 and the subsequent performance. The stocks are listed in the order that they were on the watch list.

Symbol Name 2012 2015 % chg
TWGP Tower Group Inc. 17.68 2.5 -85.86%
PKIN Pekin Life Insurance Company 10.8 12.4 14.81%
ASI American Safety Insurance Holdings Ltd. 17.22 30.25 75.67%
FRFHF Fairfax Financial Holdings Limited 372.45 496.5 33.31%
NSEC National Security Group Inc. 8.15 13.5 65.64%
GTS Triple-S Management Corporation 17.72 20.59 16.20%
THG The Hanover Insurance Group Inc. 35.61 84.25 136.59%
OB OneBeacon Insurance Group, Ltd. 13.01 14.39 10.61%
CRVL CorVel Corporation 42.74 33.2 -22.32%
MHLD Maiden Holdings, Ltd. 8.54 15.55 82.08%
ERIE Erie Indemnity Company 66.3 87.46 31.92%
MIG Meadowbrook Insurance Group Inc. 5.72 8.65 51.22%
TDHOY T&D Holdings, Inc. 5.31 6.55 23.35%
WSH Willis Group Holdings Public Limited Company 34.87 44.61 27.93%

The entire watch list gained an average of +32% which is 30% less than the iShares US Insurance ETF (IAK) in the same period of time.  At the time, we had a strong interest in two stocks, The Hanover Insurance Group (THG) and Maiden Holdings (MHLD).  Our general assessment of both stocks was fairly accurate as THG has the top performance at +136% and MHLD was the second in performance at +82.08%.

At the time, we thought that MHLD was undervalued compared to AmTrust Financial Services (AFSI).  We did a side-by-side comparison of the fundamentals to justify our view on both stocks.  Below is the comparative performance:

image

AFSI (in red) gained +181% compared to MHLD’s gain of ~82-85%.  As far was we can tell, MHLD is tracking closely to the performance of AFSI but by a dramatically lower magnitude.

The third ranked stock, in terms of performance, was American Safety Insurance Holdings (ASI) with a gain of +75% which was acquired by Fairfax Financial Holdings (FRFHF), considered to be the Berkshire Hathaway of Canada.

Technical Overview

So far, it appears that the iShares US Insurance ETF (IAK) is about to put in a double top or break through to a brand new high since the low of 2009.  The chart below has applied support levels based on the work of Charles H. Dow, co-founder of the Wall Street Journal.  The ascending $39.86 level has been a support only once in late October 2011.  Since that time, IAK has kept a considerable distance from the $39.86 “support” level.  It would take a –23.84% decline to achieve the  $39.86 level and a fall of –36.83% to get to the Dow Theory fair value level of $33.06.

image

Insurance Watch List

Below is the Insurance Watch List for October 30, 2015 and the analyst estimates for the respective stocks in the coming year.

Coppock Curve: October 2015

The market reversed a recent declining trend in October by increasing +8%.  Despite the reversal of the trend, the Coppock indicator continued its downward path.  The index fell 9.8 points and is only 32 points away from approaching negative territory.  As always, we remind our readers that the Coppock Curve serves as a buy signal when they it turns upward after moving into negative territory. Continue reading

International Business Machines

image

Wolverine World Wide

image