Gilead has the following downside targets:
- Japan
- Market Indicator
- Price Momentum Indicators
- Richard Russell
- Silver
- Speed Resistance Lines
- U.S. Dividend Watch List
In a recent article found on Bloomberg.com titled “Greenhill Adds Ex-Analyst Trone to Revive Wall Street Confidence”. We’re not so sure that a new investor relations rep is going to be that critical in reviving “Wall Street Confidence.” On July 22, 2011, we proposed the following to Greenhill & Co. (GHL) to gain greater confidence of investors and employees alike:
“Cutting the dividend would put Greenhill & Co. (GHL) in a better financial position to retain the staff necessary to get the mergers and acquisitions done. We recognize that the dividend, with a payout that exceeds current earnings, would further undermine the current stock price and pay less cash to the largest shareholders. However, maintaining such a high dividend leaves less cash available to pass on to their most valuable asset, the employees.”
In response to our request to cut the dividend, CEO Scott Bok replied by saying, in November 9, 2011:
“‘you’d have to waterboard me’ to persuade [me] to cut the firm’s quarterly dividend.”
Since July 2011, GHL has not cut the dividend and thus far it has been reflected in the stock price.
GHL has declined –54% which appears to be the tax on those seeking the dividend at the expense of the future growth of the company. The company can certainly turn things around, however, with a dividend payout ratio that exceeds earnings, the outcome seems obvious.
Posted in GHL
The NLO team executed the following transaction(s):
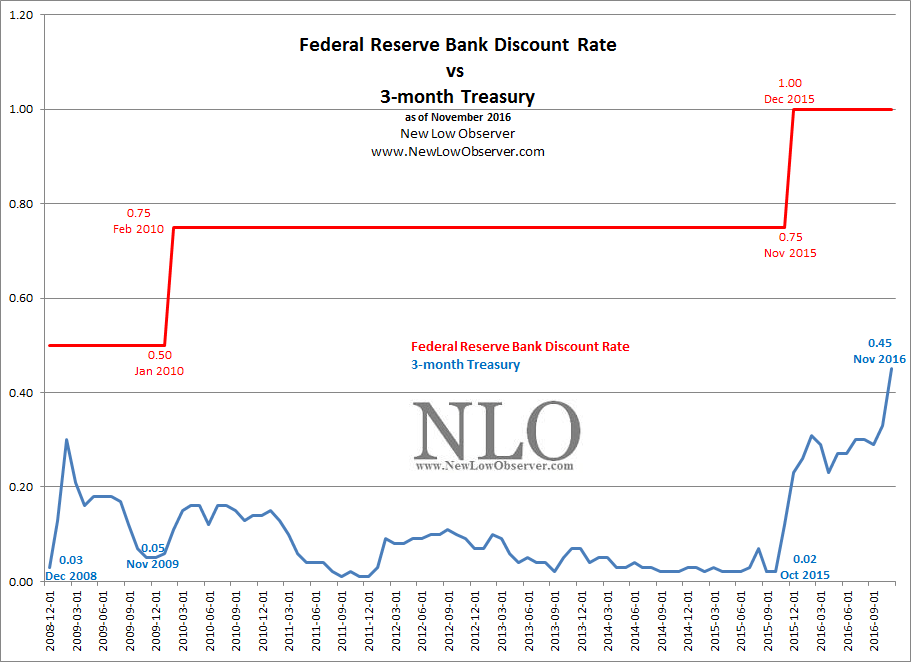
When talking to any number of clear headed and knowledgeable market analysts, it often shocks me at the confidence and certainty with which the Federal Reserve Bank is credited with the rebound of financials markets from 2009 to 2016. It appears as though this assessment is guided by faith alone and yet there are numbers that seem to support the claim. This article cannot dispel the religious reverence for the Federal Reserve’s apparent powers. However, it is hoped that we can demonstrate that the Federal Reserve may be a bit player on a grand stage of market forces.
Performance Review
Below is the performance of our Nasdaq 100 Watch List dated September 11, 2015. In addition, we have broken out the performance to the various categories that we assigned at that time.
The stocks that were favored by analysts to perform the best (high expectations) were unable to exceed the stocks that we highlighted as likely to do better than average. Stocks highlighted as “average risk” and “high risk” far exceeded the performance of the Nasdaq 100 index and notched better gains than “high expectation” stocks.
The worst three stocks were Western Digital (WDC), Bed Bath & Beyond and Mylan (MYL) at –41.69%, –24.91% and –17.47%, respectively. the best three stocks were Applied Materials (AMAT), Autodesk (ADSK) and Yahoo (YHOO) at +93.55%, +46.74% and +37.73%, respectively.
In our June 12, 2016 posting titled “Ritchie Brother: Inflection Point?” we said the following:
Since June 2016, RBA has managed to trace out the following price action (in red):
As the last bullet point indicated and the price chart has reflected, the parabolic move was resolved with a decline to the recent low of $27.27. Unfortunately, we now need another parabolic move from $27.27 to the recent jump above $35 to be resolved in some way or another.
Another item that was pointed out was the possibility that RBA could exceed a level in Edson Gould’s Altimeter, a level that had not been exceeded since 2011. The recent price action since June 2016 has allowed this to occur as well.
We’re still thinking that the rise to $48 is possible. The recent news of the acquisition by RBA of IronPlanet makes it more possible to hit our target. However, the recent price activity of going from $27 to $35 overnight based on an acquisition simply means that achieving the $48 target will take more time than we had anticipated.
Posted in Altimeter, Edson Gould, RBA
The latest run for Craft Brew Alliance (BREW) from the low set in November 2015 to the most recent peak on August 2016 requires that we check for the downside targets.
A parabolic peak is one thing. However, having them play out in a consistent fashion is something else. In the case of BREW, we’ve had two prior parabolic peaks since 2008 that were true to form and function. In the period from the 2008 low to the 2010 peak, BREW declined to below the mid-range Speed Resistance Line [SRL]. In the period from the 2008 low to the 2013 peak, BREW declined below the extreme downside target. In the chart above, we have the following downside targets:
Although there is no assurance that the stock needs to decline to the referenced downside targets, any parabolic move must be watch closely as entropy will kick in at some point. In this case, we believe that the ascending conservative target is a lock. With established history as an indication, the mid-range target looks to be a safe “bet” as well. We’ll check back in on this as more time has passed.
Posted in BREW, Edson Gould, entropy, parabolic, SRL
The NLO team executed the following transaction(s):
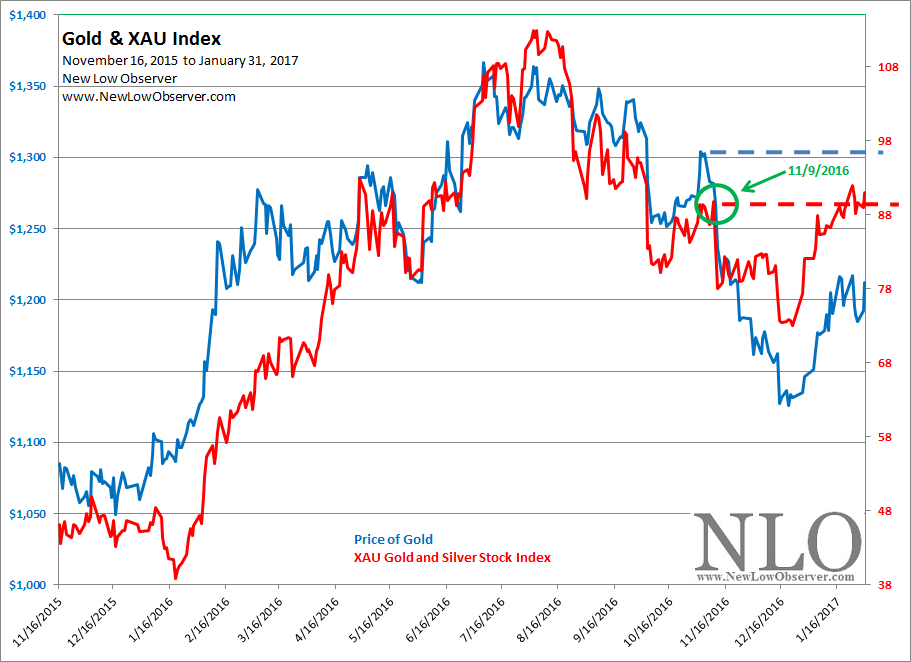
During the month of August the price of gold declined –2.28% while the Philadelphia Gold and Silver Stock Index declined –14.16%.
In this posting, we’ll highlight an area that we noted as a weakness in the run-up from the January 2016 low. We’ll also put Barron’s recommendation of GoldCorp (GG) into perspective with an approach for investors to apply when trying figure out which gold stocks to consider. Finally, as usual, we close with the performance of our current gold stock holdings.
Previous Year Performance Review
In our ongoing review of the NLO Dividend Watch List, we have taken the top five stocks on our list from August 28, 2015 and have checked the performance one year later. The top five companies on that list can be seen in the table below.
| Symbol | Name | 2015 Price | 2016 Price | % change |
| HY | Hyster-Yale Materials Handling, Inc. | 61.38 | 52.52 | -14.4% |
| TIF | Tiffany & Co. | 83.61 | 73.56 | -12.0% |
| VAL | Valspar Corp. | 74.20 | 105.46 | 42.1% |
| WSBC | WesBanco | 30.30 | 32.12 | 6.0% |
| SJI | South Jersey Industries | 24.47 | 29.77 | 21.7% |
| Average | 8.7% | |||
| DJI | Dow Jones Industrial | 16,643.01 | 18,395.40 | 10.5% |
| SPX | S&P 500 | 1,988.87 | 2,169.04 | 9.1% |
Our average gain from the top five companies was 8.7%. The biggest gain came from Valspar (VAL) (+42%) which received a take over bid from Sherwin-Williams. The biggest decline came from Hyster-Yale Materials (HY). Although we view Hyster-Yale as a company with strong balance sheet, we expected shares to trade lower as expectation were lowered. Below is an excerpt from last year.
Statistically, the HY has decent fundamentals. The company returns 6.7% on its capital and 19% on equity invested. With total cash on hand of $99 million, $54 million in total debt, and $72 million in free cash flow, the company would likely survive the next recession with a strong balance sheet. The street is expecting profit to rise 15% but we'll suspect that a revision downward will occur in the weeks to come and possibly drive shares even lower. Because of the strong balance sheet, further analysis of this company is highly recommended.
U.S. Dividend Watch List: August 26, 2016
The S&P 500 lost 0.7% for the week but remain close to its all-time high. At the end of the week, there are 15 companies on our watch list. Continue reading
Posted in Dividend Achiever Watch List, Dividend Achievers, Dividend Watch List
Tagged members
The NLO team executed the following transaction(s):
On August 21, 2009, we said the following:
“Based on the combination of the Dow Theory confirmation of July 23, 2009 and the IPI turning up from the June low, I will have to guess that the National Bureau of Economic Research (NBER) is going to proclaim June 2009 as the official end to the recession. The end to this recession will be lackluster and questioned from all corners.
“Additionally, the stock market will only follow the pattern of a cyclical bull market (bear market rally) within a secular (long term) bear market. I doubt that the general public will agree that the recession is over since jobs will not be as plentiful as the past.”
Below is the September 20, 2010 announcement from the National Bureau of Economic Research that the recession had officially ended in June 2009:
In addition, the jobs data has been lackluster as is par for the course but was anticipated in our August 2009 review.
Many claim that the employment data is rigged to reflect favorably for whichever politician that is in power at the time, so we have included the U-6 TOTAL unemployment data to verify if the economic environment really did turn around at or near the same period in time.
From all appearances, the turn in the economy did arrive at the time that we thought that it should. There are critics who say that the U-6 TOTAL unemployment data isn’t as low as it was at the 2007 period and therefore we aren’t in a recovery. However, to achieve a low in the U-6 TOTAL unemployment you would need the clearly obvious bubble economy that we experienced at the peak of 2007. Anyone who wants the same U-6 TOTAL unemployment as the 2007 period also wants the subsequent bust that is required of such a period.
We haven’t had as much luck calling a top in the economy as we had in calling the bottom. On two occasions we had Dow Theory bear market indications which turned out to be false and in one instance, we’ve had the Industrial Production Index in decline. However, we haven’t had both occur at the same time allowing us to make the call that the economy was entering a recession.
What are the odds that such a coincidence (saying that the recession was over a year before the NBER, that no one would believe it, that unemployment would be lackluster and that a bull market was in effect) could occur? Got lucky is all we can say.
The chart below breaks down the performance of the stocks from the Canadian Dividend Watch List from August 2015. We’ve decided to take a different tack than in the past by showing the performance of the watch list based on the analyst estimates that projected stocks that would increase in value in the following year (darlings), decrease in value (bums), the 2015 watchlist and the Toronto Stock Exchange (TSE).
As we said of the bums last year, “stocks that are considered to decline in price should be examined first and eliminated based fundamental and technical factors. Stocks slated to gain the most should be considered high risk.” All stock are not created equal, however, stocks that have lower expectations by analysts should be considered first for their investment merit. The darlings underperformed the Toronto Stock Exchange while the entire August 2015 watchlist exceeded the performance of the TSE by an average of +1.50%.
In a recent article on SeekingAlpha.com titled “The Bigger The Boom, The Bigger The Bust” by William Koldus, it was suggested that:
In our review of Koldus’ work, we’ll attempt to demonstrate that analysis on stock market history should not begin with evidence that is narrowly defined. Our introduction of secular trends in the market might help put current market moves into perspective. We’ll also show that the Federal Reserve might not be as powerful as some might think. Finally, we hope to demonstrate that a moving market, either up or down, is good regardless of the extent and timing.
Posted in cycle analysis, Dakin, Dewey, Federal Reserve Bank, interest rates