Below is a chart of Methanex (MEOH) from 1993 to 2019 reflecting the year-over-year (YoY) percentage change. Continue reading
-
Topics
Archives
-
-
Recent Posts
-
-
-
-

Below is a chart of Methanex (MEOH) from 1993 to 2019 reflecting the year-over-year (YoY) percentage change. Continue reading
Below are the valuation targets for Methanex Corp. (MEOH) over the next 10 years. Continue reading
Posted in 10-year Targets, Altimeter, MEOH
Below is a chart of Costco Wholesale Corp. (COST) from 1986 to 2019.
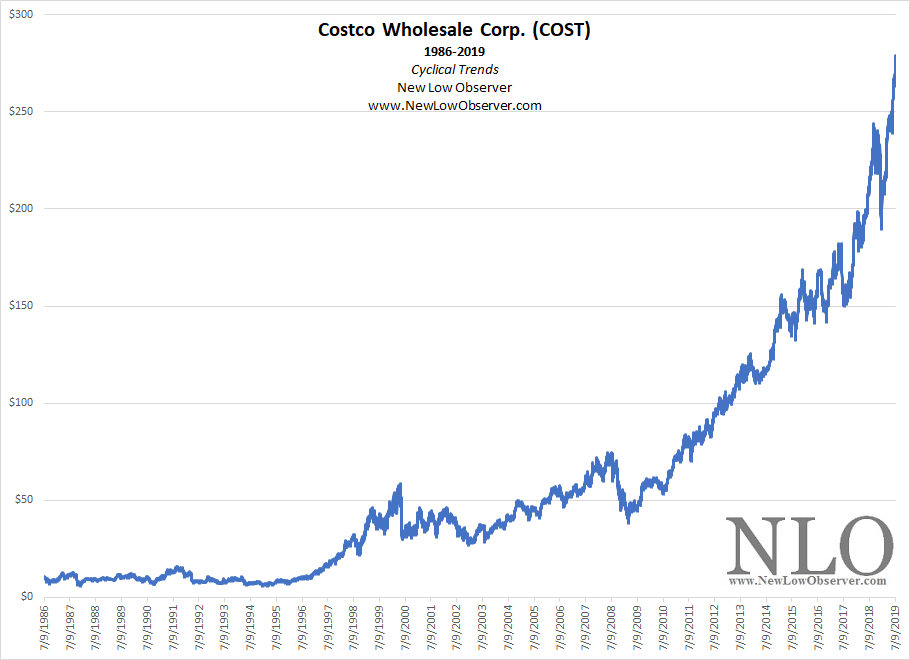
In the charts that follow, we break down the percentage change in each cyclical rise and decline of Costco. These cyclical changes put into perspective the current rise and help to gauge what to expect when the next cyclical decline arrives while suggesting there might be more room to the upside. Continue reading
Posted in COST, Cyclical Trends
Below are the valuation targets for W.W. Grainger (GWW) over the next 10 years. Continue reading
Below are the valuation targets for Onex Corporation (ONEX.TO) over the next 10 years. Continue reading
On January 22, 2019, we said the following of Gluskin Sheff:
“Gluskin Sheff has an expected price range of $13.46-$48.08 by 2021-2023. However, the absence of a dividend increase since 2016 and a decline below the undervalued level suggest that, at best, GS.TO can only increase to the “fair value” target price under favorable conditions.”
On March 22, 2019, Onex Corporation (ONEX.TO) announced that they would acquire Gluskin Sheff (GS.TO) for $14.25. Below are the final Altimeter and target ranges for GS.TO.

Overvalued and Undervalued levels since 2006 are as follows:

Our take on the acquisition is that Onex got a bargain with their well timed purchase. We will now track Onex Corp. (ONEX.TO) with updated target prices going forward.
Posted in 10-year Targets, Altimeter, GS.TO
There are only two levels to beat for a confirmed bull market to ensue. Continue reading
On January 1, 2019, we posted our list of the “Dogs of the Dow”. In that list we broke down all the categories that we track. Our closing remark was as followings:
“Our preference is for stocks in the highest p/e or lowest yield stocks.”
Our preference is based on evidence going back to 1996, which shows that low yielding stocks don’t outperform the index which is contrary to Michael O’Higgins book Dogs of the Dow,which claims that the way to beat the index is to invest in the ten highest yielding stocks at the beginning of each year.
Additionally, the data has demonstrated that stocks with the highest p/e or lowest yield generally beat the index and crush the highest yielding stocks. Below, we list the performance of the various categories of Dow Jones Industrial Average stocks as compared to the index.
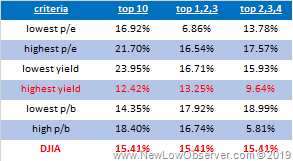
So far, the best performing category of stocks among the top ten, which is the best relative comparison to the top ten highest yielding stocks, is the lowest yielding stocks with a gain of +23.95%. This gain exceeds the top ten highest yielding stocks by nearly 100%.
Not to be outdone, the ten highest p/e stocks gained +21.70% as compared to the ten highest yielding stocks with a gain of +12.42%.
The changes related to DowDuPont (DWDP) has had a material impact on the data and has been excluded from the categories of the “ten highest p/e”, “ten lowest p/b”, and the “lowest 2,3,4: lowest p/b”.
If the next best stock were added to the “ten highest p/e” category it would have increased the return to +22.92%, the “ten lowest p/b” group would have seen a reduction from +14.35% to +13.16% while adding CVX to the “lowest 2,3,4: lowest p/b” reduced the category performance.
Below is the individual breakdown of the stocks and their performance. The data is as of July 5, 2019. Continue reading
Posted in Dogs of the Dow
Previous Year Performance Review
In our ongoing review of the NLO Dividend Watch List, we have taken the top five stocks on our list from July 6, 2018 and have checked the performance one year later. The top five companies on that list can be seen in the table below.
| Symbol | Name | 2018 Price | 2019 Price | % change |
| LM | Legg Mason | 34.32 | 37.96 | 10.6% |
| SWK | Stanley Black & Decker | 133.14 | 146.52 | 10.0% |
| IVZ | Invesco Ltd. | 26.44 | 20.97 | -20.7% |
| CMI | Cummins Inc. | 131.40 | 169.15 | 28.7% |
| FULT | Fulton Financial Corp. | 16.65 | 16.57 | -0.5% |
| Average | 5.6% | |||
| DJI | Dow Jones Industrial | 24,456.48 | 26,922.12 | 10.1% |
| SPX | S&P 500 | 2,759.82 | 2,990.41 | 8.4% |
The top five companies slightly underperformed the market. The best performer was Cummins (CMI) which is a major industrial company operating in the natural gas market. Cummins raised their dividend payment by 5%, from $1.08 to $1.14. The share price increase of +29% could be attributed to a strong gain in the net income. At the time of our writing last year, EPS were at $5.56 with projected EPS for 2018 to be at $14.07, current EPS (TTM) is at $15.41.
Our team said Legg Mason (LM) was setting up to be a good long-term accumulation and shares rose +10.60% in one year. However, share fell -32% hitting $23.51 before rebounding to $37.96. That's a 62% swing in share price to the upside. This type of action helps reaffirm our strategy of multi-stage purchases which could involve buying 1/3 or 1/2 of the position with the anticipation for further declines.

Another company we highlighted was 3M (MMM) which lost -13% of its value in one year. Shares were trading at a 2.50% dividend yield one year ago and the yield is currently at 3.30%. 3M raised their dividend 5.80%, from $1.36 to $1.44. Our 10-year target suggests that 3M is undervalued and should be considered for long-term accumulation.
U.S Dividend Watch List: July 5, 2019
The S&P 500 and the Dow Jones Industrial Average pushed through their all-time highs this week. This upward movement isn't confirmed by the Transportion index which is about 10% off the peak. Naturally a rise in the market leads to lower number of companies trading near their yearly low. Below is our watch list. Continue reading
Posted in Dividend Achiever Watch List, Dividend Achievers, Dividend Watch List
Tagged members
Below are the valuation targets for Worthington Industries Inc. (WOR) for the next 10 years. Continue reading
Below are the valuation targets for Rockwell Automation (ROK) for the next 10 years. Continue reading
The NLO team executed the following transaction(s): Continue reading
A common theme in rationalizing the rise of stocks prices from the low in 2009 to the current level of 2019 has been to say that company buybacks, the buying back of their own shares which artificially boost per share earnings and therefore the share price in subsequent earnings announcements, is the reason.
Although we’re not at the end of the decade, from 2010 to 2019, we have reviewed the number of New York Times articles on the topic of “buyback” and “stock” and compared it to prior decades.
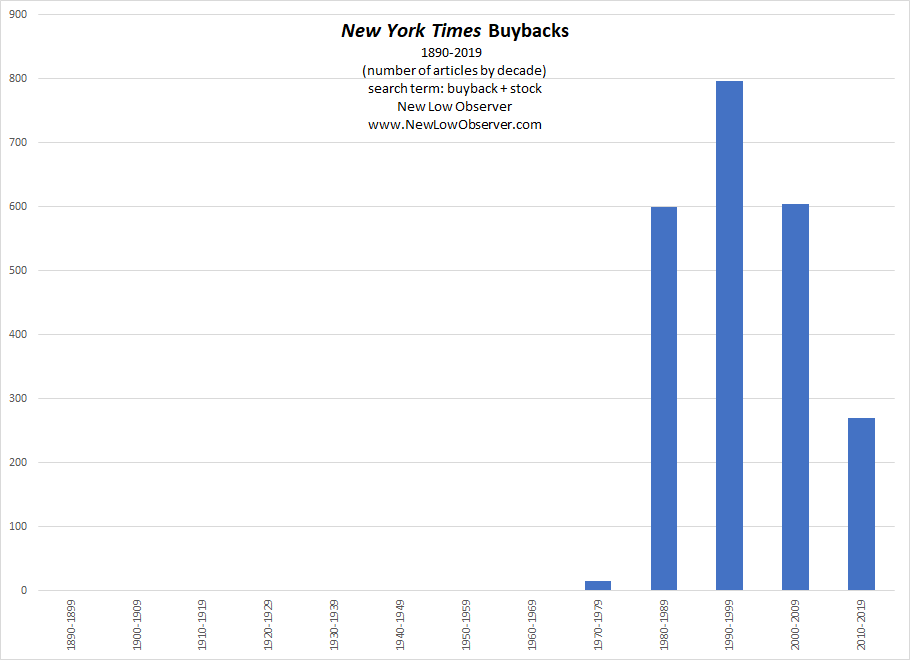
On a relative basis, the period from 2010 to 2019 is a long way off from approaching the next highest decade of the 1980’s.
What does the data suggest? First, buybacks have had relatively little impact on the market’s rise since 2010. Additionally, at the current level, when/if buybacks exceed prior highs the stock market could be significantly above 27,000 on the Dow Jones Industrial Average.
See Also:
Posted in buyback, New York Times
Below is a chart of Altria (Philip Morris) from 1920 to 1987.
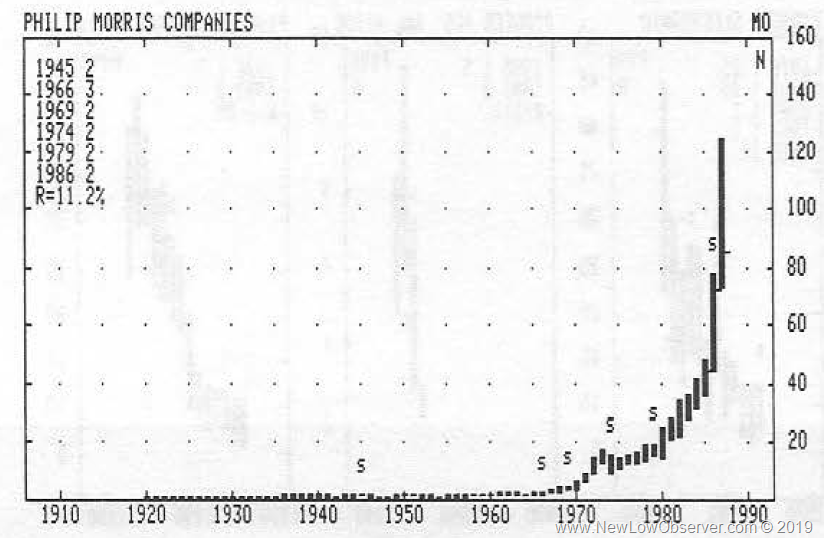
See our 10-Year price targets for MO at the following link (here).
Posted in 1920, 1987, Altria, Chart of the Day, MO
According to Coindesk, Bitcoin achieved a high of $13,884.77 on June 26, 2019. Based on the data provided by Coindesk, we have the following downside targets: Continue reading