

In the above commentary, it is mentioned that Richard Russell would have a lot to say about the change in the price of United Parcel Service (UPS). Leaving aside the fact that UPS is experiencing the classic pandemic roundtrip (February 25, 2020) which was pointed out as a prospect on August 6, 2024, there is also our commentary from August 6, 2025 which suggested that the stock was being stymied by the tariffs.
On the whole, what we’ve seen in the price of UPS can reasonably be explained. However, we’re here for the Richard Russell commentary which at times can be contradictory to the fundamentals of Dow Theory. Critical to understanding Russell is knowing that from the 1980s to 2015, Russell seldom recommended individual stocks. This is in contrast to the period from the 1950s to 1970s where Russell recommended individual stocks quite frequently. This suggests that when StealthQE4 claims that Russell “would be all over this” it means that Russell would have been all over the idea of where the Dow Jones Transportation Index might be relative to the Dow Jones Industrial Average.
In the case of the Dow Jones Transportation Average specifically, we think Russell would say that it has traded in range since January 2021 (defined as a Line in Dow Theory) while not confirming the new highs made by the Dow Jones Industrial Average. This lack of a new high in both indexes is considered a divergence in Dow Theory.

A divergence has a specific meaning that is critical to understanding Dow Theory. If the market signal prior to the divergence was bullish, this means that the signal is still bullish but with cautious and potentially bearish implication. Likewise, if the market signal prior to the divergence was bearish, it means that the signal is still bearish with potentially bullish implications. In each instance, the signal of the market going into the divergence is the prevailing market condition and does not change until both indexes make new highs or new lows.
Russell would point out that the Transports trading in a range is an indicator (a Line within a divergence) of something big on the horizon for the overall market. One example of this is the divergence between the Dow Jones Industrial Average and the Dow Jones Transportation Average from 1976-1982.
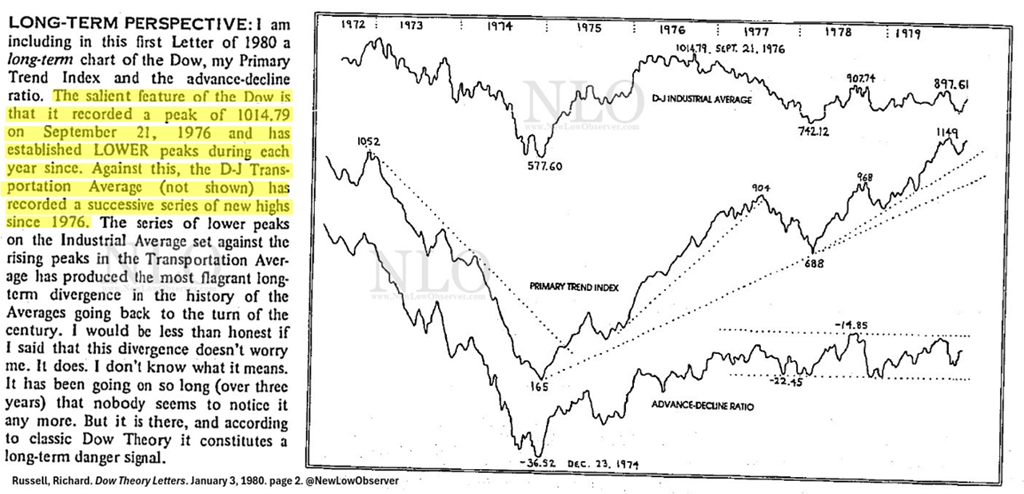
At that time, the Industrial Average had made a high in 1976 and did not make a permanent new high until October 1982. That 1982 breakout was the beginning of a new bull market that saw the Dow g0 15 years in a row without a low below the prior year.
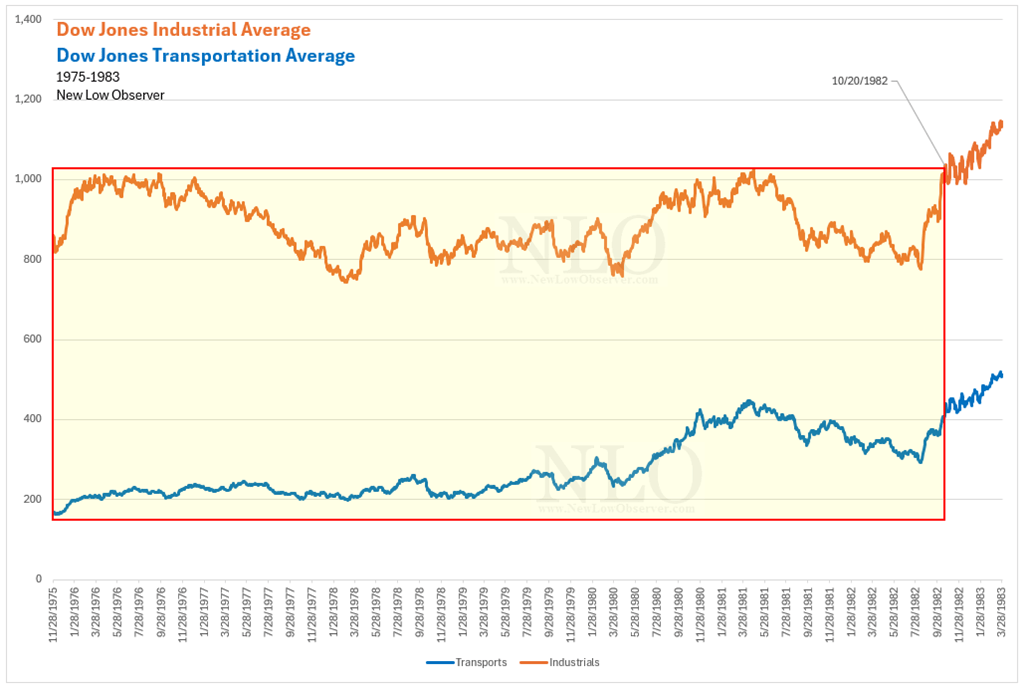
At this stage, it is necessary to point out that a divergence of the two indexes lasted nearly seven years. This compares to the 4 years of divergence that we’ve seen in the indexes (Industrials & Transports) since 2021. This suggests that we should not be surprised if a divergence lasts another 3 years.
However, there is the remote possibility that, as with the extreme divergence from 1976-1982, we could conclude with a similar outcome (after 1-3 more years of divergence). That outcome was a bull market run that took the Dow Jones Industrial Average from 1,000 to over 10,000. It should be reminded that Dow Theory says that we should not hope for a particular outcome but assess as best we can. Therefore, we emphasis the remoteness of the bullish scenario.
Richard Russell mentions another period of divergence between the Dow Jones Transportation Average and the Dow Jones Industrial Average that occurred in August 1990. This was a time when the economy was in a recession.

At the time, Russell said:
“By the way, the current divergence (Dow holding while the Transports and A-D ratio decline) is as spectacular as any I’ve seen in 40 years of watching markets. Spectacular and extended divergences usually lead to spectacular price movements.”
We don’t want to foster hope in the markets, however, the “spectacular price movements” could easily be seen in the Nasdaq 100 Index after August 1990.

We bring up the Nasdaq 100 index because it is important connect the disparate parts of the market that are inextricably connected even though the data and analysis was done on the old indexes.
In 1995, Russell had the following to say of the Transports relative to the Industrials:
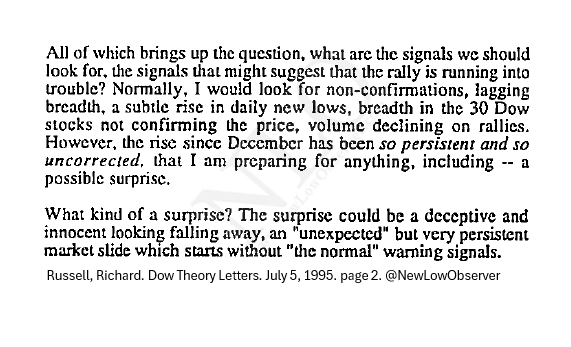
Naturally, Richard Russell was bearish having grown up in the Depression. However, this is a parting of the way when it comes to understanding Dow Theory as it set up for the hope of an outcome, typically bearish, which is not what the theory is about.
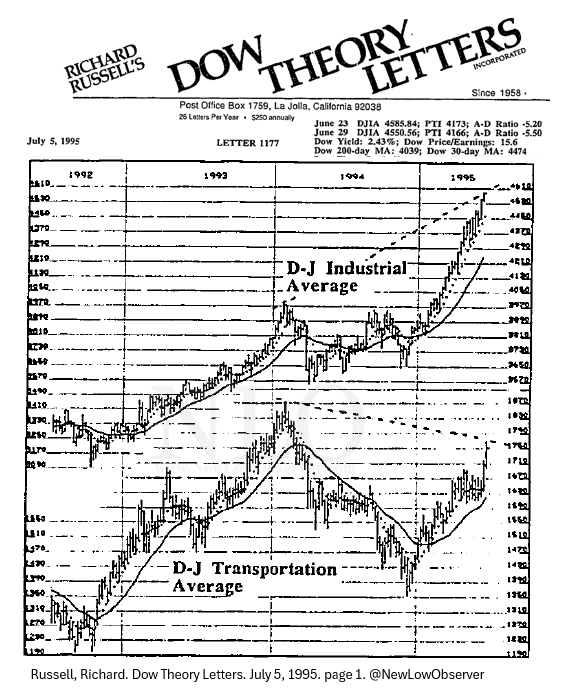
The end of the divergences between the Industrials and Transports after 1995 concluded with a breakout to a new high in the Transports leading to the 2000 peak in the stock market.
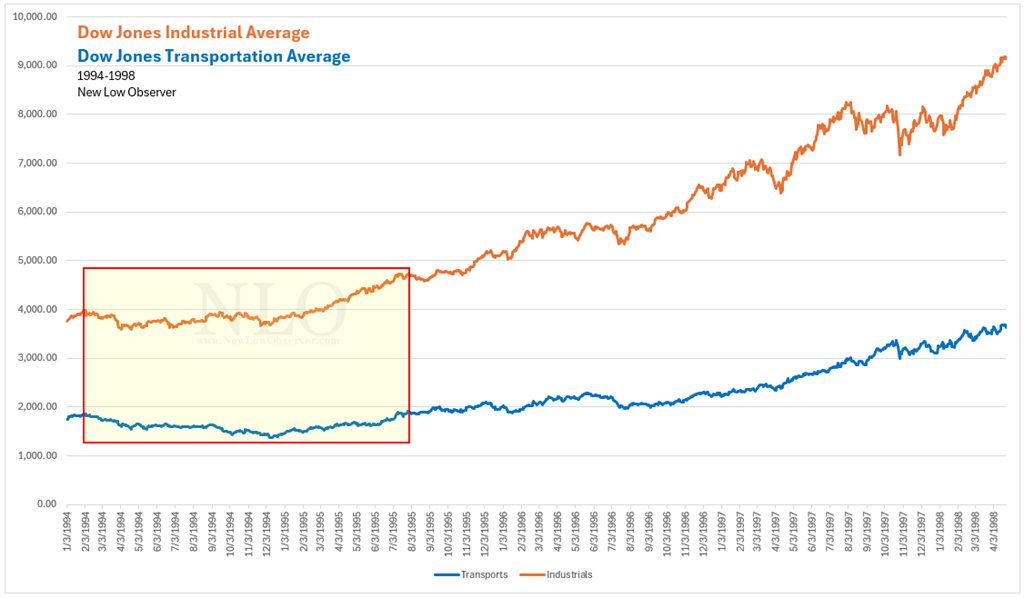
Richard Russsell’s view on Divergences Between the Transports & Industrials:
-
1976-1982: Industrials failed to make new highs, long term danger signal
-
Massive Bull market followed
-
1990-1994: Transports failed to make new highs, spectacular movement coming
-
Tech bubble follows
-
1994-1998: Transports failed to make new highs, a surprise coming like a persistent market slide
-
Parabolic move in tech
Now, let’s clear the air, while we admire Richard Russell, we’re critical readers of his work. Part of being good Dow Theorists means being critical readers WHILE seeing the flaws. In the case of Russell, his flaw was being biased towards the bearish side. In fact, our bias is also in the same realm of bearish. However, to get the full mileage out of Dow Theory, we have to view all claims with evidence from the market, in spite of our own personal bearish slant.
So where would we be in terms of the William Peter Hamilton version of Dow’s Theory as codified by Robert Rhea (which is different for Charles H. Dow’s version of the theory)?
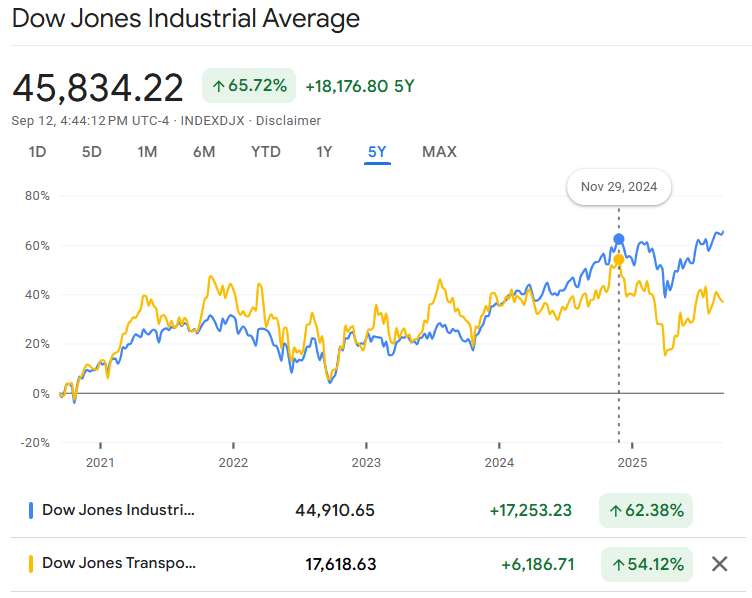
The joint new highs in the Industrials and Transports after the 2022 lows confirms that we are in a bullish market position. At the same time, the Transports, trading in a extend range, (called a Line by Robert Rhea) holds implications for a big move if it breaks down, or out.
Dow’s Theory of a Line
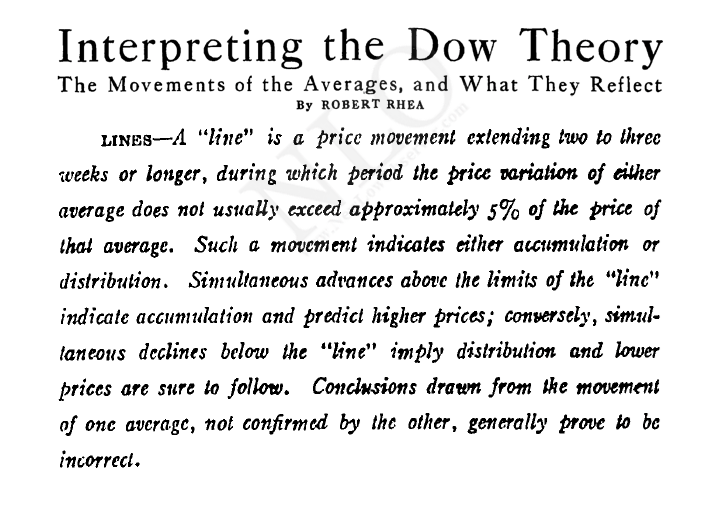
Don’t get stuck in the concept of timing and percentages when it comes to Lines as part of divergences. Focus on the broader implications of Lines.
Richard Russell’s prior thoughts are deeply rooted in Dow Theory. In fact, this from Charles H. Dow on October 13, 1899:
“The longer time, moreover, that the market remains dull [in a narrow range] the more important is the movement likely to be.”
Later enhancement of this idea was offered by Robert Rhea in his 1932 book The Dow Theory:
“Such a narrow fluctuation, to the experienced student of the averages, may be as significant as a sharp movement in either direction.” - page 82.
Our own refinement of this idea is as follows:
“A trading range can be more significant than a crash.”
If that trading range in the Transportation Average is resolved with a declining trend (and a declining Dow Jones Industrial Average) then we should not be surprised by strong move to the downside. Alternatively, a rise above the trading range in the Transportation Average (with a rise in the Dow Jones Industrial Average) would imply a substantial move to the upside. Always assume the worst case scenario.
See also: