Monthly Archives: February 2016

Nasdaq 100 Watch List: February 26, 2016

Performance Review

Below is the percentage change in the stocks that appeared on our February 22, 2015 watch list:

symbol name 2015 2016 % chg
GRMN Garmin Ltd. 49.42 40.4 -18.25%
MAT Mattel, Inc. 25.77 32.47 26.00%
NUAN Nuance Communications, Inc. 14.02 19.59 39.73%
FAST Fastenal Company 42.76 45.22 5.75%
FOSL Fossil Group, Inc. 85.14 47.04 -44.75%
DISCA Discovery Communications, Inc. 30.93 25.08 -18.91%
KLAC KLA-Tencor Corporation 64.97 67.97 4.62%

The average performance of the entire watch list was –0.83% while the Nasdaq 100 index declined –4.81%.  A stock that we had some interest in was Garmin (GRMN).  In our commentary we said the following:

“There is no hard and fast rule for what has occurred in a generally rising market.  However, it is well worth the time to examine the investment merit of GRMN when the stock has fallen –29% or more.”

In the case of Garmin, falling –29% from the prior peak would have meant that the stock would at $43.80 or lower.  GRMN did not achieve this until early July 2015.  Since that time, GRMN has fallen an additional –31%.  At the current time, GRMN has not achieved the breakeven level of $43.80.

Watch List and Analyst Estimates

Below is the latest Nasdaq 100 Watch List for February 2016.

Richard Russell Review: Letter 449

Bear Market Declines

“Historically, bear markets tend to last 1/3 to ½ as long as the preceding bull markets. Since this bear market is in the process of correcting the 17-year bull market of 1949 to 1966, a rough rule-of-thumb would be that the bear market could last five to eight years (and I will be optimistic in that I hope it lasts nearer to five than eight). However, the interesting part of the picture is that with four years out of the way, the worst the Dow Industrials have done is to decline from their 1966 peak of 995.15 to their 1966 low of 744.32, a total drop of 251 points (Russell, Richard. Dow Theory Letters. January 7, 1970. Letter 449. Page 1.).”

As a “rule-of-thumb”, the 1/3 to ½ (in terms of duration) extent of a bear market decline is pretty good and very consistent. The examples are many and the data is clear. First, let’s take the 1966 peak as the beginning of the bear market. From that time, the ultimate low in the stock market was December 1974. This was eight years from the 1966 peak. True stock market enthusiasts would argue that the bear market for stocks did not end until 1982, when the Dow Jones Industrial Average “permanently” broke above the mythical 1000 level and never looked back. Die hard market historians make a credible claim that the bear market did not end until the inflation-adjusted low achieved in 1978 or 1982.

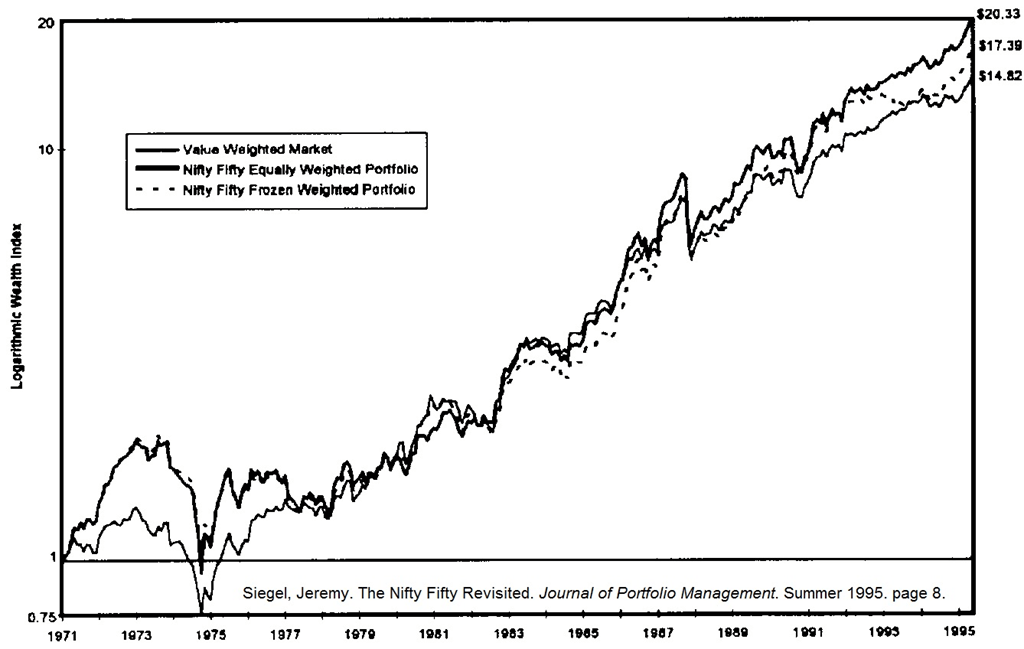
However, based on the work of Jeremy Siegel (“The Nifty-Fifty Revisited: Do Growth Stocks Ultimately Justify Their Price?” [PDF download]), even if a person had bought the “Go-Go” or “Nifty Fifty” stocks at the 1966 or 1971 peak, investors would have achieved exceptional gains in spite of the high inflation rates until 1982 (by the end of 1995, in support of the “buy-and-hold” strategy).

image

The amount of time that passed from the 2007 peak to the 2009 low was 18 months. This was 38% of the bull market that preceded it from 2003 to 2007. The decline was severe and few would be in the position to stomach the extent of the decline, however, the rebound was inevitable and equally as vicious.

Our default view generally gravitates towards the stock market crash of 1929 to 1932. Even our cautiously optimistic analysis should be thwarted by one of the worst bear markets in history. However, taking note of the fact that the bull market “officially” began in 1921 and unofficially in 1907 or 1915, it is clear that the rule-of-thumb holds up.

Market enthusiasts will often retort that the bear market ends when the market recovers beyond the previous peak as the majority of investors buy near the last market peak. This is a valid point and yet, investing is made better by understanding that the majority is usually wrong and therefore should fight the urge to commit 100% of their investment capital as the market climbs higher and ensure that saved funds are 100% invested as the market falls. There are many benchmarks for determining how low is low enough before 100% of funds are committed so being close enough is better than succumbing to the fear of a falling market.

Continue reading

U.S. Dividend Watch List: February 19, 2016

Top Five Watch List Performance Review

In our ongoing review of the NLO Dividend Watch List, we have taken the top five stocks on our list from February 20, 2015 and have checked the performance one year later. The top five companies on that list can be seen in the table below.

Symbol Name 2013 Price 2014 Price % change
RAVN Raven Industries 20.87 15.12 -27.6%
CTBI Community Trust BanCorp. 32.49 33.60 3.4%
GRC Gorman-Rupp Company 28.67 25.25 -11.9%
ANAT American National Insurance 105.61 98.30 -6.9%
XOM Exxon Mobil Corp. 89.92 82.50 -8.3%
      Average -10.2%
         
DJI Dow Jones Industrial 18,140.44 16,391.99 -9.6%
SPX S&P 500 2,110.30 1,917.78 -9.1%

Watch List Review

Our top five under performed with the market slightly.  Worst performer was Raven Industries (RAVN) which lost more than a quarter of its value.  We were neutral on shares a year ago.  With net earning falling by 60%, more downside is possible even after a large decline.  However, Raven has an extremely strong balance sheet.  It has no debt while maintaining constant level of shares outstanding.  Leverage free cash flow has been positive, albeit declining.   Surviving this industrial downturn would make Raven hard to ignore.  But until the stock fall additional 30-40%, we are not that excited about the stock yet.

Another company with zero debt we mentioned was Gorman-Rupp (GRC).  The company has managed its balance sheet well and have not diluted its shareholders with more shares.  Even after falling 11% from 2015, we believe a possible downside of 37% is possible with maximum upside of 34%.  As such, the risk/reward is not good enough for us to consider this company yet.

Oil has fallen further since last year and so have all oil related companies.  Largest integrated oil company isn’t immune to the down turn.  Exxon Mobil (XOM) fell 8.3% since that write up.  We took position about one week prior to that and remain long.  Our view of the company has not change by much and the fact that Exxon have not cut dividend and appear to be able to maintain it, make us feel rather comfortable holding shares.

U.S. Dividend Watch List: February 19, 2016

The market closed the week up 4.85% and brought many companies away from the low.   Below are 27 companies that appears on our dividend watch list. Continue reading

Insurance Watch List: February 2016

Performance Review

From our watch list dated February 28, 2014, we have the following performance of the listed stocks:

Symbol Name 2014 2016 % change
BRO Brown & Brown 30.1 31.48 4.58%
WSH Willis Group 41.16 44.61 8.38%
XL XL Group plc 30.4 34.28 12.76%
PKIN Pekin Life 11.99 12.4 3.42%
AXS Axis Capital 43.97 53.97 22.74%

The average gain for the listed stocks was +10.38% as compared to the iShares U.S. Insurance ETF (IAK) which gained +4.25% over the same period of time (February 28, 2014 to February 21, 2016).  Although we use IAK as a benchmark for performance, it should be noted that companies like WSH [now Willis Tower Watson (WLTW) after the merger in 2015], XL and AXS are not U.S. based insurance companies.   The stock of interest at the time was Brown & Brown (BRO) which increased +4.58%.

Continue reading

Quick Take:Suburban Propane

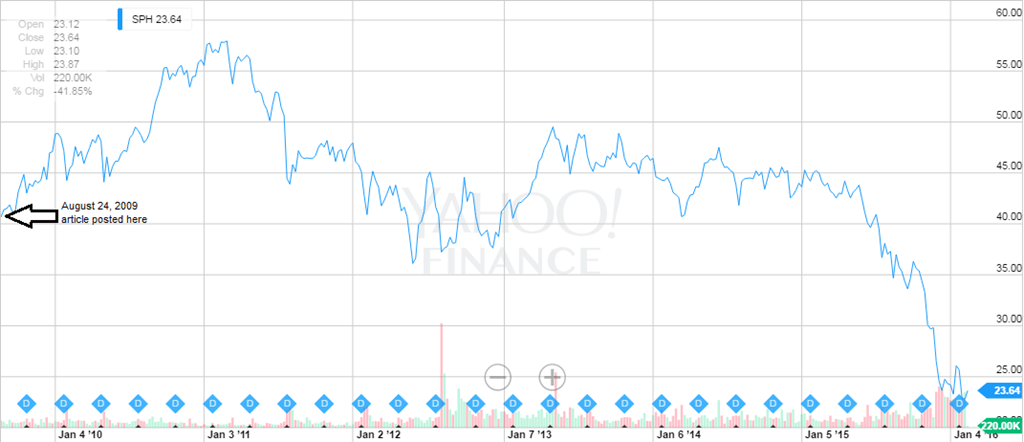
On August 24, 2009, we posted a blurb on Suburban Propane (SPH) titled “Suburban Propane (SPH) Says, ‘Just Add Water’”.  In that piece, we suggested that the shares of SPH were overvalued with the following commentary:

“SPH basically said that it was going to pay down debt with the money raised from the sale of the stock. So what they're doing is watering down the stock (diluting per share earnings) in a maneuver known as ‘Robbing Peter to Pay Paul’ method of accounting. You've got to admit, it is a great strategy from the perspective of the company with overvalued shares but current shareholders are getting the shaft.”

Since August 2009, SPH has followed along a rollercoaster ride going as high as $58 in 2011 and most recently as low as $20.93.

image

As the stock has decline over –40% since our August 2009 posting, we believe now is a good time to review SPH.

Canadian Dividend Watch List: February 2016

Performance Review

On February 18, 2015, we generated the following list of stocks for consideration with their respective performance one year later:

Symbol Name 2015 2016 % chg
BEI-UN.TO Boardwalk REIT 60.69 42.00 -30.80%
IGM.TO IGM Financial Inc. 44.68 33.61 -24.78%
ACO-X.TO ATCO LTD., CL.I, NV 46.76 37.90 -18.95%
CJR-B.TO Corus Entertainment Inc. 21.73 9.32 -57.11%
CM.TO CIBC 95.39 89.01 -6.69%
REF-UN.TO Canadian REIT 47.05 39.90 -15.20%
RY.TO Royal Bank of Canada 77.70 69.41 -10.67%
HCG.TO Home Capital Group Inc. 43.30 29.86 -31.04%

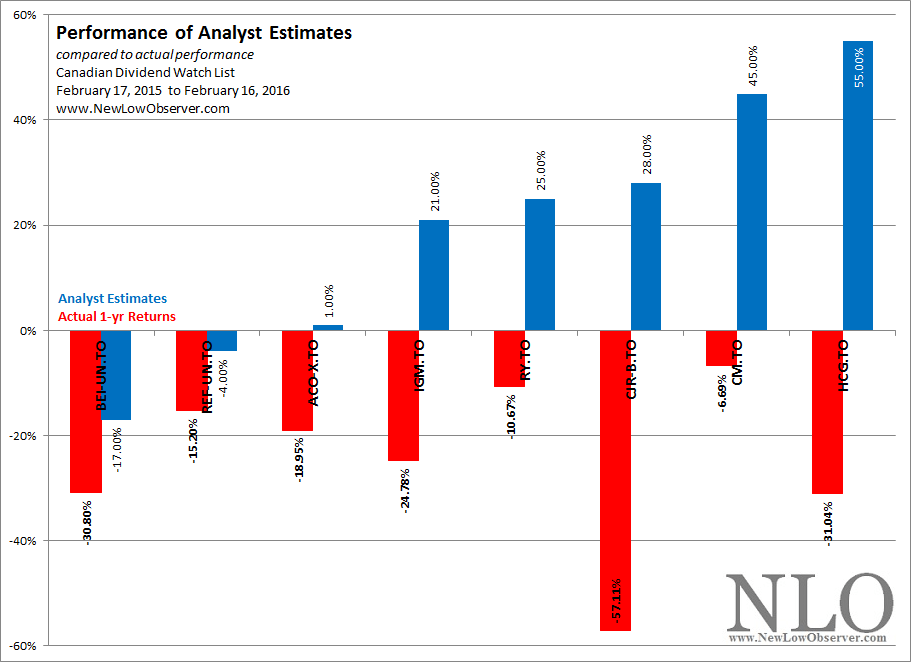
There was little surprise in the performance of the stocks on the watch list.  As a group (equally weighted) the average change was –24.40% compared to the Toronto Stock Exchange decline of –17.49%.

image

The analysts were off target for their 1-year projections.  Only Canadian REIT (REF-UN.TO) and Boardwalk REIT (BEI-UN.TO) came close (somewhat) to the analyst targets.

A stock of particular interest to us was Home Capital Group (HCG.TO).  At the time we said the following of HCG.TO:

“Applying Speed Resistance Lines to HCG.TO, we see that the stock has already declined to the conservative downside target of $37.92.  Because it appears that we are in the early stages of the economic decline in Canada, HCG.TO might be worth watching to see if the stock can decline to the $28.21 level.  The extreme downside target is $18.51 which confirms the Altimeter low of $20.80.  HCG.TO should be considered in three stages starting below the ascending $37.92, $28.21 and $18.51 levels.”

Not surprisingly, HCG.TO declined as low as 23.16 on January 15, 2016.  This has set the stage for our latest risk assessment (as noted below).

Analyst Estimates: U.S. Dividend Watch List

Below are the price projections based on analyst earnings estimates for on our recent U.S. Dividend Watch List dated February 12, 2016. These estimates project the price change for the respective stocks over the next 12 months.

U.S. Dividend Watch List: February 12, 2016

It was another wild week for the market with extreme volatility setting in. The market ended the week down -0.80% and is off by -8.70% year-to-date. USO which is a proxy for oil fell -19% for the year while IAU which is a proxy for gold rose +16.70%. While weakness in the market may bring anxiety to investors, those with a longer-term perspective should embrace the recent trend and move towards a net buyer stance. At the end of the week, there are 30 companies on our watch list. Continue reading

Gold Stock Indicator: February 12, 2016

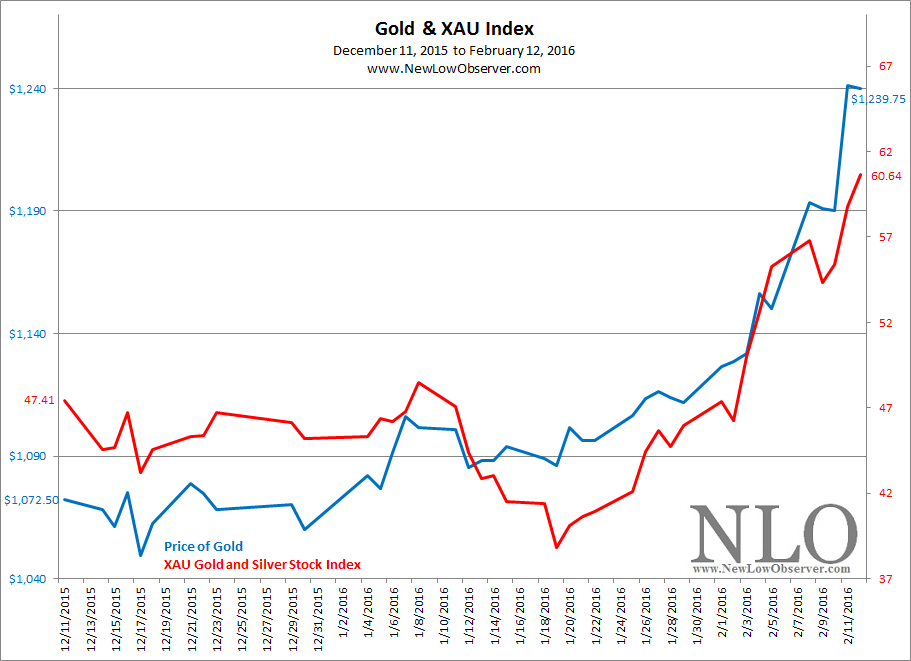
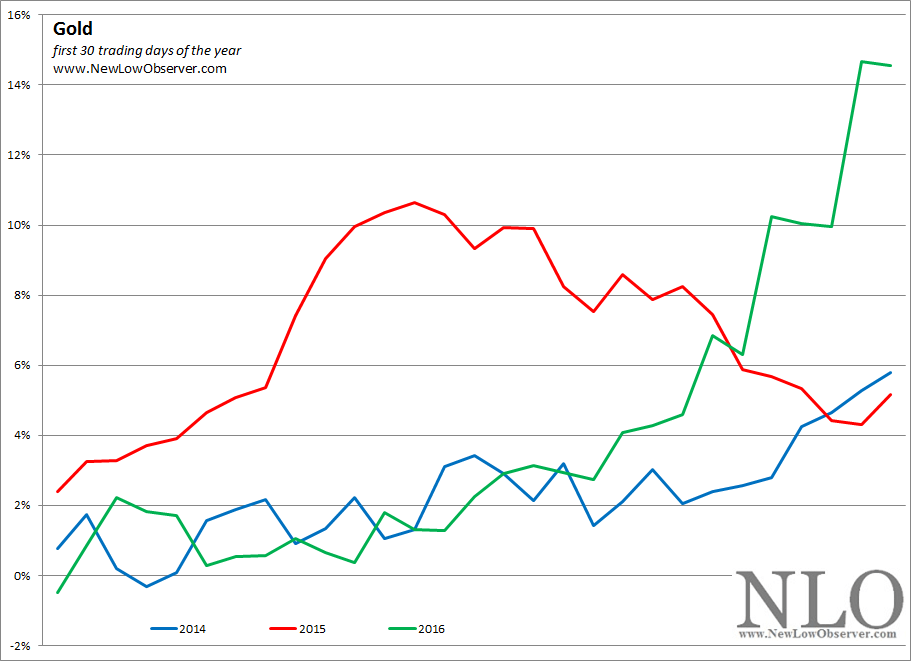
Gold and gold stocks have made a turnaround in the declining trend that has persisted over the last several years.  The reactions to a dramatic rise or fall in commodity prices is usually equal in violence and magnitude.  Gold has increased +15.59% while gold stock has increased +27.90% since our last posting.

image

There is a lot of excitement in the gold investing community as there is the belief that this may be the long awaited bull market in gold which has been attributed by some by the advent of negative interest rate policies in major economies like Japan.  We remain hesitant to believe that all is well in the gold sector as this is the third year in a row that gold has started strong.  The last two years (2014 & 2015) both ended in the loss column for the year, in spite of the early gains.

image

The above chart shows exactly how gold garnered early gains.  For 2014, gold ended the year at a loss of –1.55% while the XAU index declined –21.11%.  For 2015, gold fell –9.55% and gold stocks fell –35.89%.  The early gains for 2016 are nice but new investors should accept what may come if there is a repeat of the last two years.

Coppock Curve: January 2016

We started the year off on with a big market selloff.  The Dow Jones Industrial Average fell -5.4% in January.  For the first time since June 2008, the Coppock Curve dipped into negative territory.  This is a welcoming sign for our team and any long-term investors.  Below is the current chart of the Coppock Curve. Continue reading

Transaction Alert

On February 5, 2016, we executed the following transaction(s):

Continue reading

Review: Boston Beer Company

On February 25, 2015, we posted the following chart for Boston Brewery Company (SAM):

image

Our summarizing commentary at the time was as follows:

“Our expectations for SAM are not very high as the last time that the stock was able to achieve the conservative downside target of $70.13 was in 2011.  Since that time, SAM has faltered but not fallen.  In spite of this fact, we’ve outlined the conservative downside target of $180.12 and the extreme downside target of $107.99.  Investors should note that a decline to the ascending $180.12 level is an ideal buying target with a follow-up purchase below $141.25.”

Fast forward nearly one year later and we’re looking at a pending recession and a declining stock market.  Everything is negative and going to get worse, according to some experts.  With this in mind, As SAM falls below $180, it is time to consider the investment fundamentals of the company.  Below is the updated SRL.