Monthly Archives: August 2014

The Graham Ratio and Application

The core of value investing is to obtain an investment for less than its worth. Professional investors will typically focus on the price to earnings (P/E) ratio which compares the current share price with its per share earnings. Although this is a good gauge, more than one ratio should be considered when assessing an investment. Students of value investing should also be familiar with price to book (P/B) ratio. This ratio (P/B) compares the current share price to the current shareholder equity.

In the book The Intelligent Investor, Benjamin Graham highlights a key concept which combined the two ratios [P/E and P/B] as a gauge on the valuation of a company. These combined ratios are known as the Graham ratio. The computation is elementary, simply multiply the P/E ratio with the P/B ratio. If the product is less than 22.5, the company may be of good value. This thesis is highlighted in Chapter 14 – Stock Selection for the Defensive Investor of The Intelligent Investor. We find this concept to be so compelling that we've decided to back test this ratio against our watch lists from 2012. Continue reading

Berkshire Hathaway: 10-year Price Projections

In our May 6, 2012 posting on Berkshire Hathaway (BRK-A) titled “Should Berkshire Hathaway Be Trading at 1995 Prices?”, we gave price projections based on Edson Gould’s Altimeter using very conservative estimates if BRK-A paid a dividend.  As we’ve managed to achieve the middle of the three upside targets set down in our 2012 article, we’re going to list the price that we think BRK-A would be considered undervalued for each of the next 10 years.

Nasdaq 100 Watch List: August 26, 2014

Below is our watch list with the estimated price targets for the remainder of the year.

Continue reading

Nasdaq 100 Review

Below is the one year performance of our August 23, 2013 Nasdaq 100 Watch List stocks (8/23/2013 to 8/26/2014):

Symbol Name 2013 2014 % change
SHLD Sears Holdings Corp 39.6 34.67 -12.45%
EQIX Equinix, Inc. 170.01 217.25 27.79%
TEVA Teva Pharmaceutical 38.3 52.22 36.34%
CHRW Robinson Worldwide 57.2 68.45 19.67%
EXPE Expedia Inc. 48.84 87.43 79.01%
NUAN Nuance Comm. 19.31 17.17 -11.08%
MXIM Maxim Integrated 27.71 30.91 11.55%
BRCM Broadcom Corp. 25.24 38.81 53.76%
ISRG Intuitive Surgical 390.09 478.68 22.71%
NWSA News Corporation 15.75 17.62 11.87%
Avg. % change 23.92%
NDX Nasdaq 100 Index 30.26%

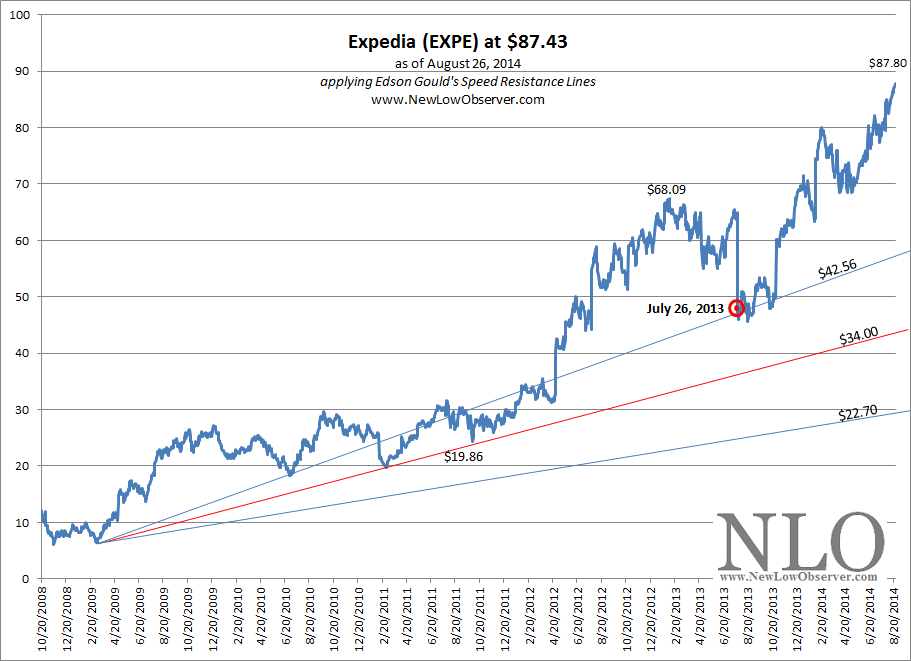
The watch list of stocks gained +23% versus a gain of +30% in the Nasdaq 100 Index.  The best performing stock, with gains of +79%, was Expedia which was a strong interest stock featured on our July 26, 2013 watch list.  At the time, we said the following:

Travel website operator Expedia (EXPE) has suddenly dropped in on our watch list with a –27.38% decline in the stock price on Friday July 26, 2013.  We’re not sure that a –28% decline in quarterly earnings requires a –27% decline in the stock price.  This type of activity suggests that since June 2012, investors had not sufficiently assessed the prospects of the company before acquiring the stock.  Extreme swings in the price indicate that there is more downside risk.

Applying Edson Gould’s Speed Resistance Lines gives us a conservative downside target of $42.56 and an extreme downside target of $22.70.

Our expectation is that there is a good chance that Expedia will decline to the $34 level.  Once falling below $34, Expedia should be reviewed on a fundamental basis as a going concern.  There may be significant opportunity for this stock as the performance has been in line with industry competitors.

As is often the case, we were too conservative in believing that EXPE would achieve the rising $34.00 level.  Instead, EXPE fell exactly to the rising $42.56 level and moved higher from there (updated chart below).

image

Another strong interest stock in the same July 26, 2013 posting, Equinix (EQIX) also fell only as low as the conservative downside target.  From the peak price of $229.02, EQIX spent only four trading days below $158.37.  It has been nothing but an uphill climb since.

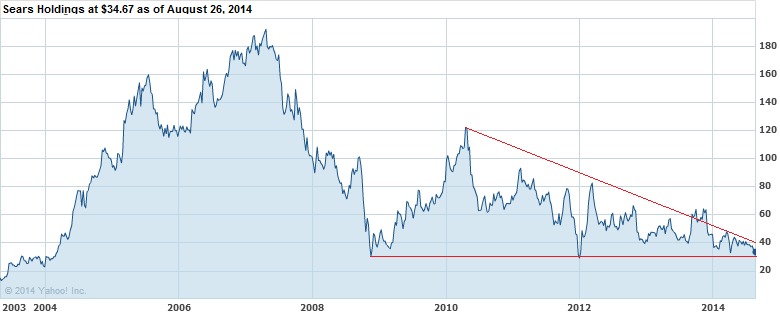
The worst performing stock was Sears Holdings (SHLD).  Sears has essentially traded with descending peaks since 2007 with price support at around $30.  A break below $30 could result in significant loss for any remaining shareholders.  Private equity firms must be circling Sears at the prospect of a decline below the long-term support.

image

The strong interest stock from the August 23, 2013 watch list was Maxim Integrated Products (MXIM). At the time we said of MXIM:

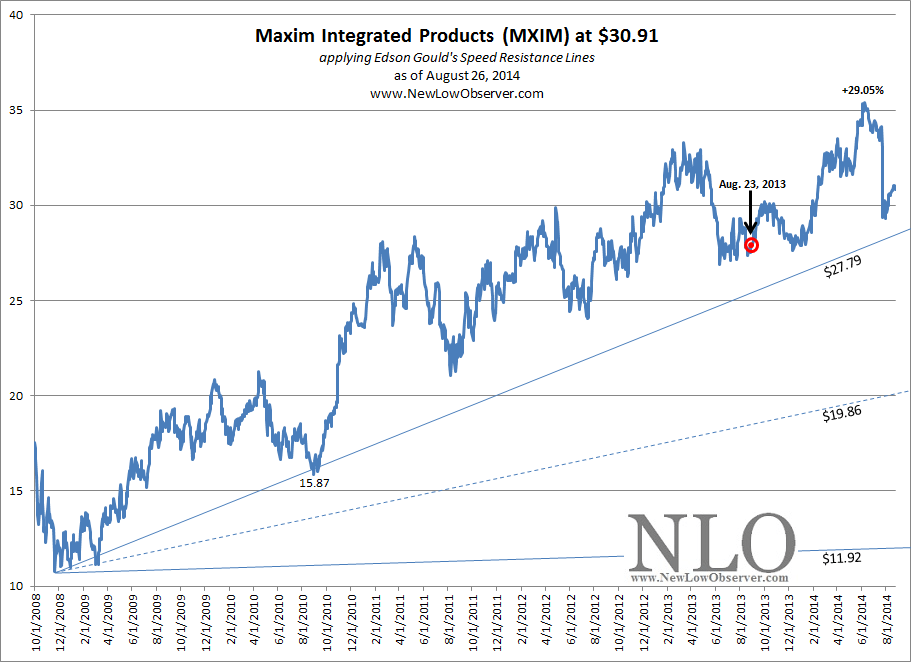
“The stock of most interest to us is Maxim Integrated Products (MXIM).  Maxim has had a great run since our March 20, 2010 highlight of the chip sector as potential investment candidates (found here).  In the chart below, since the 2008 trough, Maxim has maintained a consistent ability to rebound from the conservative downside target of $26.97.  However, if the stock cannot hold the line at $26.91, then we expect that the stock will fall to the $19.03 level.  The extreme downside target is $11.10, however, we don’t expected this to be achieved.  Potential investments at the current level along with stepped up amounts of capital at $19.03 and $15.87 is recommended.”

Since August 23, 2013, Maxim increased as much as +29.05% before falling to a 1-year gain of “only” +11%.  If we include the dividend of 3.80%, the total return would be +15% for the last year.  Below is the updated SRL for MXIM with new conservative and extreme downside targets.

image

Although Maxim has fallen considerably since the June 2014 peak, we’re only willing to re-consider the stock after falling at or below the rising $27.79 level.

Investment Consideration

To put all of the gains (and losses) into perspective, we like to compare any profits with the historical market return.  Below are the annualized compounded annual growth rates (CAGR) for the last 50, 40, 30, 20 and 10 years (adjusted for inflation) [source].

years CAGR
50 5.90%
40 5.80%
30 8.42%
20 6.71%
10 6.67%

If an investor can achieve two times (2x) the 30-year CAGR in a single year, it is worth considering alternative investment opportunities while selling the principal and allowing the profits to compound in those stocks that pay a dividend.

U.S. Dividend Watch List: August 22, 2014

Top Five Watch List Performance Review

In our ongoing review of the NLO Dividend Watch List, we have taken the top five stocks on our list from July 26, 2013 and have checked the performance one year later. The top five companies on that list can be seen in the table below.

Symbol Name 2013 Price 2014 Price % change
IBM IBM 185.42 190.41 2.7%
NWN Northwest Natural Gas 42.26 44.71 5.8%
XOM Exxon Mobil Corp. 87.52 98.50 12.5%
PM Philip Morris International 85.37 84.34 -1.2%
MAC Macerich 56.72 64.89 14.4%
      Average 6.8%
         
DJI Dow Jones Industrial 15,010.51 17,001.22 13.3%
SPX S&P 500 1,663.501,988.4019.5%

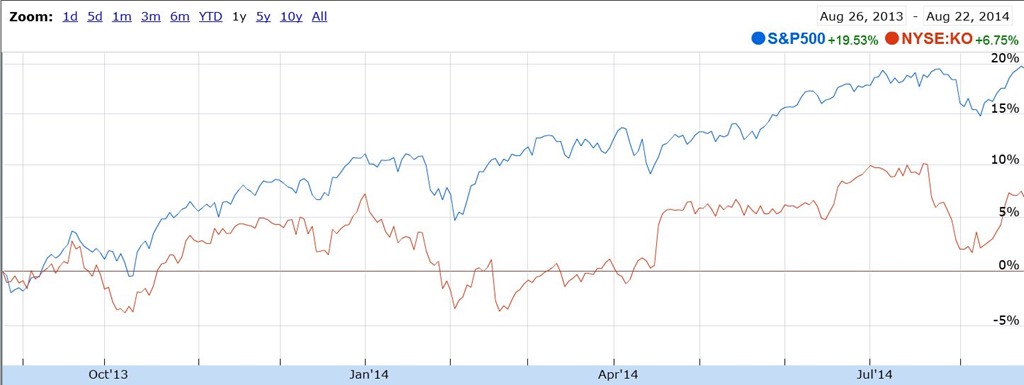
We didn't elaborate much about the top five companies on the list but we did indicate our position in Coca-Cola (KO). Coca-Cola performance was sub par with a gain of +6.75%. However, when we include dividend into the picture, the total gain is+ 9%.

Capture

U.S. Dividend Watch List: July 25,2014

The Dow is approaching its all-time high while the S&P 500 closed above its all-time high this week. We highlighted our macro view in the Dow Theory update on August 14, 2014. As a result of the market upward surge, our watch list dwindled down to sub 100 for the first time in several weeks.

Because the market multiple is at 19, many companies are likely to be closer to fair value and over valued. We highly encourage extra caution and due diligence when filtering through the list. Continue reading

Gold Stock Indicator: August 22, 2014

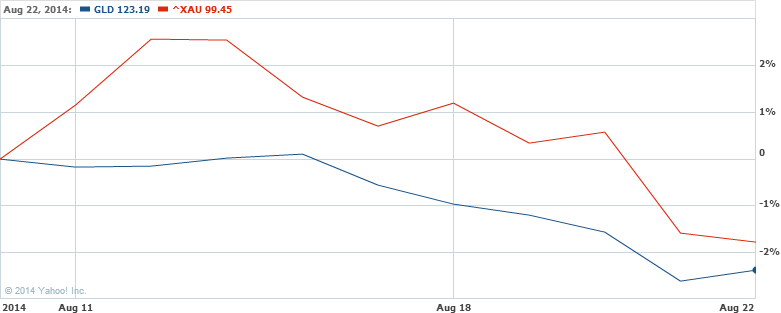
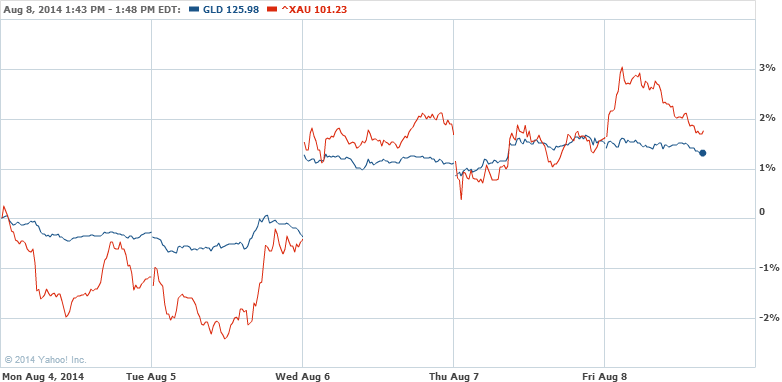
Since our last posting, Gold (GLD) and gold stocks (XAU Index) continue to trade in a range as seen below.

image

Apple meets NLO Upside Target

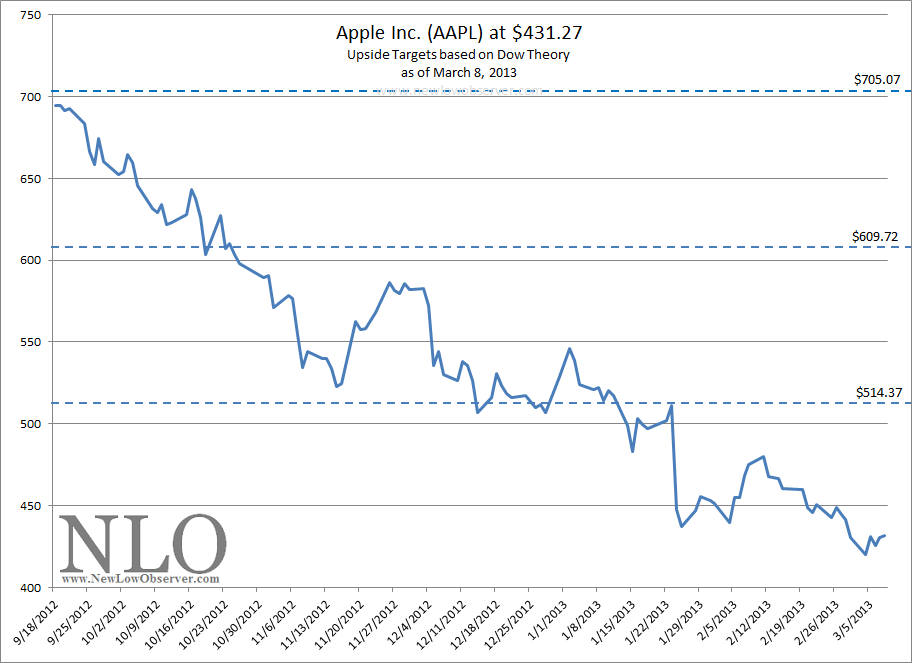
On August 19, 2014, Apple (AAPL) stock price rose as high as $100.66.  When Apple was trading at $61.61 on March 9, 2013, we said the following with the accompanying chart:

“Apple Inc. (AAPL) is at the top of our watch list as it is within 5% of the one year low.  In our April 14, 2012 test of the quality of Edson Gould’s Speed Resistance lines, Apple fell from $636 [adjusted price of $90.85] to our projected level of $424.15 [adjusted price of $60.59] (found here).  Now that the stock has achieved our downside target, we expected that a reaction to the upside is likely.”

image

On July 17, 2013, when Apple was trading at $61.47, we re-affirmed our view of the upside potential for Apple with the following commentary:

“Currently, Apple is demonstrating a basing pattern that if successful, could result in a breakout to the upside.  At the current levels, we wouldn’t be opposed to buying some shares of Apple with the expectation that the stock could decline an additional –25% to –35%.”

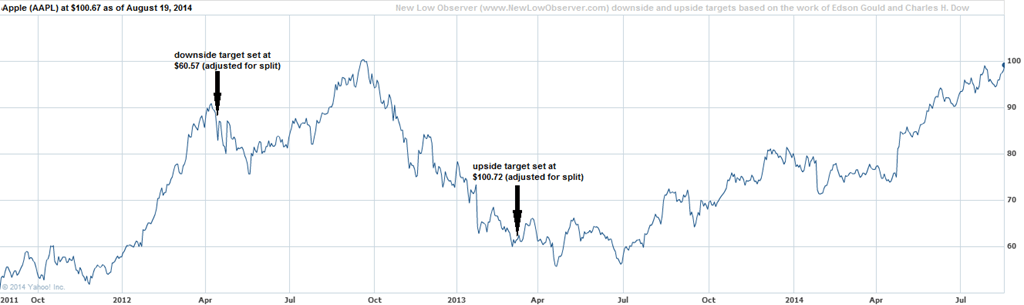
The work of Edson Gould has proven to be astounding when considered in its context.  On April 14, 2012, we posted an article titled “Considering the Downside Prospects for Apple”.  At that time, we were revising the previous estimates of downside risk done on February 5, 2012 (third party source available here).

What was mentioned on February 5, 2012 is critical to understanding how Edson Gould’s downside projections work.  At the time, we said:

“The very first thing that we look for, to determine speed resistance lines, is the most recent peak in the price. Because AAPL is continually making new highs, we only need to use the latest price of $455.68 [post split price of $65.09] as our starting point….As the price of Apple increases, so too does the SRL lines based on the work of Edson Gould.”

This means that as long as the price of the stock increases to a new high the speed resistance lines are expected to increase as well.  Only when the stock starts on a declining trend can we expect that the stock price might go to the conservative and extreme downside targets.

image

On April 14, 2012, when Apple was trading at $90.89 (pre-split price of $636.23), we said the following:

“…we believe that, based on the current speed resistance lines, no one would expect Apple to decline to our conservative downside target of $424 (post split price of $60.57)...”

The strength of Gould’s downside risk estimates is that we didn’t even have the peak price of $100.71 set on September 18, 2012 but we were still able to see the conservative downside target of $60.57 achieved.  Had we used the peak price, we would have achieved the $67.14 conservative downside target much earlier than the $60.57 level.

Canadian Stock Review: August 16, 2013

Performance Review

Below is the 1-year performance of the Canadian dividend stocks from our August 16, 2013 list.

symbol name 2013 2014 % change
CUF-UN.TO Cominar REIT 19.3 19.51 1.09%
BEI-UN.TO Boardwalk REIT 55.6 68.2 22.66%
CAR-UN.TO Canadian Apt Properties REIT 20.4 23.84 16.86%
EMA.TO Emera Inc. 31.3 34.61 10.58%
AX-UN.TO Artis REIT 13.8 15.88 15.07%
D-UN.TO Dundee REIT 29.6 28.95 -2.20%
CWT-UN.TO Calloway REIT 24.9 26.25 5.42%
REI-UN.TO Riocan REIT 23.8 26.75 12.39%
FTS.TO Fortis Inc. 31.2 33.55 7.53%
FCR.TO First Capital Realty Inc. 17.2 18.95 10.17%
FTT.TO Finning International Inc. 22 32.83 49.23%
REF-UN.TO Canadian REIT 40.9 48.47 18.51%
BDT.TO BIRD CONSTR INC 11.9 15.15 27.31%
LB.TO Laurentian Bank of Canada 45.1 50.86 12.77%
TLM.TO Talisman Energy Inc. 11.3 11.32 0.18%
CM.TO CIBC 78.8 101.32 28.58%
JE.TO JUST ENERGY GROUP INC 6.34 6.37 0.47%
TRP.TO TransCanada Corp. 46.5 55.59 19.55%
NA.TO National Bank Canadian 39.15 48.84 24.75%
RBA.TO Ritchie Bros. Auctioneers 19.6 26.1 33.16%

The entire list gained +15.70% as compared to the Toronto Stock Exchange Composite Index gain of +20.16%. The stock with the biggest gains in the last year was Finning International (FTT.TO) with a gain of +49.23%.  The stock with the largest decline was Dundee (D-UN.TO), now known as Dream Office Real Estate Investment Trust, with a decline of –2.20%.  At the time, we didn’t think much of the REIT sector and said so with the following commentary:

“…we are worried that the REIT sector may spiral downward as was the case in the rising interest rate environment of the early 1970’s.”

We were completely wrong in our assessment of the REIT sector as rising interest rates either never materialized or did not have the anticipated negative impact.  The gains that were achieved by the REIT sector were exceptional in our view.  As an example, Boardwalk REIT gained +22.66% in the last year for a total return of +26.22%.

Two stocks of interest to us were Just Energy (JE.TO) and Ritchie Brothers Auctioneers (RBA.TO).  We said the following of Just Energy:

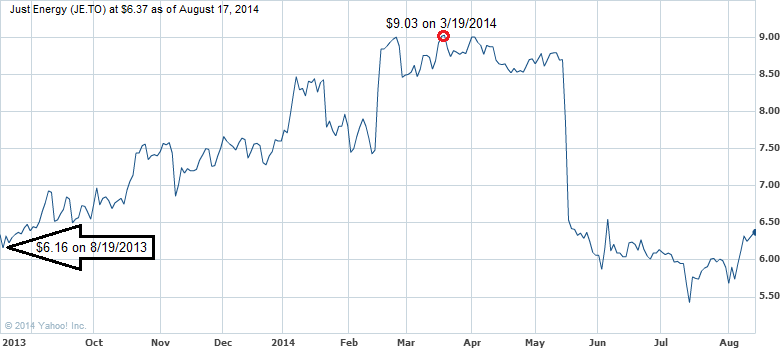
“Because JE.TO is trending lower, we recommend reassessing the stock when and if it declines to the $6.15 level.  The dividend for JE.TO should not be a consideration for this stock as there are continued risks to the dividend going forward.”

After our August 16, 2013 posting, Just Energy’s stock price declined to $6.16 on August 19, 2013.  Soon afterwards, Just Energy increased as high as $9.03 by March 19, 2014, a gain of +46.59%.  so far, we’ve had tremendous luck with JE.TO rising and falling as anticipated (February 15, 2013 & July 31, 2013).  We can’t be certain of the prospects going forward for Just Energy, however, those interested in the stock cannot rely on  the dividend and should invest accordingly.

image

Regarding Ritchie Brothers Auctioneers (RBA.TO), we said the following:

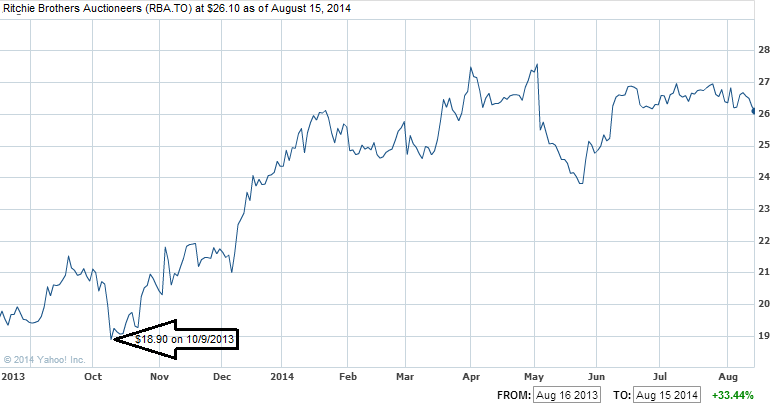
“Another stock of interest on our watch list is Ritchie Brothers (RBA.TO).  Although we’d like to provide original analysis each time we write our postings, we find that sometimes such a pursuit is completely unnecessary.  RBA.TO completely fits the billing on this matter.  On August 17, 2012 (found here), we said that RBA.TO had the pattern of falling to $18/$19 and then recovering to higher ground.”

As we had observed, RBA.TO fell to $18.90 and has since risen as much of +33.16%.  At this point, selling the principal position in RBA.TO would be acceptable for the purpose of raising cash or acquiring alternative investments.

image

Our August 2014 Canadian Dividend Watch List can be found here.

Canadian Dividend Watch List: August 15, 2014

Below is the list of Canadian stocks that are currently on our radar along with the projected price appreciation:

Continue reading

Dow Theory: August 14, 2014

In our last Dow Theory posting on May 18, 2014, we revealed an issue with Dow Theory that had gone unaddressed since S.A. Nelson’s book The ABC of Stock Speculation coined the term “Dow’s Theory.” We believe the acknowledgment of this issue adds clarity to the writings of Charles H. Dow and may produce new insights that have not previously been explored.

Continue reading

U.S. Dividend Watch List: August 8, 2014

There’s an old saying, "Markets climb a wall of worry".

This week's market performance proved just that. Despite an order for air strikes on Iraq, the market managed a gain of +0.3%. For the market to continue higher, we believe that the Dow Jones Industrial Average would need to rise above 17,138 in conjunction with the Dow Jones Transport exceeding 8,468.

We're at an interesting juncture in the market. The recent highs were achieved with relatively weak market breadth. When the market reached its high one year ago (summer of 2013), we saw less than 10 companies that appeared on our dividend watch list. Currently, our list has more than ten times as many companies.

There are 104 companies on our watch list this week. We highly recommend everyone to take a more bearish view of the market at the current time while keeping a keen eye on the companies below.

Continue reading

Berkshire Hathaway Meets NLO Target

On May 6, 2012, we proposed that Berkshire Hathaway (BRK-A) was trading at a price that was well below its true value.  At the time, BRK-A was trading at $164,990 per share.  However, we proposed that Berkshire Hathaway should have been selling at much higher prices with upside targets of $175k, $197k and $219k in a 2-3 year timeframe.  As BRK-A sits within 1% of our mid-range target of $197,190 after two years, we believe it is time to reassess where Berkshire Hathaway sits within the context of Edson Gould’s Altimeter.

Chip Sector Cycle Says Sell

On December 6, 2012, we said the following of our Nasdaq 100 Watch List:

“We’ve highlighted the chip sector stocks to put emphasis on the fact that, as an industry group, the sector may be at or near a low.”

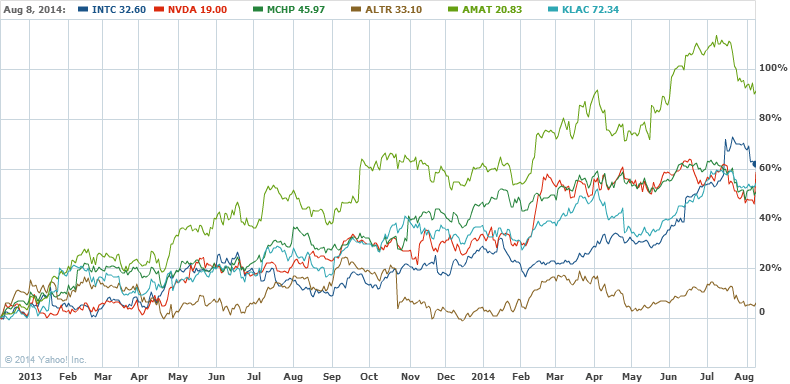
After a year and a half, the chip sector stocks have achieved all that we had anticipated when we wrote about them in late December 2012.  As seen in the chart below, all of the stocks except Altera (ALTR) achieved gains that beat the Nasdaq Composite growth of +46.22% in the same period.

image

The chip sector does run on a cycle and it is our belief that while this may not be the top it is time to sell the principal in those stocks that have had a decent run.  The profit portion should be allowed to compound until new relative lows are achieved. 

We’ve been fortunate to successfully identify two chip sector cycles lows on March 20, 2010 and December 6, 2012.  As we have in the past, we will notify subscribers of investment opportunities at the next cycle low.  Investors may want to consider rotating into sectors that we’ve identified as worth accumulating using the proceeds from the sell of chip sector stocks.

Gold Stock Indicator: August 8, 2014

Gold and precious metal stocks continue their long road to nowhere with a minor increase of +1.32% in the SPDR Gold Share (GLD) during the last week.

image

Priceline.com Overpays for Ctrip.com

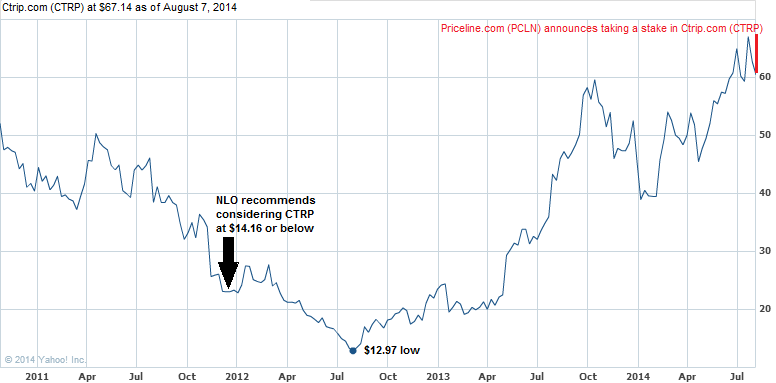
It was recently announced that Priceline.com (PCLN) would take a stake in Ctrip.com (CTRP) (found here).  However, we believe that PCLN is vastly overpaying for Ctrip.com as we recommended consideration of CTRP when the stock was trading at $23.10.  At the time, we suggested that Ctrip.com would decline to $14.16 level in our December 16, 2011 Nasdaq 100 Watch List with the following commentary (found here):

Ctrip.com International (CTRP) is on a pace to replicate the performance from the high in April 2008 to the low of January 2009 which equaled a loss of 72%. A similar decline in CTRP from the high of $50.57 would bring the price down to $14.16.Suffice to say, the stock “only” needs to decline another $8.94 or 38% from the current price of 23.10.This seems very easy considering the high volatility of Chinese stocks.We believe that unless CTRP is summarily dismissed from the Nasdaq 100 index, there may yet be life in this company.”

image

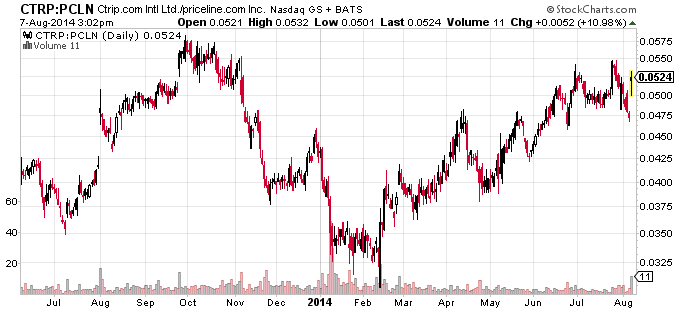
Ctrip.com achieved our downside target and is now trading nearly 3x the 14.16 level.  True to form, a company has stepped up to nibble at Ctrip.com just when, in our opinion, the stock is overpriced.  Obviously this is a boon for investors of Ctrip, however, this isn’t such a good deal for Priceline.com investors.  As can be seen in the chart below, Priceline has had ample opportunities in July 2013 and January-February 2014 to acquire two and three times the current amount (based on the relative price change of Priceline and Ctrip).

image

Dow’s Theory on when to consider a stock would have done Priceline.com shareholders a lot of good.  Now the shareholders of PCLN can only be expected to continue to pay up.