Monthly Archives: November 2011

NLO Dividend Watch List: November 25, 2011

The S&P 500 index closed down -4.7% for the week while the blue-chip Dow Jones Industrial index was down -4.6%. Our dividend list contains 29 companies this week. Those companies within 5% of the 52-week low are listed below.

November 25, 2011

Symbol Name Price % Yr Low P/E EPS (ttm) Dividend Yield Payout Ratio
AVP Avon Products, Inc. 16.09 0.00% 9.46 1.70 0.92 5.72% 54%
CCBG Capital City Bank Group  9.65 0.00% 21.93 0.44 0.40 4.15% 91%
FNFG First Niagara Financial Group 8.24 0.24% 12.48 0.66 0.64 7.77% 97%
TR Tootsie Roll Industries Inc  22.88 0.26% 31.78 0.72 0.32 1.40% 44%
WST West Pharmaceutical 35.6 0.28% 19.67 1.81 0.72 2.02% 40%
AROW Arrow Financial Corp.  21.58 0.37% 11.66 1.85 1.00 4.63% 54%
T AT&T Inc 27.41 0.77% 13.91 1.97 1.72 6.28% 87%
BMS Bemis Co Inc 27.62 1.51% 13.88 1.99 0.96 3.48% 48%
MTB M & T Bank Corp. 67.7 1.96% 9.80 6.91 2.80 4.14% 41%
CHRW C.H. Robinson Worldwide, Inc.  63.63 2.13% 24.76 2.57 1.16 1.82% 45%
BDX Becton, Dickinson and Co. 71.11 2.18% 12.65 5.62 1.64 2.31% 29%
BMO Bank of Montreal 53.22 2.68% 10.82 4.92 2.82 5.30% 57%
WFSL Washington Federal, Inc.  12.52 3.05% 12.52 1.00 0.24 1.92% 24%
LM Legg Mason, Inc.  23.31 3.10% 14.21 1.64 0.32 1.37% 20%
AVY Avery Dennison Corp. 24.25 3.10% 9.19 2.64 1.00 4.12% 38%
BCR CR Bard, Inc. 83.37 3.18% 21.43 3.89 0.76 0.91% 20%
BMI Badger Meter, Inc. 27.83 3.42% 17.29 1.61 0.64 2.30% 40%
VNO Vornado Realty Trust 70.73 3.42% 16.96 4.17 2.76 3.90% 66%
HCC HCC Insurance Holdings, Inc. 25.6 3.81% 10.58 2.42 0.62 2.42% 26%
SYK Stryker Corp. 45.52 4.09% 14.45 3.15 0.72 1.58% 23%
WFC Wells Fargo & Co. 23.51 4.12% 8.71 2.70 0.48 2.04% 18%
BXS BanCorp.South Inc. 8.57 4.13% 17.85 0.48 0.04 0.47% 8%
WEYS Weyco Group, Inc.  21.72 4.32% 16.58 1.31 0.64 2.95% 49%
BEN Franklin Resources, Inc. 91.63 4.47% 10.63 8.62 1.00 1.09% 12%
EXPD Expeditors Intl of Washington 40 4.58% 22.10 1.81 0.50 1.25% 28%
CTAS Cintas Corp.  27.63 4.70% 15.44 1.79 0.54 1.95% 30%
SIAL Sigma-Aldrich Corp.  58.89 4.82% 16.36 3.60 0.72 1.22% 20%
GE General Electric Co 14.7 4.85% 11.22 1.31 0.60 4.08% 46%
CWT California Water Service 17.47 4.92% 17.83 0.98 0.62 3.55% 63%

Watch List Summary

Topping our list this week is Avon Products (AVP). According to IQTrends (http://www.iqtrends.com/), AVP is considered undervalued once it reaches a 3.7% dividend yield. The yield rose to 5.7% this week from 5.05% two weeks prior. Any long-term investor would need to do some extensive due diligence prior to committing their hard earned capital to this company. The current payout ratio (dividend/earnings) is at 54% imply that earnings can fall by half before a dividend cut is considered. Please note that the company is being investigated by SEC.

Another company for yield seekers is AT&T (T).  The current yield of 6.28% is hard to ignore when the 10 year T-Bill pays 1.97%.  IQTrends estimates that AT&T is undervalued when the yield reaches 5.5%. A return to historical undervalued yield would equate to 14% upside move. The payout ratio of 87% is quite high but not unusual for AT&T. The recent M&A deal with T-Mobile was broken up.  This should provide an interesting backdrop for how AT&T would fight off competition from its main rival Verizon.

Disclaimer:
On our current list, we excluded companies that have no earnings. Stocks that appear on our watch lists are not recommendations to buy. Instead, they are the starting point for doing your research and determining the best company to buy. Ideally, a stock that is purchased from this list is done after a considerable decline in the price and extensive due diligence. We suggest that readers use the March 2009 low (or the companies' most distressed level in the last 2 years) as the downside projection for investing. Our view is to embrace the worse case scenario prior to investing. A minimum of 50% decline or the November 2008 to March 2009 low, whichever is lower, would fit that description. It is important to place these companies on your own watch list so that when the opportunity arises, you can purchase them with a greater margin of safety. It is our expectation that, at the most, only 1/3 of the companies that are part of our list will outperform the market over a one-year period. 

Please consider donating to the New Low Observer. Thank you.

In the News: November 19, 2011

The Bear Bust at Forbes

Nasdaq 100: November 18, 2011

Below are the Nasdaq 100 companies that are within 10% of their respective 52-week lows. Stocks that appear on our watch lists are not recommendations to buy. Instead, they are the starting point for doing your research and determining the best company to buy. Ideally, a stock that is purchased from this list is done after a considerable decline in the price and rigorous due diligence.

Symbol Name Trade P/E EPS Yield P/B % from Low
CTRP Ctrip.com International, Ltd. $25.65 22.00 1.17 0 3.56 2.25%
BMC BMC Software, Inc. $35.59 14.58 2.44 0 4.06 4.30%
NTAP NetApp, Inc. $34.80 21.13 1.65 0 3.45 4.44%
QGEN Qiagen N.V. $13.74 24.98 0.55 0 1.26 5.29%
CHRW C.H. Robinson Worldwide, Inc. $66.13 25.73 2.57 1.70% 8.50 6.15%
NIHD NII Holdings, Inc. $23.41 13.21 1.77 0 1.20 6.47%
LIFE Life Technologies $37.65 19.76 1.91 0 1.50 6.66%
SIAL Sigma-Aldrich Corporation $60.01 16.67 3.60 1.10% 3.38 6.82%
BRCM Broadcom Corporation $32.81 19.75 1.66 1.00% 2.88 6.84%
MSFT Microsoft Corporation $25.31 9.20 2.75 3.00% 3.62 7.00%
RIMM Research In Motion Limited $18.46 3.37 5.48 0 0.98 8.34%
EXPD Expeditors Int'l of Wash. $42.84 23.67 1.81 1.10% 4.63 9.20%
SRCL Stericycle, Inc. $77.86 30.90 2.52 0 5.56 9.40%
HSIC Henry Schein, Inc. $60.97 16.01 3.81 0 2.21 9.76%
SYMC Symantec Corporation $16.20 18.43 0.88 0 2.62 9.76%
CA CA Inc. $20.47 12.01 1.70 0.90% 1.77 9.99%

Watch List Summary

On July, 11, 2011, it was announced that SiriusXM (SIRI) would be added to the Nasdaq 100 Index (article here).  Our view, at the time, was that adding SIRI to the Nasdaq 100 wasn’t the best idea.  Instead, we provided four stocks from the Nasdaq 50 alternative group which we felt could have been added to the index. 
Considering that we’re a month away from the Nasdaq 100 re-ranking, we’d like to see if the stocks that we suggested, from the Nasdaq 50 alternative list, actually did any better than SIRI.

symbol
company
15-Jul
18-Nov
% Change
SiriusXM
2.33
1.79
-23.18%
Dish Networks
30.77
24.74
-19.60%
Shire Plc
99.67
95.01
-4.68%
Nasdaq 100
2356.67
2253.95
-4.36%
Discovery Comm.
41.6
40.61
-2.38%
ASML Holdings
34.32
38.07
10.93%

As expected, SiriusXM was the stock that lost the most with a decline of -23.18% in the period from July 15th to November 18th.  In this period of time, SIRI’s P/E ratio improved as a result of increased earnings and total revenue along with a share price decline. The trailing price-to-earnings ratio (P/E ratio) contracted from 221 to the current level of 41. 
Serial bulls of SiriusXM (SIRI) contended that the P/E ratio would contract based on the expected improvement in earnings.  Unfortunately, an improved bottom line did not equate to the expected gains in the stock price.  The stock that was closest to SiriusXM (SIRI), in terms of losses, was Dish Networks (DISH) which declined -19.60%.  On the other end of the spectrum, ASML Holdings (ASML) gained +10.93% in the same period of time.
As the deadline for the re-ranking of the Nasdaq 100 approaches, We’re wondering if the Nasdaq 100 selection committee is willing to reconsider SIRI as a member of the Nasdaq 100 index.  Although we believe the stock should not be included in the index, we understand that membership is contingent upon volume and market cap considerations.  So far, SIRI meets the most basic requirements necessary to remain in the index.  However, if the carpet is pulled from under the stock by dropping SIRI from the index, a sizable decline in the price of SIRI is not out of the question.
In addition to the possibility of SIRI being removed from the Nasdaq 100, however remote, are the following companies:
  • Henry Schein (HSIC)
  • Stericycle (SRCL)
  • Sigma-Aldrich (SIAL)
  • Sears Holdings (SHLD)
  • Qiagen (QGEN)
  • Ctrip.com (CTRP)
  • NII Holdings (NIHD)
  • Warner Chilcott (WCRX)
  • Vertex Pharma. (VRTX)
  • BMC Software (BMC)
  • Life Tech. (LIFE)
  • Illumina (ILMN)
It is noted that many of the companies that are on our current Nasdaq 100 watchlist are also potential candidates for being removed from the Nasdaq 100 Index.  From prior observation, if for any reason these stocks aren't dropped from the index, they are expected to outperform the Nasdaq index by a sizable margin in the coming year.
Watch List Performance Review
In our ongoing review of the Nasdaq 100 Watch List, we have taken the stocks from our list of November 10, 2010 (found here) and have checked their performance one year later. The companies on that list are provided below with the closing prices from November 10, 2010 to November 9, 2011.

Symbol Name 2010 2011
% Change
WCRX Warner Chilcott plc $20.89 $17.20 -17.66%
APOL Apollo Group, Inc. $36.84 $46.14 25.24%
TEVA Teva Pharma. $50.81 $40.58 -20.13%
ISRG Intuitive Surgical, Inc. $277.96 $429.28 54.44%
AMGN Amgen Inc. $54.93 $57.51 4.70%
Average gain 9.32%
NDX Nasdaq 100 2,187.74 2314.10 5.78%

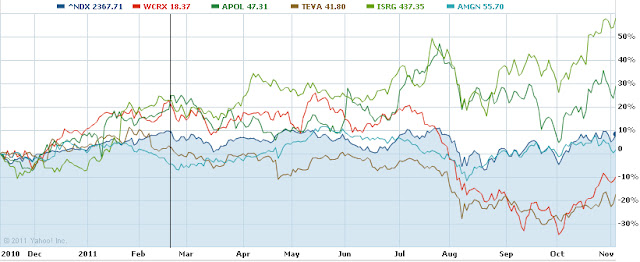
The black line drawn in the month of February 2010 indicates the period when three of the five stocks had achieved annualized gains of at least 60% or more.  Taken as a whole, the entire portfolio achieved an annualized gain of nearly 40% near the middle of February 2010.  In the end, it was Apollo Group (APOL) and Intuitive Surgical (ISRG) that carried the top five to an average gain of 9.32% over the last year.  The top 5 beat out the Nasdaq 100 by 3.54%.

NLO Dividend Watch List: November 11, 2011

The S&P closed up 0.85% for the week while the blue-chip Dow Industrial index was up 1.4%. Our dividend list contains 20 companies this week.  Those companies within 11% of the 52-week low are listed below.

November 11, 2011

Symbol Name Price % Yr Low P/E EPS (ttm) Dividend Yield Payout Ratio
AVP Avon Products, Inc. 18.23 3.87% 10.72 1.70 0.92 5.05% 54%
WAG Walgreen Co. 32.85 3.99% 11.17 2.94 0.90 2.74% 31%
BDX Becton, Dickinson and Co. 74.12 5.21% 13.19 5.62 1.64 2.21% 29%
FRS Frisch's Restaurants, Inc 19.54 5.45% 22.20 0.88 0.64 3.28% 73%
CCBG Capital City Bank Group  10.35 5.50% 23.52 0.44 0.40 3.86% 91%
TR Tootsie Roll Industries Inc  24.25 5.62% 28.20 0.86 0.32 1.32% 37%
BMS Bemis Co Inc 28.86 6.06% 14.50 1.99 0.96 3.33% 48%
PEP PepsiCo Inc. 63.28 6.80% 15.86 3.99 2.06 3.26% 52%
FNFG First Niagara Financial Group 8.94 7.84% 13.55 0.66 0.64 7.16% 97%
T AT&T Inc 29.42 8.16% 14.93 1.97 1.72 5.85% 87%
CLX Clorox Co. 65.63 8.37% 18.91 3.47 2.40 3.66% 69%
AVY Avery Dennison Corp. 26.03 8.64% 9.86 2.64 1.00 3.84% 38%
BMO Bank of Montreal 56.77 9.53% 11.29 5.03 2.82 4.97% 56%
AROW Arrow Financial Corp.  23.74 9.96% 12.83 1.85 0.97 4.09% 52%
BCR CR Bard, Inc. 88.89 10.01% 22.85 3.89 0.76 0.85% 20%
ANAT American National Insurance 72.49 10.32% 12.00 6.04 3.08 4.25% 51%
CHRW C.H. Robinson Worldwide, Inc.  68.76 10.37% 26.75 2.57 1.16 1.69% 45%
WST West Pharmaceutical 39.18 10.37% 21.53 1.82 0.72 1.84% 40%
HCC HCC Insurance Holdings, Inc. 27.23 10.42% 11.25 2.42 0.62 2.28% 26%
SYY Sysco Corp. 27.75 10.60% 14.16 1.96 1.04 3.75% 53%
20 Companies


Watch List Summary

Topping our list this week is Avon Product (AVP).  According to IQTrends (http://www.iqtrends.com/), AVP is considered undervalued once it reaches 3.7% dividend yield. At 5.05% yield, AVP is about 36% undervalued.  Any long-term investor would need to do extensive due diligence prior to committing their hard earned capital to this investment opportunity.  The current payout ratio is at 54% imply that earnings can fall by half before dividend cut is considered.  One can't ignore the fact that the company is being investigated by SEC.  Even so, analyst at Caris & Co. has target price of $21 which was lowered from $27.

The next company on our list is Walgreen (WAG) which is just 4% from the low.  IQTrends (http://www.iqtrends.com/) estimated that Walgreen is undervalued at a 1.4% yield thus making this company extremely undervalued.  Despite the dark cloud over the Express Script concern, one can't ignore the prospects of this well run company.  Our proprietary model shows that Walgreen is trading near its "bargain" price of $30.  Incorporating earnings, cash flow, book value, and dividend yield, we estimated that Walgreen should be trading a $65 fair value.  Historical dividend yield shows that Walgreen is trading at the lowest valuation ever!

Right behind Walgreen is Becton Dickinson (BDX) which we highlighted that Warren Buffett took position in 2009, 2 years ago.  Nothing in the recent filing has shown that much has changed materially since our last recommendation.  Our proprietary model shows that the high yield range is 2% which tell us that the long-term investor should put Becton on their radar.  Our fair value estimate for Becton is $88.

Watch List Performance Review

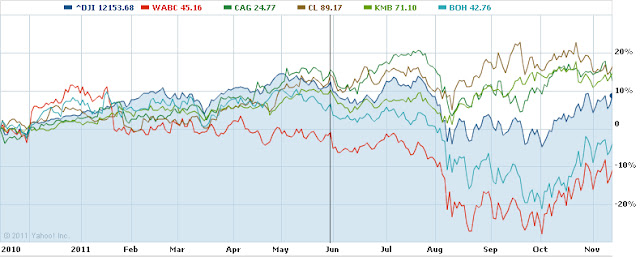
In our ongoing review of the NLO Dividend Watch List, we have taken the top five stocks on our list from November 12, 2010 (not published) and have checked their performance one year later. The top five companies on that list can be seen in the table below.

Symbol Name 2010 Price 2011 Price % change
WABC Westamerica BanCorp.  50.76 45.16 -11.03%
CAG ConAgra Foods, Inc. 22.01 24.77 12.54%
CL Colgate-Palmolive Co. 76.58 89.17 16.44%
KMB Kimberly-Clark Corp. 62.02 71.1 14.64%
BOH Bank of Hawaii Corp. 44.49 42.76 -3.89%


Average 5.74%


DJI Dow Jones Industrial 11,192.58 12,153.68 8.59%
SPX S&P 500 1,199.21 1,263.85 5.39%

Despite the lackluster performance of the top five stocks in the last year, it is noted that all of the stocks achieved a 10% gain before the month of June 2011, as indicated by the black vertical line.  We consider gains of 10% within a year to be an opportunity to consider selling the stock or selling the principal within a tax deferred account.  In this case, sales of stock at 10% gains resulted in annualized gains of at least 20%.  In the case of WestAmerica BanCorp. (WABC) the annualized gain was approximately 75%.

Disclaimer:
On our current list, we excluded companies that have no earnings. Stocks that appear on our watch lists are not recommendations to buy. Instead, they are the starting point for doing your research and determining the best company to buy. Ideally, a stock that is purchased from this list is done after a considerable decline in the price and extensive due diligence. We suggest that readers use the March 2009 low (or the companies' most distressed level in the last 2 years) as the downside projection for investing. Our view is to embrace the worse case scenario prior to investing. A minimum of 50% decline or the November 2008 to March 2009 low, whichever is lower, would fit that description. It is important to place these companies on your own watch list so that when the opportunity arises, you can purchase them with a greater margin of safety. It is our expectation that, at the most, only 1/3 of the companies that are part of our list will outperform the market over a one-year period.

Please consider donating to the New Low Observer. Thank you.

In the News: November 13, 2011


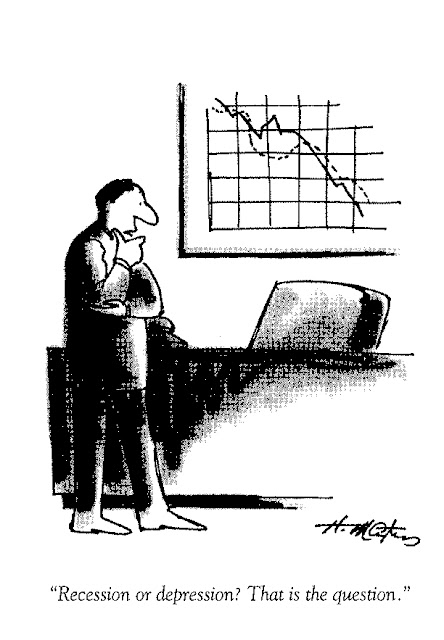
Source: Metz, Robert. "It's A Sure Thing." McGraw-Hill, New York. 1993. pg. 13. Henry Martin, cartoonist.

Odds and Ends

Edson Gould’s Speed Resistance Lines
On October 25, 2011 (found here), we posted Edson Gould’s speed resistance lines [SRL] for Chipotle Mexican Grill (CMG) and Green Mountain Coffee Roasters (GMCR). So far, the stock price for Chipotle (CMG) has retained considerable strength in the face of extreme market turmoil. However, the situation at Green Mountain Coffee Roasters (GMCR) has completely unraveled.


On November 9, 2011, in after-hours trading, GMCR fell apart by trading as low as $44.02. If we review the [SRL] for GMCR on October 25th (found here), we can see that GMCR was trading around $64 with a conservative downside target of $59.93 and an extreme downside target of $37.21. By falling below the midpoint for the extreme and conservative estimates, we infer that the stock is destined for the $37 level at the minimum. This is the second stock in our survey, after Netflix (NFLX), to adhere to Gould’s speed resistance lines.


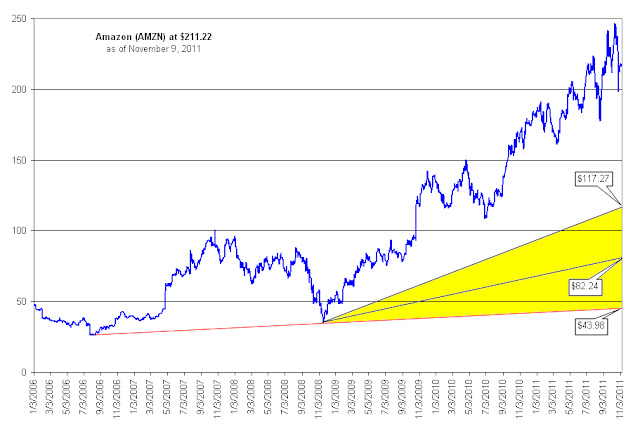
Today we’re adding two new stocks to consider using Gould’s SRL. The first is Amazon.com (AMZN) which currently trades at $211.22. As demonstrated in the chart below, Amazon.com has a conservative downside target of $117.27 with an extreme downside target of $43.98. There is a critical support level of $82.24 that should act as a buffer if AMZN were to actually fall to the $117.27 level.


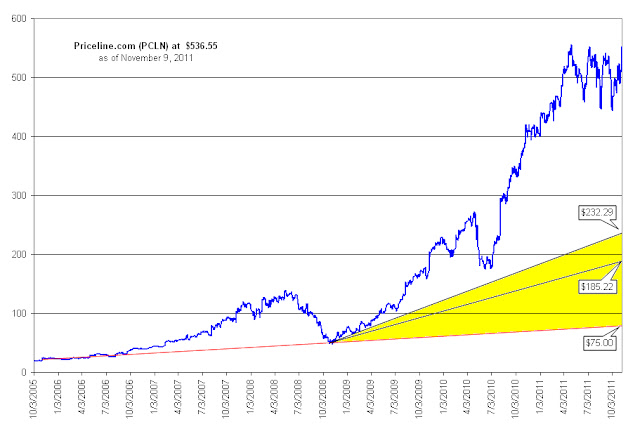
The next stock that we’re watching using Gould’s SRL is Priceline.com (PCLN) which currently trades at $536.55. Priceline.com has been trading in a steady range since the beginning of 2011. However, if that range were broken to the downside, Gould’s SRL suggests that the next downside target for Priceline.com (PCLN) is $232.29 on the conservative side and $75.00 on the extreme side. A substantial support level exists at the 185.22 level which coincides with the low in the stock price in July of 2010.


S.A. Nelson’s View on the “Morality” of Wall Street
The following is an excerpt from the person who coined the term Dow Theory.  Considering the rampant distaste for Wall Street, we think it is worth reflecting on Nelson’s words, which, although not popular seem appropriate at this time.


“Perhaps one reason why there is so much disposition to question the morality of Wall Street and contrast it unfavorably with the morality of other business centers is the fact that in Wall Street probably to a greater extent than elsewhere the primal passions and instincts of acquisitiveness and self-preservation wear less disguise than they do in the other channels of industry and money making.


“A Stock Exchange anywhere is a theatre in which these primal passions battle as gladiators in the arena without concealment or pretense. Every one who goes down into the arena knows that it is a battle wherein his hand must keep his head, and the penalty of failure will be exacted against him to the utmost. "A la guerre comme a la guerre" (a war as a war) is a proverb that very well describes the conditions under which business is done in Wall Street.


“Elsewhere it may appear to be different. The only difference is that in Wall Street there is no pretense, no disguise; the essential struggle is the same everywhere. In Wall Street, there has been and unfortunately still is at times fraud in detail peculiar to Wall Street, but it is not of Wall Street nor inherent in the laws of the game.


“It is true that speculation in Wall Street is looked upon as being especially immoral by comparison with speculation elsewhere. It is, however, part of almost every manufacturer's business or of every merchant's business to speculate in raw materials or goods, and nobody thinks of finding fault with either for doing so. In Wall Street speculation stands alone, without any business disguise, for all men to see.”


Nelson, Samuel Armstrong. ABC of Stock Speculation. 1902. page 25.
Keep in mind that the preceding thoughts were penned in 1902.  Thus adding more evidence to the idea that, “in science knowledge is cumulative, while in finance knowledge is cyclical.”  It seems that very little has been learned about the beneficial role that Wall Street has to play in American society.


Greenhill & Co (GHL) Says It Won't Happen


On July 22, 2011 (found here), we made a case for Greenhill & Co. (GHL) to cut their dividend by half.  In that missive we said the following:


“Cutting the dividend would put Greenhill & Co. (GHL) in a better financial position to retain the staff necessary to get the mergers and acquisitions done. We recognize that the dividend, with a payout that exceeds current earnings, would further undermine the current stock price and pay less cash to the largest shareholders. However, maintaining such a high dividend leaves less cash available to pass on to their most valuable asset, the employees.”


After falling by 25% since our piece on July 22nd, it seems apparent that action on the dividend is warranted.  However, on November 9, 2011 as reported at Bloomberg.com (found here), CEO Scott Bok said:


“‘you’d have to waterboard me’ to persuade [me] to cut the firm’s quarterly dividend.”
Not accounting for Bok’s poor choice of words, we’re disappointed that such a stance only supports the largest shareholders instead of the longer-term interests of the company.  It seems that investors in Greenhill & Co. (GHL) have been provided fair warning by the CEO, if you want change it ain’t gonna happen with the dividend.

In the News: November 6, 2011

Please consider donating to the New Low Observer. Thank you.

Nasdaq 100 Watch List: November 4, 2011

Below are the Nasdaq 100 companies that are within 15% of their respective 52-week lows. Stocks that appear on our watch lists are not recommendations to buy. Instead, they are the starting point for doing your research and determining the best company to buy. Ideally, a stock that is purchased from this list is done after a considerable decline in the price and rigorous due diligence.

Symbol Name Price P/E EPS Yield P/B % from Low
BMC BMC Software, Inc. 35.97 14.74 2.44 0 4.02 3.28%
RIMM Research In Motion Limited 18.97 3.46 5.48 0 0.99 4.63%
NIHD NII Holdings, Inc. 23.83 13.48 1.77 0 1.28 4.79%
QGEN Qiagen N.V. 13.81 25.11 0.55 0 1.24 5.82%
CHRW C.H. Robinson Worldwide 68.72 26.74 2.57 1.70% 8.91 10.30%
MSFT Microsoft Corporation 26.25 9.54 2.75 3.10% 3.76 10.99%
EXPD Expeditors Int'l of Was 44.21 24.43 1.81 1.20% 5.03 12.69%
SIAL Sigma-Aldrich Corporation 63.58 17.66 3.6 1.10% 3.59 13.17%
LIFE Life Technologies 40.08 21.04 1.91 0 1.6 13.54%
ILMN Illumina, Inc. 32.77 42.01 0.78 0 3.62 14.01%
FSLR First Solar, Inc. 49.59 8.14 6.09 0 1.03 14.31%
MYL Mylan Inc. 18.51 19.3 0.96 0 2.31 14.47%
VOD Vodafone Group Plc 27.92 11.59 2.41 6.90% 1.02 14.85%

Watch List Summary

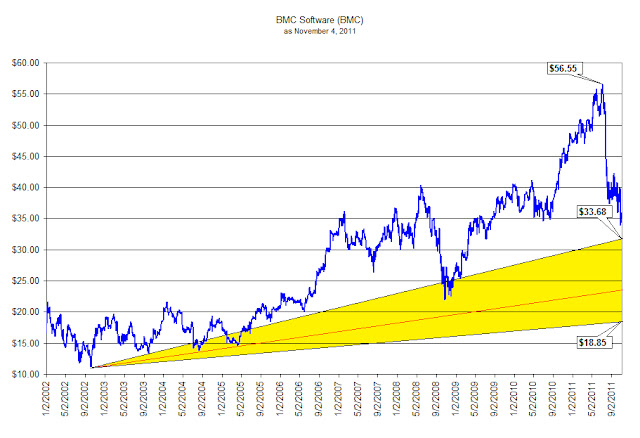
At the top our list this week is BMC Software (BMC).  Yahoo!Finance describes BMC Software (BMC) as a company that "develops software that provides system and service management solutions for enterprises in the United States and internationally."  According to Dow's Theory, BMC is considered fairly valued at $46.97.  Because we're technically in a bear market, our expectation is that $41.11, or 14.28%, is the upside target in the coming year.

Regarding downside targets, we're going to use Edson Gould's speed resistance lines.  Currently, BMC Software has a conservative downside target of $33.68 and an extreme downside target of $18.85.  The downside target of $18.85 is roughly 47% below the current price.  This is an acceptable level for where the stock could go and still be considered worth holding. 

In general the fundamentals for BMC seem strong. According to Value Line Investment Survey, BMC Software (BMC) has an upside target of $43.29 based on 2010 full year cashflow of $3.33. However, a strategy for accumulating the shares is necessary for any downside risk remaining.

Watch List Performance Review
In our ongoing review of the Nasdaq 100 Watch List, we have taken the stocks from our list of November 10, 2010 (found here) and have checked their performance one year later. The companies on that list are provided below with the closing prices from November 10, 2010 to November 4, 2011.

Symbol Company 2010 2011
change
WCRX Warner Chilcott
20.89
17.01
-18.57%
APOL Apollo Group
36.84
47.24
28.23%
TEVA Teva Pharma
50.81
40.93
-19.44%
ISRG Intuitive  Surgical
277.96
432.23
55.50%
AMGN Amgen
54.93
55.17
0.44%
Average return
9.23%
NDX Nasdaq 100 2187.74 2356.32
7.71%

The black line drawn in the month of February 2010 indicates the period when three of the five stocks had achieved annualized gains of 60% or more.  Apollo Group (APOL) and Intuitive Surgical (ISRG) had annualized gains of nearly 80% in the period covered.  Taken as a whole, the entire portfolio achieved an annualized gain of nearly 40% near the middle of February 2010.  In the end, it was Apollo Group (APOL) and Intuitive Surgical (ISRG) that carried the top five to an average gain of 9.23% over the last year.  The top 5 narrowly beat out the Nasdaq 100 by 1.52%, which is fine by us.

A Strategy is Needed for Lagging Gold Stocks

For gold stock investors, a timing strategy is the most effective way to match or beat the coming metal price increase. Among our caveats, we’re excluding junior and exploration mining companies which will either go out of business, experience share price booms or get acquired by peers or the majors. What follows is our examination of whether the lagging gold stocks, the inability of gold stocks to perform equal to or greater than the price of physical metal, is unique to our time or a fundamental hallmark of gold bull markets.

There is considerable discussion about the divergence between the price of gold and gold stocks. In the divergence, the price of gold has tended to rise to new highs while gold stocks (majors) either trade in a range, decline or increase at a tepid rate compared to the physical metal.

Some argue that due to the divergence, gold stocks represent the best investment opportunity because inevitably, the stocks will catch up with the metal. Others say that, the lack of confirmation of gold stocks to exceed prior highs is an indication that the metal is overvalued or needs to decline.

Unfortunately, although both points seem well reasoned (along with many other explanations), evidence from the previous gold bull market suggests that gold mining majors typically underperform the metal. The primary source that we’re drawing from is Richard Russell’s Dow Theory Letters from 1970 to 1979 with data points confirmed in Barron’s and Kitco.com for the respective dates.

On numerous occasions, Richard Russell would express his concern for the divergence between the price of gold and gold stocks. Below are Russell’s observations of the failure of gold stocks to follow the price of gold higher:

Meanwhile, despite the recent highs in the price of gold bullion, the gold stocks are not keeping up with the price of the yellow metal. I have received many calls from subscribers asking why.” (Richard Russell, Dow Theory Letters, May 17, 1972, Letter 529, page 6.)

The general feeling seems to be that the gold stocks have been discounting [falling in advance of] a decline in bullion.” (Richard Russell, Dow Theory Letters, September 27, 1974, Letter 610, page 6.)

“‘What’s happening to the shares’ I am asked. ‘Why don’t they move with gold?’” (Richard Russell, Dow Theory Letters, January 2, 1975, Letter 618, page 5.

At the bottom of the chart is the Barron’s Gold Average (stocks). This may move, too, but this Average has a long way to go to hit its 1974 high while gold could better the old 200 high easily. That should tell us something. And it’s the reason I’ve been saying all along-gold, not gold stocks.” (Richard Russell, Dow Theory Letters, November 9, 1977, Letter 713, page 5.)

Since Barron’s Average is very heavily weighted in favor of ASA, we are looking to a large extent at the relative performance of the S. African gold shares against bullion. The picture is clear enough. The market, since mid-1974. has preferred bullion to the gold shares. And who am I to argue with the market? That’s the reason I’ve been recommending gold, not the shares.” (Richard Russell, Dow Theory Letters, February 17, 1978, Letter 722, page 6.)

Since late-January the gold stocks have been reactionary whereas gold has been hitting new 1977-78 highs. In March both stocks and the metal declined, and as you can see the stocks broke below their February lows. Yet the metal has not confirmed on the downside, holding well above its February low. I take this non-confirmation as a bullish indication. I think it is telling us that the metal will not respond to gold share weakness, and it is telling us that the metal ‘wants’ to go to new highs. Whether the stocks will follow is another story.” (Richard Russell, Dow Theory Letters, April 5, 1978, Letter 726, page 6.)

My chart of gold and the gold averages (see page 6) is now showing a dramatic divergence. The gold stock average has broke” below its November low, but the bullion price has held well above that point.” (Richard Russell, Dow Theory Letters, May 5, 1978, Letter 729, page 5.)

This non-confirmation between gold and the gold stock average which I discussed in the last Letter is still in force. Many feared that the reactionary tendencies [decline] in the gold shares were calling for a correction in gold. For this reason many advisors have been telling their clients to sell their gold or even short gold. The consequences have been unhappy for the sellers, disastrous for the shorts.” (Richard Russell, Dow Theory Letters, November 1, 1978, Letter 742, page 5.)

My chart of gold bullion (daily) and the Gold Stock Average (GSA) documents the extraordinary divergence which continues to build between gold and GSA. Why did gold and GSA rally in tandem up to the October highs and why are the gold shares so

reluctant now?” (Richard Russell, Dow Theory Letters, February 28, 1979, Letter 751, page 7.

My chart of daily gold and the gold stock average (GSA) continues to picture divergence, with Campbell Red Lake and ASA stubbornly refusing to move back to their October highs.” (Richard Russell, Dow Theory Letters, July 5, 1979, Letter 760, page 6.)

I obviously cannot tell at this time whether gold is going to surge above 307 to a new high- or whether gold is in the process of topping out. The gold stocks have been weak, and my gold stock average has broken below the three minor bottoms. But so far, even weakness in the gold shares has not rubbed off on the metal.” (Richard Russell, Dow Theory Letters, August 15, 1979, Letter 763, page 6.)

To add to the consternation of gold stock investors, the period after the peak in the price of gold in January 1980 showed gold stocks held up better than the metal. This threw off “seasoned” gold investors because it gave the false impression that gold’s collapse would recover somehow. The following is Russell’s comments on this matter after the peak:

The gold stocks did not act during the 1980 decline the way they did during the 1974 debacle. This time they tended to hold very well. Now they are looking bullish (despite the many troubles, the increasing troubles in So. Africa). The shares, in other words, show good relative strength against the metal. This is a good sign for gold in general.” (Richard Russell, Dow Theory Letters, June 4, 1980, Letter 784, page 5.)

Although gold stocks are a leveraged play on the price of gold, there are critical points in time when gold stocks should be bought and then sold in order to take advantage of the leveraged characteristics. Those who buy and hold gold stocks for the “long term” will be disappointed with the performance as compared to the price of gold. Therefore, it is necessary to have a timing indicator that will highlight the best times to invest in gold stocks.

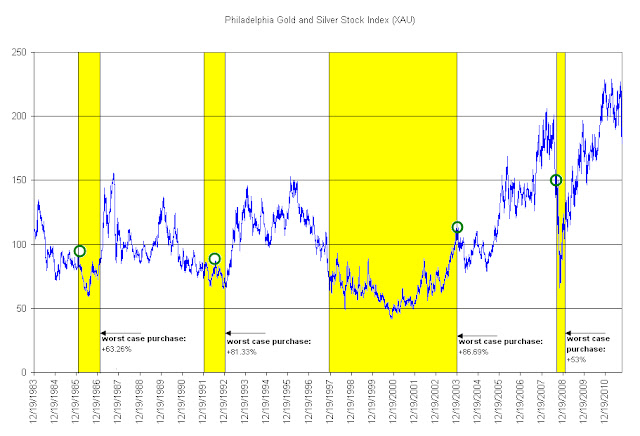
Below we have constructed a gold stock indicator based on the Philadelphia Gold and Silver Stock Index (XAU) which reveals the best times to accumulate and dispose of gold stocks. The points above the red line indicates the time to sell gold stocks and the points below the green line indicate when to buy gold stocks. We’ve taken the liberty of considering a sell indication whenever the indicator first reaches the red zone on a move to the upside and a buy/accumulate when the indicator first falls to the green line on a move to the downside.
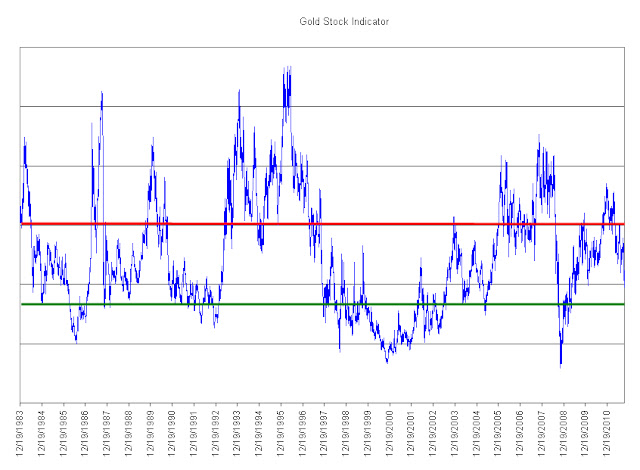
On average, sell indications occurred after a +52% increase in the XAU index. This does not account for the individual performance of gold stocks that are constituents of the index. The consistency of our Gold Stock Indicator reflected the best times to acquire the major gold stocks as well as the most ideal times to sell the gold stocks.
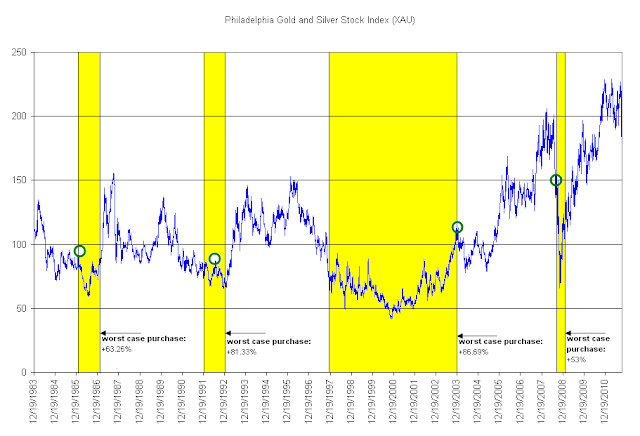
On the chart of the Philadelphia Gold and Silver Stock Index (XAU) above, we have shown where the indicated “buy/accumulate” recommendations would have taken place in yellow. The green circles show what would have happened if the purchase occurred at the worst possible time in the given period and is measured to the respective peaks in the XAU index soon after. As mentioned in many prior articles, we always account for at least -50% downside risk with any investment position that we take. This appears to be a minimum requirement when applying our indicator to the purchase of constituents of the Philadelphia Gold and Silver Stock Index (XAU).

For an investor who wishes to accumulate gold shares from within the XAU index, they would benefit from well timed purchases rather than getting whip-sawed by a wildly gyrating index that will inevitably underperform the price of gold in the “long-term.” We have identified the top five stocks that are likely to outperform the XAU index when the next buy signal is given. The five companies are AngloGold (AU), Yamana Gold (AUY), Gold Fields (GFI), Randgold (GOLD) and Royal Gold (RGLD).

The obvious alternative to buying gold stocks is with the physical asset. The paper version of gold is the SPDR Gold Shares (GLD). Although not truly tested through a full gold bull and bear cycle, GLD remains the among the most popular ways to “invest” in the physical asset. Our preference is for the non-paperized version of gold in the form of one-ounce coins.

As has been demonstrated in the gold bull market from 1970 to 1980, gold stocks (the majors) will generally underperform the price of gold. Those who are bound and determined to buy gold stocks can pursue the juniors and explorers which provide a wide range of outcomes that are independent of the price of gold (but helped by the rising value of gold) based on new discoveries, getting acquired or going bust. The alternative, buying the majors, should be done with a well constructed strategy that does not rely on hold-and-hope.