
- Japan
- Market Indicator
- Price Momentum Indicators
- Richard Russell
- Silver
- Speed Resistance Lines
- U.S. Dividend Watch List
Category Archives: speed resistance line
Nvidia Downside Targets
Posted in CHK, Edson Gould, NVDA, speed resistance line, Speed Resistance Lines, SRL
Tagged members
Tencent Holdings Downside Targets
Below are the downside targets for Tencent Holdings (TCEHY).
Posted in speed resistance line, SRL, TCEHY
Sanderson Farms SRL
Below are the Speed Resistance Lines (SRL) for Sanderson Farms (SAFM) from the 2014 peak and the subsequent decline along with the SRL for the 2017 peak and the projected decline.
DJIA: Downside Targets
Based on the nature of the decline in the market on February 2, 2018, it is worth examining the downside targets for the Dow Jones Industrial Average (DJIA). Below are the downside targets based on the work of Edson Gould’s Speed Resistance Lines.
Bitcoin: February 1, 2018
On December 22, 2017, we said the following of Bitcoin:
-
“We believe that there is going to be limited upside in the near term.”
-
“We think that the conservative downside target ($6,884.31) will be achieved before a new high is seen.”
-
“In all prior booms, the subsequent bust AVERAGED –70% (data found here).”
Below is the updated chart for Bitcoin along with our expected downside target.
Posted in Bitcoin, Edson Gould, speed resistance line, SRL
The Rise and Fall of GE
General Electric (GE) appears to be spiraling into oblivion. As we’ve suggested last year, we think that GE is going to be booted from the Dow Jones Industrial Average (DJIA). In this article, we’ll take a look at how GE got to this point and what might be in store for the stock price going forward.
1975-1981
It is possible that the beginning of the end for GE could have been marked by the acquisition of Utah International on December 16, 1976, in a deal that was dubbed “one of the largest acquisition proposals in the nation’s history.” That transaction set in motion the machinations of a complex set of accounting deals and dealings from which GE never seemed to extract itself from.
In the bid to acquire Utah International, General Electric, “…was able to use the pooling method [of accounting] to help boost its profits…” For GE, the “…unrecorded asset value would be reported as a gain…” when the eventual sale of those assets came due. Another benefit for GE would be that “…even if the assets were not later sold, their below market valuation allowed GE to understate its expenses (cost of sales and depreciation) and thereby overstate net income.” The problem with these methods of accounting slight-of-hand is that GE would not be able to wean itself from these strategies. In fact, this approach to acquisition and growth only increases as time went on.
Alarmingly, the acquisition of Utah International came after GE had exited the computer business. As noted at the time, “the computer business proved too much for Fred Borch [GE Chairman & CEO, 1967-1972]. Reg Jones [GE Chairman & CEO 1972-1981] made his mark getting us out of it. Will someone have to bail him [Reginald Jones] out of Utah International?” The combined Borch and Jones years are compared to the period from 2003-2018 during the tenure of Jeff Immelt in the chart below (using the approximate number of trading days going backward from January 19, 2018).

The entrance into the computer business followed by the entry into the mining business was simply one failure after the other. Adding insult to injury is the fact that the period from 1967 to 1981 was a confirmed secular bear market for stocks. However, the Utah International failure introduced the rampant and widespread use of creative accounting which would augment Jack Welch’s [GE Chairman & CEO 1981-2001] tenure during a secular bull market that began when the Dow Jones Industrial Average was trading at the 1,000 level and peaked at above 11,000.
1981-2001
Below is the stock price of GE during the Jack Welch years from 1981 to 2001 which coincided with a secular bull market in the same period of time.

The nature of secular bull markets often see company fundamentals improve and hopefully the stock price will follow. As shown above, the price of GE increased more than 45 times in the period from 1981 to 2000. However, when looking at the per share reported earnings, as provided by Value Line Investment Survey from 1982, we can see that earnings “only” increased a little less than 8 times.

While fundamentals, stock price, and market sentiment often coincide there is no rule that the stock price has to match the fundamentals in any way, shape, or form. However, seeing an “industrial” company’s stock price out-distance the reported earnings by such a wide margin suggests that the stock price might gravitate towards a more “realistic” mean eventually. The perfect setup for this reversion to the mean is a secular bear market, which in our view began in 2000 to 2016 period.
It could seem that choosing the year 2000 as the beginning of secular bear market is arbitrary, at best. However, as noted before, the well established stock market secular cycles and Warren Buffett’s November 1999 commentary of below average market performance for the 2000 to 2016 period is enough to convince us that the period in question isn’t random.
2001-2018
This leads us to the Jeff Immelt era as Chairman & CEO of General Electric from 2001 to 2017. There could not have been a worse period to be in charge of a hobbling industrial giant that is hamstrung with well entrenched accounting methods that work against the company when the stock price isn’t in a rising trend.
Remember, when Immelt took over at GE as Chairman & CEO on September 7, 2001, the stock price was already in the beginning stages of collapse after having fallen –34% up to that point. Even of the price of GE were to trade in range it would be bad news for the company. A falling stock price spelled disaster for investors who were hoping and expecting a rebound to the prior highs.

Many GE investors attribute the decline of GE’s stock price to the management practices of Jeff Immelt. However, much of this view is simply the mistaken attribution of correlation as causation.
If Warren Buffett thought, in late 1999, that we’d be lucky to see average market returns of +4% and GE fundamentals are calibrated to do better when the stock price rises then there is no evidence to suggest that Immelt did anything that was materially harmful (actual inflation adjusted CAGR of the S&P 500 return was +2.27%). Instead, what we’ve witnessed in GE stock price has been a reversion to the mean from the prior period of excess.
Price & Time Targets
Based on Edson Gould’s “Three Step” rule, GE has one more leg down. In theory, this should bring the GE stock price below the 2009 low. However, there is a lot of ground to cover for GE to get to the 2009 low and there is no guarantee that it will happen. With this in mind, we’ll outline the previous two declines, 2000-2002 & 2007-2009, to establish any possible precedent that might emerge.
-
2000-2002
-
The decline from the 2000 peak did not see any respite until 2002. That decline saw General Electric fall –63%. The period of decline lasted 530 trading days.
-
-
2007-2009
-
The decline from the 2007 peak ended in early 2009 and was approximately –84%. The period of decline lasted 359 trading days.
-
-
2016-present
-
So far, the price of General Electric (GE) has declined approximately –50.62% and has lasted 381 trading days. As seen in the chart below, GE has blasted through Gould’s Speed Resistance Lines at $25.66 and $18.32.
-

From what we can tell, the price target at the ascending $10.97 level is a lock (approximately $12.18). This would match the decline that was experienced by GE in the period from 2000-2002. The question becomes, will GE match the decline of 2007-2009, on a percentage basis. If so, then GE would decline to as low as $5.27. This would fit exactly with the nature and pattern of declines expressed by Gould in his “Three Step” rule.
Time targets seem to indicated that General Electric will reach the $10.97 or $5.27 low on April 20, 2018. The speed at which the current decline is taking place indicates that sentiment will push the stock to the $5.27 price and the elimination from the Dow Jones Industrial Average is eminent. We see the possible replacements for General Electric in the Dow Jones Industrial Average (DJIA) to be Adobe (ADBE), Expedia (EXPE), Google (GOOG) or Amazon (AMZN). In the case of Google and Amazon, their inclusion into the DJIA is predicated on a 10:1 stock split.
sources:
-
Stuart, Reginald. $1.9 Billion G.E. Bid in Mining Merger. New York Times. December 16, 1975. page 1.
-
Smith, Gene. Acquisition Set Today of Utah International. New York Times. December 20, 1976. page 67.
-
Schilit, Howard. Financial Shenanigans,2nd edition. McGraw Hill. 2002. page 103.
-
Value Line Investment Survey. General Electric. 1982-2018.
Posted in Edson Gould, GE, General Electric, speed resistance line, SRL, time target
Lam Research: Downside Targets
Review
The following is the pattern of price appreciation and decline for Lam Research (LRCX) from 1990 to 2017 with the application of Speed Resistance Lines [SRL].
1990 to 1998

In the period from 1990 to 1995, Lam Research (LRCX) increased more than +3,470%. From the peak of 1995, LRCX declined by –87.70% by 1998. Based on the peak at $23.92, all of the Speed Resistance Lines [SRL] achieved their downside targets.
In addition, we’ve included the scenario for if the peak in the price were to have been the $13.13 level. We included this because much of the analysis is based on parabolic moves to the upside. Because we couldn’t possibly know where the peak in the price would be in real-time, we attempt to take the view, “what would happen if we were wrong about the peak?” Amazingly, even if we had chosen the $13.13 peak and used the downside targets based on the SRLs, we would have seen all of them achieved and would have been otherwise pleased if only the conservative target was met.
1998 to 2003

In the above chart, from 1998 to 2000, LRCX increased +1,789%. in the following decline, LRCX fell as much as –87.90%.
There weren’t many “fake peaks” to initiate “what if” scenarios. However, let’s assume that along the way up we had run the SRL and tried to project downside targets. Any price above $14.00 would have generated a conservative downside target that the price action later achieved. Also note that the period when LRCX rose from $2.94 to $12.79 and then fell to $9.04 would have generated a conservative downside target of $9.72. This would have easily achieved the downside target.
2002 to 2008

In the period from 2002 to 2007, LRCX increased +777.67% and later declined as much as –74.56%.
Not much can be said other than all downside target being achieved of the course of a six year period. Again, in an attempt to prove our calculations wrong, we ran the $35.40 peak to see if the $19.80 number would have been an expected downside target. In the short term, the conservative downside target and mid range targets would have been accomplished. In the long term, from the $35.40 level to the $15.00 in 2008, the low in 2008 would have met the SRL parameters for downside targets being achieved.
2008 to 2017
Posted in entropy, Lam Research, LRCX, Nasdaq 100, parabolic, speed resistance line, SRL
Tagged members
Synopsys Downside Targets
Since the beginning of the bull market in 2009, Synopsys Inc. (SNPS) is a stock that has perform in line with the Nasdaq Composite Index until early 2016. Since February 2016, SNPS has accelerated well outside of the historical trend for the stock. While there are many fundamental reasons for excessive gains in the last two years, the gains are still excessive and therefore should, at minimum, revert to the mean.

The challenge with reversion to the mean is that the stock price will likely overshoot on the downside. With this in mind we have provided the Speed Resistance Lines indicating the conservative, mid range, and extreme price targets below.
Posted in downside, Edson Gould, SNPS, speed resistance line, SRL
Equifax: Downside Targets
Equifax is on a tear, to the downside. Let’s see what happened to the stock in the last decline from an all-time high and see if there is any precedence for what we can expect going forward.
2002-2009
In the period from 2002 to 2009, the price of Equifax (EFX) increased +158% to a high of $41.22. the decline that followed brought the stock to $17.80.

Equifax fell to the conservative downside target ($34.18) and the mid range downside target ($23.96). At the time, Equifax had an extreme downside target of ($13.74) but somehow didn’t manage to decline to that level, in spite of the fact that the housing crisis was co-opted by credit bureaus changing their standards which materially affected FICO scores.
“…the higher the credit score, the larger the increase in serious delinquency rates between 2005, 2006 and 2007. For example, for borrowers with the lowest credit scores (FICO scores between 500 and 600), the serious delinquency rate in 2007 was twice as large as in 2005—an increase of nearly 100 percent over the two years. For borrowers with the highest credit scores (FICO scores above 700), the serious delinquency rate in 2007 was almost four times as large as in 2005—an increase of nearly 300 percent. In addition, the serious delinquency rate in 2007 for the best-FICO group was almost the same as the rate in 2005 for the worst-FICO group.(Demyanyk, Yuliya. ‘Did Credit Scores Predict the Subprime Crisis?’ . Federal Reserve Bank of St. Louis. October 2008. link.).”
Bending of rules towards what was considered a prime rated credit score contributed significantly to lenders justifying the approval of home loans which later failed. With all this in mind, Equifax and their competitors should have fallen much more than they did. In fact, under normal conditions, at least one of the leading credit bureaus should have gone out of business.
Now, Equifax has declined based on a recent hack of their data systems. The resultant decline in the stock price seems natural. However, given the resilience of the stock price after the housing crisis, we have to default to the view that the company won’t go out of business but will be severely impacted in the short-term.
Posted in Edson Gould, EFX, speed resistance line, SRL
Activision Blizzard: Downside Targets
Review
The following is the pattern of price appreciation and decline for Activision Blizzard (ATVI) from 1993 to 2017 with the application of Speed Resistance Lines [SRL].
1993 to 1996

In the period from 1993 to 1996, we can see that Activision Blizzard (ATVI) increase from $0.27 to as high as $1.50 or a gain of +455%. The decline that followed saw ATVI fall –58%, achieving the conservative downside target of $0.80 and the mid range downside target of $0.65. Although the chart doesn’t show it, ATVI did not rises above the 1995 level and subsequently fell as low as $0.43 by 2000 and ultimately achieving the extreme downside target of $0.50 in the process.
1999 to 2003

In the period from 1999 to 2003, ATVI rose from $0.43 to as high as $3.96, a gain of +821%. The resulting decline saw ATVI drop –63%. In the chart above we do note a possible scenario that the SRL is run on the stock at the $3.12 peak, assuming you don’t know where the ultimate peak would be. In such an instance, a conservative downside target of $1.83 and a mid range target of $1.44 were calculated.
In the big scheme of things, the conservative downside target was achieved and the mid range target was one penny short of the mark in 2002. The point of this exercise is to see, what would have been the outcome if there was an error in the timing of the calculation of the downside targets. As we shall see, these situations are all too real with outcomes that are generally surprising. However, in the immediate decline after the $3.12 price peak, the conservative downside target of $1.83 was $0.02 cents short of the $1.85 low set in September 2001.
2002 to 2009

In the period from 2002 to 2009, ATVI increased in price by +1,084%. The decline that followed brought the stock down as much as –56% before a recovery ensued. Again, we have marked off the points where an error of early use of the SRL could have been applied. In each of the three examples, the conservative downside target was achieved. Suffice to say, in the case of the SRL and price peaks, the conservative downside target is a reasonable point of reference for consideration of ATVI.
2012 to 2017
The price action of ATVI has seen the stock price increase from a 2012 low of $10.08 to the 2017 high of $66.16. The gain in the stock price has been +556%. Our SRL has the following downside targets:
Swiss National Bank: Downside Targets
In a posting on ZeroHedge there is mention of Swiss National Bank (SNBN) and the “bubble” that seems to be percolating in the stock. We don’t know whether or not the price of the stock is in a bubble. However, what does resonate with us is any sign of a parabolic rise in price. In the case of SNBN, we believe that we can attribute Speed Resistance Lines (SRL) that are consistent with viable downside targets.
First, whenever applying SRLs, we like to find out if there has been any precedence on the matter. In the case of SNBN, we have obtained data from Yahoo!Quotes (ChartIQ), which goes back to 1995. It is just our luck that there is a prior period when SNBN has a similar rise and subsequent decline.

Considering that there is a reasonable amount of precedent in the stock price movement of SNBN in the period from 1995 to 1997, we have taken the liberty in projecting what the current level of price increase could result in, if history is any guide.
Posted in Edson Gould, entropy, parabolic, SNBN, speed resistance line, SRL
Review: Lumber Liquidator
As early as February 2015, when the stock price of Lumber Liquidator (LL) was trading at $50, we had indicated that there was a risk that Lumber Liquidator could decline below $23.47. Since that time, LL had declined as low as $11.
In March 2015, we outlined our own theory of a coincidence indicator that would help investors know when the price of LL should recover. Since that time, LL has fallen in line with our theory and has subsequently increased in price along with our proposed coincidence indicator.
From the low in LL stock price in 2016, we have seen the stock price climb as much as +200%. The actual gain based on our recommended purchase price would be approximately +16% (8% annualized) assuming equal share amounts at/or below the recommended levels.
So what does the coincidence indicator say about LL and the prospects going forward? The chart below is clear on this matter:
Clean Harbors: Coincidence Confirmed, Again
On February 9, 2012, we posted Edson Gould’s Speed Resistance Lines [SRL] regarding Clean Harbors (CLH). Our hope at the time was that our prior work on the top of Gould’s work would be handily refuted or confirmed. At the time we posed the following SRL:
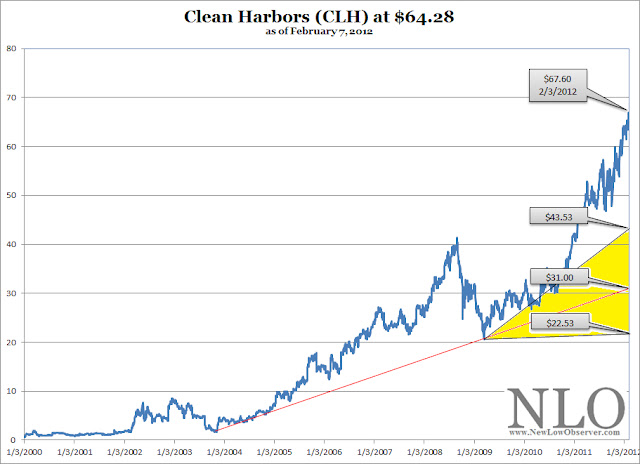
For us, our expectation was that the Clean Harbors would, at minimum, descend to the conservative downside target of $43.53. Well, the timing and coincidence were in our favor as CLH fell –40% to the appointed levels that we thought the stock should descend.
As with all Speed Resistance Lines, there is a chance that the stock will continue to move higher. However, at each point higher we readjust the SRL and arrive at new downside target. In the case of CLH, the stock increased from the $67.60 price to as high as $70.30 thereby requiring an adjustment of the downside targets higher as well. Remember, if the stock does not hit downside targets avoid it. When and if the stock falls to the target, review for potential investment.
Finally, for no explicable reason, when all seemed in favor of the stock, CLH declined from the $70.30 peak to the low of $37.09 achieved in January 2016. By achieving such an improbable low (improbable to those who were buying CLH in February 2012) CLH stock price appeared to be worth considering. For this reason, we iterated a review of CLH for investment consideration on December 14, 2015. Since our mid-December 2015 review, CLH has increased by +39%.

At this point, we’d consider our general analysis of CLH a success from the December 2015 posting. What do we see going forward? We see two critical upside resistance levels to watch for. The first upside resistance is at $59.00 and the second upside resistance level is at $69.00. Obtaining a +39% gaining in a 1-year period might suggest that an investor consider selling all of their CLH holdings and reinvesting the funds somewhere else.
The Cold Hard Truth
Granted, luck and timing have a lot to say in any and all the work that we produce, however, that does not mean that our efforts on the topic should be dismissed as there may be some value in what we’re trying to accomplish. Since the very first of our SRLs we’ve had more than 80% of the SRL downside targets achieved at the point of the initial examination. This generally could could be considered a success. However, of the 20% that have not been successful are positions that we’ve taken a real world investment in, which totally sucks.
In spite of the prevailing reality we continue to attempt to mitigate the available information with the stocks of interest to us. We’ll narrow down this situation to a point where the SRL will work and/or we’ll still be able to benefit regardless of whether an immediate rebound is experienced.
Posted in Clean Harbor, CLH, Edson Gould, speed resistance line, SRL
Nasdaq Biotechnology ETF
The iShares Nasdaq Biotechnology ETF (IBB) is trading in range that ultimately needs to be resolved. The outcome is either falling dramatically below $240 or striking the $343 level before doing a retest of the prior high around $400.

Already, IBB has managed to resist falling below the ascending $218.37 level. This is in defiance of our belief that a highly volatile sector and fund should retest the extreme downside target of $133.60. Those wanting to have exposure to the biotech sector but unwilling to take on the individual risk should consider the prospects of this ETF.
Posted in Edson Gould, IBB, speed resistance line, SRL
Nvidia Downside Targets
Below are the downside targets based on the work of Edson Gould and the precedent setting periods from 1999 to the present.