Category Archives: SRL

Clean Harbors (CLH): Downside Targets

On February 9, 2012, when the stock was trading at $64.28, we reviewed the Speed Resistance Lines for Clean Harbors (CLH).  At that time we indicated the Clean Harbors had the following downside targets (found here):

  • $43.53
  • $31.00
  • $22.53

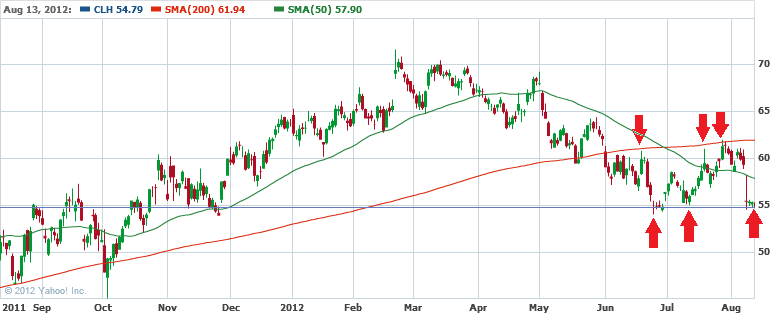
Currently, Clean Harbors (CLH) has declined to the $54.80 level which, in our view, happens to be a critical support level for shareholders of the stock.  As can be seen in the chart below, the price of CLH fell below the 200-day moving average (red line) on June 1, 2012.  Additionally, on three occasions the price of CLH attempted and failed to exceed the 200-day moving average (red line).

image

CLH is now bouncing along the support level of $55 (blue line).  It is not clear whether the stock is going to retest the 200-day moving average which presently sits at $61.94.  However, any additional decline in the stock price will likely lead to falling to $47.83.

Buckle (BKE): A Review

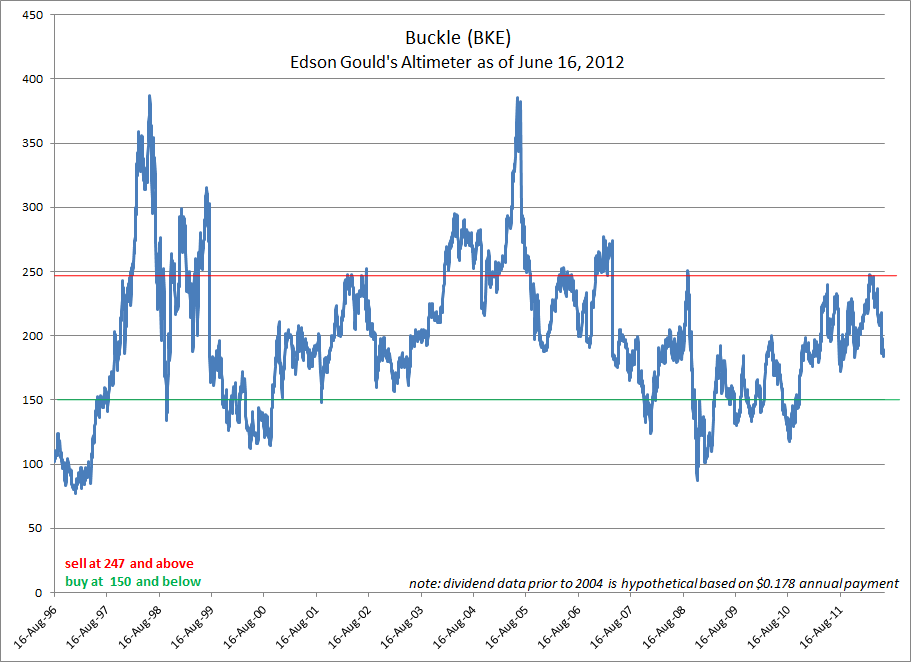
The following is a review of Buckle (BKE) using Edson Gould’s Altimeter.

image

Below is the performance of the buy and sell indications of Edson Gould’s Altimeter based on periods when the indicator first cross below 150 for buy indication, and above 247 for sell indications.

Date Price Altimeter buy/sell % change $1 invested
6/12/1997 6.57 148 buy 69% $1.69
1/28/1998 11.13 250 sell -47%  
10/8/1998 5.95 134 buy 85% $3.13
11/6/1998 11.01 248 sell -41%  
11/4/1999 6.51 146 buy 69% $5.30
3/19/2002 11.01 248 sell 120%  
11/19/2007 24.26 146 buy 72% $9.13
9/18/2008 41.78 251 sell -43%  
10/23/2008 23.94 144 buy 107% $18.90
3/9/2012 49.56 248 sell -39%  
????????? 30 150 buy ?????????  

The consistency of the indicator is amazing.  Only the sell indication of March 19, 2002 resulted in an outcome that was contrary to the desired result.  Even so, A person who only bought BKE based on the buy signal and sold based on the sell indication would have resulted in a gain of 1,890% from June 12, 1997 to the present.  This is compared to the buy and hold total return with reinvestment of dividends (including special dividends) of 766.21%.  Based on capital appreciation alone, the price of BKE rose 498% since June 12, 1997.

  • +1,890% (buy/sell Altimeter)
  • +766% (dividends reinvested)
  • +498% (based on price change only)

In the table above, the section in blue is the tentative estimate of when the next buy signal will be registered and the amount of decline necessary to get to the signal.  It appears that based on the sell indication from March 9, 2012 to the price of $30, BKE would have to decline -39% using the Altimeter.  Such a decline is well within the prior successful sell indications that resulted in losses.

We are very interested in this stock at the right price.  We believe that BKE will be a buy at $30 and below.  However, prior price movement based on Gould’s speed resistance lines indicated that the conservative downside target is $24.47 and the extreme downside target of $16.68.

Historically, based on prior Altimeters, a buy indication does not mean that the price decline has actually ended. Therefore, if the buy indication is triggered then be prepared by making your purchase of the stock in, at least, two stages. Once at the trigger price and again at any desirable price lower than the trigger level.

Downside Targets for Herbalife (HLF)

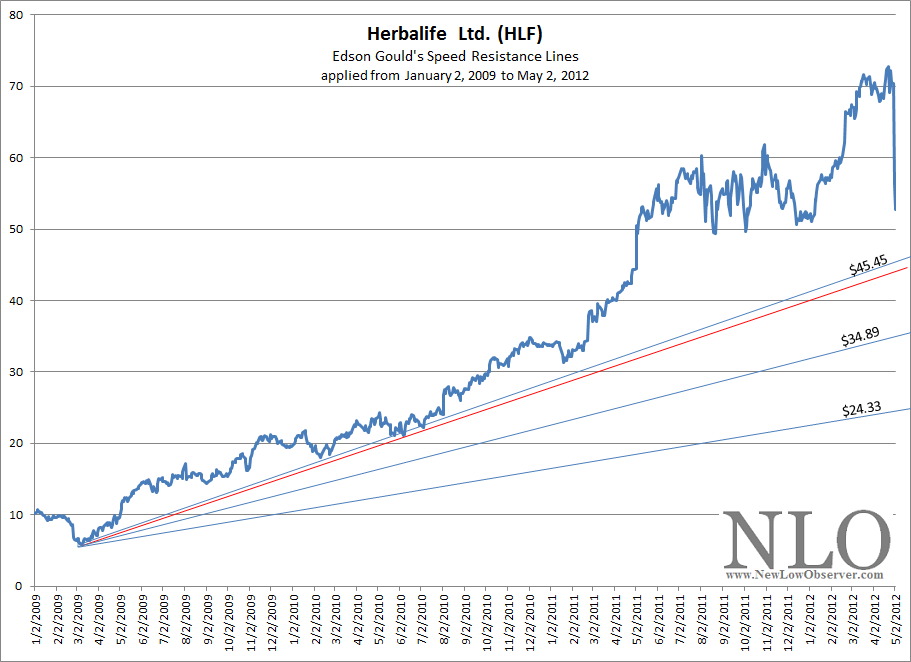
After the news of Herbalife (HLF) getting slammed, we were curious about what the downside targets for the stock might be using Edson Gould’s Speed Resistance Lines.  Below is a chart representing the conservative downside target of $45.45 and the extreme downside target of $24.33.

So far, HLF appears to have support for the stock price at $45.45.  However, if HLF falls below the $45.45 level, it would suggests that HLF will decline to, at minimum, $34.89 before finding stabilization in the stock price.  A decline $24.33 would mean that HLF could revisit the 2009 lows.

image

We believe that it is worth examining whether or not these downside targets are accomplished.  In our view, the downside targets are reasonable estimates of where the stocks could go before initiating new research on whether these companies have viable business models.

Disclaimer: This piece is a continuation of the examination of Edson Gould’s speed resistance lines as explained in prior articles. This is not an endorsement to sell short at the current levels nor buy these stocks once falling below the extreme downside targets.

Green Mountain Establishes New Downside Target

On October 25, 2011, we published a chart of Green Mountain Coffee Roasters (GMCR) that utilized Edson Gould’s Speed Resistance Lines [SRL] to determine what the possible downside targets might be.  At the time, Green Mountain Coffee Roasters was trading at $64.75.  However, our use of the SRL indicated GMCR had a conservative downside target of $59.63 and an extreme downside target of $37.21.

After reach the level of $59.63, GMCR’s stock price rose marginally before falling significantly to the downside resting at the $39.42 level.  Soon afterwards, GMCR rose as high as $70, but did not go above the SRL rising trend established at $59.63.

After reaching the $70 level, GMCR promptly fell to the $37.21 level which established what we believed to be a “support” level (green arrows; definition here).  Support levels, if broken, would result in the stock of GMCR going to the previous downside levels that helped to establish the upside trend at $22.53 and $8.30.

In after-hours trading on May 2, 2012, GMCR plummeted from the closing price of $49.52 to as low as $28.50, a loss of -42%.  We believe that GMCR  has a new support level of $22.53 and upside resistance (definition here) at $42.  If the price of GMCR falls significantly below $22.53 (i.e. $21) then we would expect that the new downside target of GMCR is $8.30.

image

As an investor, if you have a stop-loss order (definition here) at $45, then you’ll only be able to get out of the stock at the next best price.  This means that if GMCR opens at $30 tomorrow, you’re only able to get out of GMCR at $30, not $45-$44 under normal market conditions.  Right off the bat, you’ll lose 33% more than you had planned. 

Typically, when a stock crashes it would usually rebound to a higher level before continuing the declining trend (if it happens to be going lower).  The stop-loss order will trigger automatic selling of GMCR even though we expect that it might rebound from the $28.50 low of today to, at least, $35.50 tomorrow.  If nothing else, selling on the short-lived rebound would reduce the amount of loss while a stop-loss order typically ensures the maximum loss in the shortest period of time.

This explains why we are against the use to stop-loss orders as a means to avoid losses.  The best way to avoid significant lose is to consider the downside targets before buying a stock.  After considering the downside, we recommend putting an amount that you’re comfortable with even if the stock were to decline -50%.