
We’ve reached the end of 2012 and here are the 60 companies on our U.S. Dividend Watch List that are within 11% of their respective 52-week lows. Stocks that appear on our watch lists are not recommendations to buy. Instead, they are the starting point for doing your research and determining the best company to buy. Ideally, a stock that is purchased from this list is done after a considerable decline in the price and rigorous due diligence.
| Symbol | Name | Price | % Yr Low | P/E | EPS (ttm) | Dividend | Yield | Payout Ratio |
| ED | Consolidated Edison, Inc. | 54.93 | 0.04% | 14.42 | 3.81 | 2.42 | 4.41% | 64% |
| INTC | Intel Corp. | 20.23 | 0.10% | 8.83 | 2.29 | 0.90 | 4.45% | 39% |
| CFR | Cullen/Frost Bankers, Inc. | 54.08 | 1.01% | 14.31 | 3.78 | 1.92 | 3.55% | 51% |
| NJR | New Jersey Resources Corp. | 39.03 | 1.35% | 17.50 | 2.23 | 1.60 | 4.10% | 72% |
| TEG | Integrys Energy Group Inc | 51.61 | 1.59% | 16.28 | 3.17 | 2.72 | 5.27% | 86% |
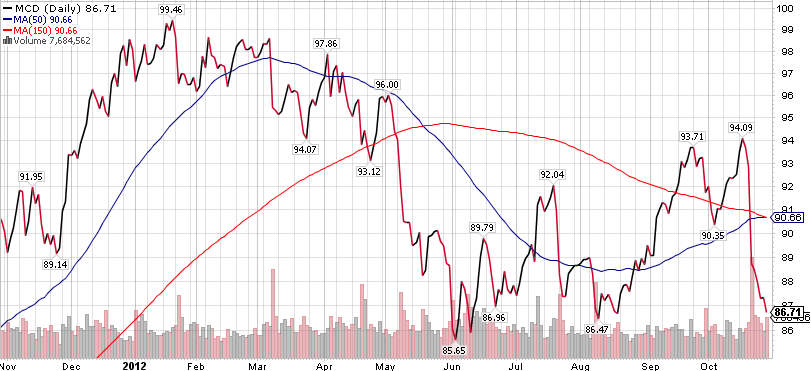
| MCD | McDonald's Corp. | 87.58 | 1.93% | 16.49 | 5.31 | 3.08 | 3.52% | 58% |
| PRK | Park National Corp. | 63.08 | 2.29% | 14.30 | 4.41 | 3.76 | 5.96% | 85% |
| OMI | Owens & Minor, Inc. | 28.05 | 2.48% | 16.40 | 1.71 | 0.88 | 3.14% | 51% |
| FDS | FactSet Research Systems | 87.68 | 2.69% | 20.68 | 4.24 | 1.24 | 1.41% | 29% |
| SON | Sonoco Products Co. | 29.45 | 2.94% | 16.54 | 1.78 | 1.20 | 4.07% | 67% |
| SCG | SCANA Corporation | 45.10 | 4.11% | 14.50 | 3.11 | 1.98 | 4.39% | 64% |
| WABC | Westamerica BanCorp. | 42.17 | 4.12% | 14.06 | 3.00 | 1.48 | 3.51% | 49% |
| WEYS | Weyco Group, Inc. | 22.95 | 4.27% | 14.90 | 1.54 | 0.68 | 2.96% | 44% |
| ATR | AptarGroup Inc. | 47.34 | 4.76% | 19.48 | 2.43 | 0.88 | 1.86% | 36% |
| PPL | PP&L Corporation | 28.18 | 5.62% | 10.14 | 2.78 | 1.44 | 5.11% | 52% |
| NWN | Northwest Natural Gas Co. | 43.32 | 5.63% | 19.17 | 2.26 | 1.82 | 4.20% | 81% |
| VVC | Vectren Corp. | 29.02 | 5.68% | 14.66 | 1.98 | 1.42 | 4.89% | 72% |
| ETP | Energy Transfer Partners | 42.48 | 5.70% | 9.77 | 4.35 | 3.58 | 8.43% | 82% |
| CBU | Community Bank System | 26.91 | 6.03% | 13.66 | 1.97 | 1.08 | 4.01% | 55% |
| SJI | South Jersey Industries | 49.48 | 6.36% | 14.60 | 3.39 | 1.77 | 3.58% | 52% |
| DCI | Donaldson Co. Inc. | 32.46 | 6.39% | 19.79 | 1.64 | 0.36 | 1.11% | 22% |
| BOH | Bank of Hawaii Corp. | 44.08 | 6.45% | 12.18 | 3.62 | 1.80 | 4.08% | 50% |
| UBSI | United Bankshares, Inc. | 24.04 | 6.65% | 14.84 | 1.62 | 1.24 | 5.16% | 77% |
| ANAT | American National Insurance | 67.99 | 6.77% | 9.97 | 6.82 | 3.08 | 4.53% | 45% |
| RBCAA | Republic BanCorp., Inc. | 20.90 | 6.85% | 3.69 | 5.66 | 0.66 | 3.16% | 12% |
| IBM | IBM | 189.83 | 7.04% | 13.65 | 13.91 | 3.40 | 1.79% | 24% |
| TRMK | Trustmark Corp. | 22.23 | 7.08% | 12.70 | 1.75 | 0.92 | 4.14% | 53% |
| WGL | WGL Holdings, Inc. | 38.65 | 7.48% | 14.26 | 2.71 | 1.60 | 4.14% | 59% |
| AJG | Arthur J Gallagher & Co. | 34.47 | 7.69% | 20.52 | 1.68 | 1.36 | 3.95% | 81% |
| PNY | Piedmont Natural Gas Co. | 30.72 | 7.75% | 18.51 | 1.66 | 1.20 | 3.91% | 72% |
| PX | Praxair, Inc. | 107.90 | 7.90% | 19.23 | 5.61 | 2.20 | 2.04% | 39% |
| KO | Coca-Cola Co | 35.97 | 8.07% | 18.83 | 1.91 | 1.02 | 2.84% | 53% |
| BDX | Becton, Dickinson and Co. | 77.34 | 8.08% | 13.84 | 5.59 | 1.98 | 2.56% | 35% |
| WBS | Webster Financial Corp. | 20.41 | 8.10% | 11.47 | 1.78 | 0.40 | 1.96% | 22% |
| CWT | California Water Service | 18.21 | 8.14% | 16.71 | 1.09 | 0.63 | 3.46% | 58% |
| SYBT | S.Y. BanCorp., Inc. | 21.90 | 8.20% | 11.90 | 1.84 | 0.80 | 3.65% | 43% |
| JW-A | John Wiley & Sons Inc. | 38.56 | 8.25% | 12.32 | 3.13 | 0.80 | 2.07% | 26% |
| DBD | Diebold, Inc. | 30.03 | 8.57% | 11.38 | 2.64 | 1.14 | 3.80% | 43% |
| APD | Air Products & Chemicals | 82.93 | 8.96% | 15.24 | 5.44 | 2.56 | 3.09% | 47% |
| CTBI | Community Trust BanCorp. | 31.75 | 8.99% | 11.14 | 2.85 | 1.26 | 3.97% | 44% |
| AROW | Arrow Financial Corp. | 24.64 | 9.04% | 13.46 | 1.83 | 1.00 | 4.06% | 55% |
| TMP | Tompkins Financial Corp. | 39.11 | 9.18% | 15.96 | 2.45 | 1.52 | 3.89% | 62% |
| EGN | Energen Corp. | 43.90 | 9.39% | 15.46 | 2.84 | 0.56 | 1.28% | 20% |
| PEP | PepsiCo Inc. | 68.02 | 9.44% | 18.09 | 3.76 | 2.15 | 3.16% | 57% |
| CLX | Clorox Co. | 72.66 | 9.48% | 17.64 | 4.12 | 2.56 | 3.52% | 62% |
| ABM | ABM Industries, Inc. | 19.58 | 9.69% | 17.18 | 1.14 | 0.60 | 3.06% | 53% |
| MSEX | Middlesex Water Company | 19.18 | 9.73% | 22.30 | 0.86 | 0.75 | 3.91% | 87% |
| THFF | First Financial Corp. | 29.71 | 9.75% | 11.43 | 2.60 | 0.96 | 3.23% | 37% |
| LKFN | Lakeland Financial Corp. | 25.78 | 9.84% | 12.05 | 2.14 | 0.68 | 2.64% | 32% |
| IBKC | IBERIABANK Corp. | 48.71 | 10.00% | 20.30 | 2.40 | 1.36 | 2.79% | 57% |
| MRK | Merck & Co., Inc | 40.64 | 10.11% | 18.47 | 2.20 | 1.72 | 4.23% | 78% |
| SYK | Stryker Corp. | 54.45 | 10.16% | 14.64 | 3.72 | 1.06 | 1.95% | 28% |
| CLC | Clarcor Inc. | 47.15 | 10.29% | 19.40 | 2.43 | 0.54 | 1.15% | 22% |
| CAH | Cardinal Health, Inc. | 40.72 | 10.32% | 12.89 | 3.16 | 1.10 | 2.70% | 35% |
| XOM | Exxon Mobil Corp. | 85.10 | 10.33% | 9.00 | 9.46 | 2.28 | 2.68% | 24% |
| ADP | Automatic Data Processing | 56.33 | 10.69% | 19.90 | 2.83 | 1.74 | 3.09% | 61% |
| MCY | Mercury General Corp. | 39.87 | 10.72% | 10.22 | 3.90 | 2.45 | 6.14% | 63% |
| YUM | Yum! Brands, Inc. | 64.72 | 10.82% | 19.04 | 3.40 | 1.34 | 2.07% | 39% |
| CAT | Caterpillar Inc. | 86.81 | 10.94% | 8.89 | 9.76 | 2.08 | 2.40% | 21% |
| ADM | Archer Daniels Midland Co. | 27.06 | 10.99% | 18.92 | 1.43 | 0.70 | 2.59% | 49% |
| 60 Companies | ||||||||
Watch List Review
This week, we will refer you to our comments made last week on top company, Consolidated Edison (ED). That commentary also apply to the fourth company on our list, New Jersey Resources (NJR).
Second on our list is Intel (INTC), the largest chip maker and a Dow component. In addition to that, Intel made our Dog of the NLO list and Dog of the Dow. More on that in our post Dog of the Dow – A Look Back at 2012 & Forward to 2013.
In addition to Intel, we’d like to highlight several blue chip companies on this list. McDonald’s (MCD), IBM (IBM), and Caterpillar (CAT). These companies made the list and are mentioned in our article above. With the Dow underperforming the S&P500 (+5.9% vs 11.5%), our guess is that these companies are poised to out perform in the year to come.


