Below is Nacco Industries (NC) from 1979 to 2023 applying the Price Momentum Indicator.
- Japan
- Market Indicator
- Price Momentum Indicators
- Richard Russell
- Silver
- Speed Resistance Lines
- U.S. Dividend Watch List

Below is Nacco Industries (NC) from 1979 to 2023 applying the Price Momentum Indicator.
Below are the valuation targets for Nacco Industries Inc. (NC) for the next 10 years. Continue reading
Below are the valuation targets for Nacco Industries Inc. (NC) for the next 10 years. Continue reading
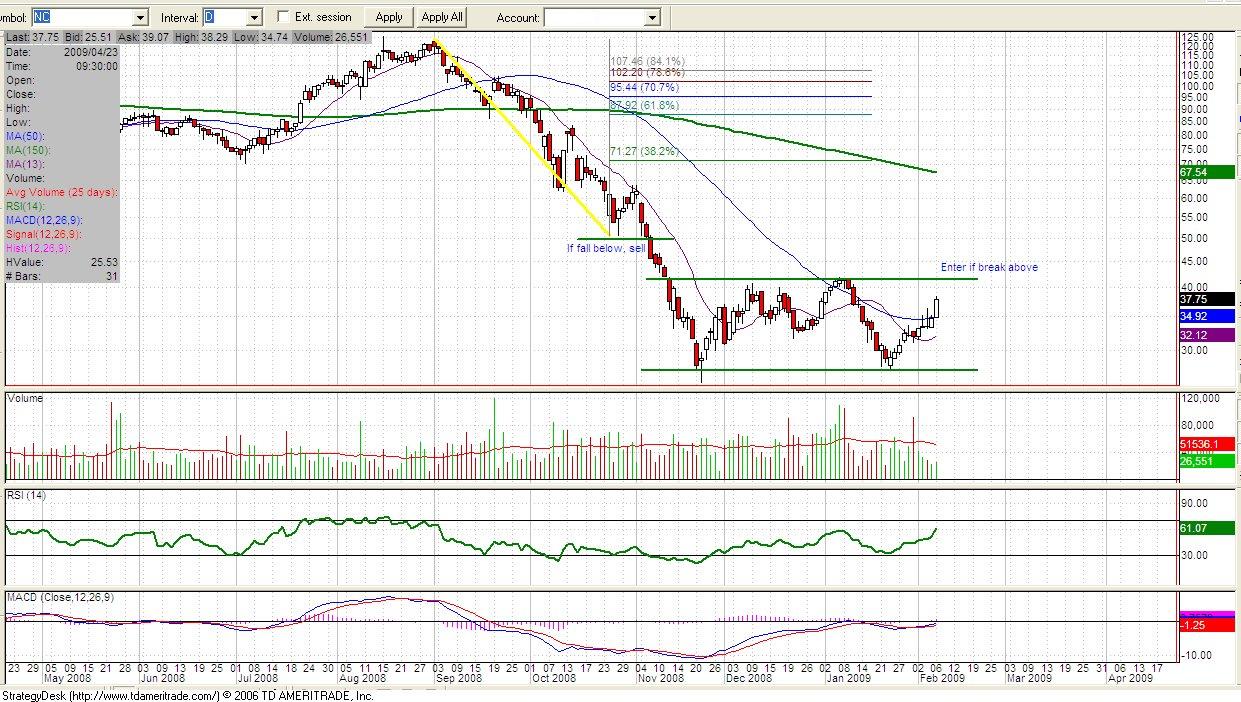
On October 1, 2012, Hyster-Yale Materials (HY) was spun off from Nacco Industries (NC). Nacco has been a company of particular interest to us since it has increased the dividend every year for nearly 29 years in a row.
|
Symbol
|
Close date
|
Total % Gain | % of Portfolio | |||
|
(FDO)
|
|
1/31/2008
|
|
10.65%
|
|
96.67%
|
|
(WSC)
|
|
2/11/2008
|
|
-3.93%
|
|
94.28%
|
|
(AIG)
|
|
2/28/2008
|
|
12.52%
|
|
82.65%
|
|
(CTAS)
|
|
3/13/2008
|
|
-3.81%
|
|
29.43%
|
|
(CDE)
|
|
3/13/2008
|
|
-12.42%
|
|
1.91%
|
|
(BSC)
|
|
3/14/2008
|
|
7.33%
|
|
26.10%
|
|
(HTX)
|
|
3/24/2008
|
|
1.73%
|
|
29.52%
|
|
(KGC)
|
|
3/24/2008
|
|
-16.73%
|
|
38.15%
|
|
(CTAS)
|
|
4/16/2008
|
|
-4.34%
|
|
31.11%
|
|
(GSS)
|
|
4/16/2008
|
|
-13.21%
|
|
1.77%
|
|
(NC)
|
|
7/23/2008
|
|
27.30%
|
|
32.11%
|
|
(MSA)
|
|
8/11/2008
|
|
19.02%
|
|
36.71%
|
|
(WIN)
|
|
8/14/2008
|
|
5.55%
|
|
27.27%
|
|
(BGG)
|
|
8/27/2008
|
|
1.27%
|
|
31.38%
|
|
(ANAT)
|
|
9/9/2008
|
|
-11.64%
|
|
28.26%
|
|
(EXPD)
|
|
9/9/2008
|
|
-5.51%
|
|
33.01%
|
|
(HPQ)
|
|
9/9/2008
|
|
115.03%
|
|
0.07%
|
|
(NSEC)
|
|
9/9/2008
|
|
-17.36%
|
|
3.08%
|
|
(TDS)
|
|
9/9/2008
|
|
-3.97%
|
|
38.10%
|
|
(NEM)
|
|
9/17/2008
|
|
3.27%
|
|
32.03%
|
|
(HL)
|
|
9/18/2008
|
|
5.70%
|
|
39.06%
|
|
(AIG)
|
|
9/23/2008
|
|
33.94%
|
|
38.27%
|
|
(ANAT)
|
|
9/29/2008
|
|
2.80%
|
|
29.25%
|
|
(ADM)
|
|
9/30/2008
|
|
-8.43%
|
|
20.77%
|
|
(WAG)
|
|
9/30/2008
|
|
-1.75%
|
|
44.09%
|
|
(TMR)
|
|
10/7/2008
|
|
-14.66%
|
|
11.36%
|
|
(NXG)
|
|
10/7/2008
|
|
-12.72%
|
|
11.40%
|
|
(AEM)
|
|
10/10/2008
|
|
-3.03%
|
|
15.58%
|
|
(FNM)
|
|
10/10/2008
|
|
-46.25%
|
|
7.14%
|
|
(GSS)
|
|
10/10/2008
|
|
-8.66%
|
|
12.11%
|
|
(JOF)
|
|
10/14/2008
|
|
2.34%
|
|
22.18%
|
|
(DOG)
|
|
10/15/2008
|
|
1.14%
|
|
43.23%
|
|
(AIG)
|
|
10/20/2008
|
|
-2.55%
|
|
66.35%
|
|
(BMI)
|
|
10/22/2008
|
|
-5.40%
|
|
35.38%
|
|
(EUM)
|
|
10/27/2008
|
|
5.26%
|
|
46.63%
|
|
(AEM)
|
|
10/28/2008
|
|
-4.08%
|
|
25.83%
|
|
(ABX)
|
|
10/28/2008
|
|
-2.92%
|
|
24.26%
|
|
(CTL)
|
|
10/31/2008
|
|
-9.93%
|
|
34.18%
|
|
(NC)
|
|
10/31/2008
|
|
-0.14%
|
|
43.42%
|
|
(NC)
|
|
11/7/2008
|
|
-12.16%
|
|
49.47%
|
Because the company’s stock price at year-end was significantly below the company’s book value of tangible assets and its book value of equity, accounting rules effectively required that the company take a non-cash write-off of goodwill and certain other intangible assets totaling $436 million or 431.6 million net of taxes of $4.1 million.
Art
Comments Off on Stock Checkup: Nacco Industries Inc. (NC)
Posted in Nacco Industries, NC