Category Archives: Dividend Watch List

U.S. Dividend Watch List: Top 5 by Ratios

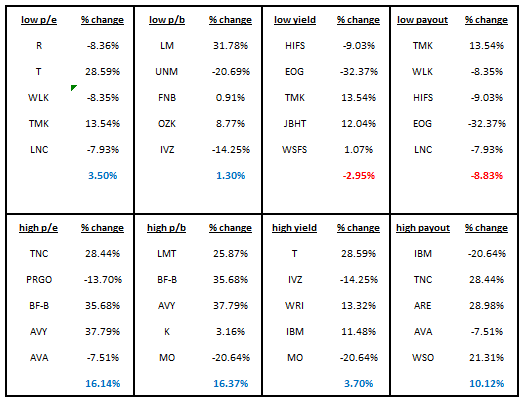
Below is the performance of the top 5 stocks by fundamental ratios that we follow from our watch list dated November 16, 2018:

image

All of the “high” categories exceeded the performance of the “low” categories.  The area of exceptional performance was in the high yield stocks exceeding the returns of the low yield stocks.  This is generally uncharacteristic as noted in extensive data that we’ve collected since 1996.

image

In the last year, the Dow Jones Industrial Average gained approximately +8.14%.

Below are the top five stocks by fundamental ratios for the U.S. Dividend Watch List dated November 1, 2019: Continue reading →

U.S. Dividend Watch List: Top 5 by Ratios

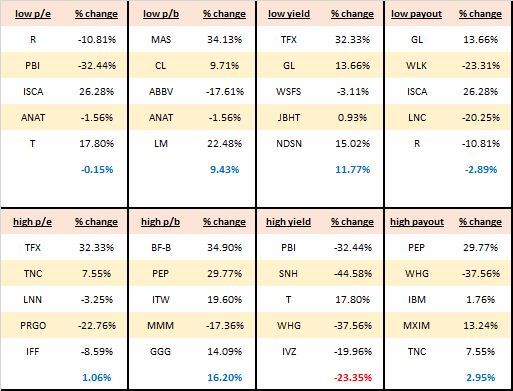
Below is the performance of the top 5 stocks by fundamental ratios that we follow from our watch list dated October 12, 2018:

image

First and foremost is the contrast in performance from the low yield and the high yield stocks.  The low yield stocks gained +11.77% while the high yield stocks lost –23.35%, on average. This is counter to the claim that by investing in the high yielding stocks, investors will outperform the benchmark index. 

In the last year, the S&P 500 gained approximately +7.30% while the Dow Jones Industrial Average gained approximately +5.80%.

Below are the top five stocks by fundamental ratios for the U.S. Dividend Watch List dated October 11, 2019: Continue reading →

U.S Dividend Watch List: October 11, 2019

Previous Year Performance Review

In our ongoing review of the NLO Dividend Watch List, we have taken the top five stocks on our list from October 12, 2018 and have checked the performance one year later. The top five companies on that list can be seen in the table below.

Symbol Name 2018 Price 2019 Price % change
MATW Matthews International Corp. 42.68 34.59 -19.0%
FUL HB Fuller Company 45.50 47.27 3.9%
NC NACCO Industries 30.26 65.00 114.8%
PPG PPG Industries 95.09 119.17 25.3%
WHG Westwood Holdings Group Inc. 45.02 28.14 -37.5%
      Average 17.5%
         
DJI Dow Jones Industrial 25,339.99 26,816.59 5.8%
SPX S&P 500 2,767.13 2,970.27 7.3%

The top five companies performed exceptionally well due to an amazing performance from NACCO Industries (NC) which more than doubled its value. NACCO became a pure play in the coal sector after they spun-off Hamilton Beach and Hyster-Yale so we felt that it was a risky proposition. Needless to say, high risk in this instance lead to high reward. Matthews International (MATW) didn't perform as well and lost nearly 20% in a year. Our team was a believer in the value proposition and remain long in this company. However, the large debt obligation is a concern.

U.S. Dividend Watch List: October 11, 2019

This has been a volatile October and we're only half way through. Below are companies on our watch list. Continue reading →

U.S. Dividend Watch List: Top 5 by Ratios

Below is the breakdown of top 5 stocks from our September 27, 2019 list based on the fundamental ratios that we track. Continue reading →

U.S Dividend Watch List: September 27, 2019

The market is trying to find its footing and closed the week slightly lower than it began. From the chart, the index is approaching the 50-day moving average which may provide a short-term support. Anyone seeking to go long at this moment should utilize the list below as a starting point for your research. Continue reading →

Performance Review: September 21, 2018

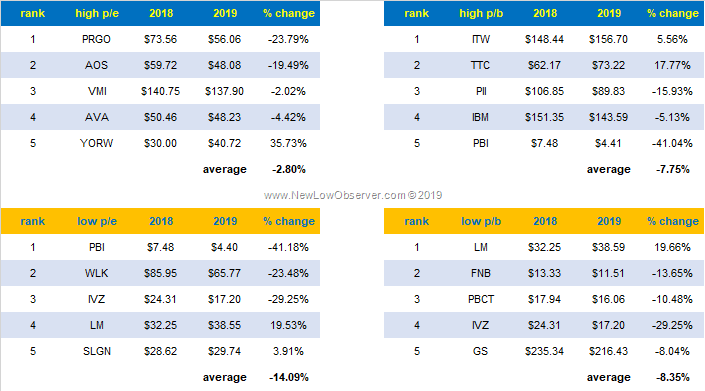
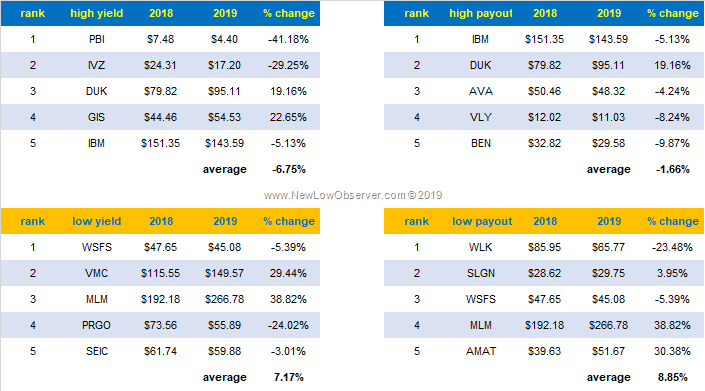
Below is the performance review of the top five stocks based on price-to-book, price-to-earnings and dividend yield ratios from our September 21, 2018 U.S. Dividend Watch List.

image

image

In the period from September 21, 2018 to September 20, 2019 (intraday), the Dow Jones Industrial Average increased +1%. The best performing group was the low payout ratio stocks with a gain of +8.85%. The worst performing group was the low p/e stocks was a loss of –14.09%.

Worth noting is the performance of the low yield stocks which gained +7.17% while the counterpart high yield stocks lost –6.76%.  This continues to bolster our position that low yield stocks will routinely outperform the high yield stocks.

Also of interest is the fact that high p/e stock beat low p/e stocks, high p/b stocks beat low p/b stocks and low payout stocks beat high payout stocks.

U.S. Dividend Watch List: Top 5 by Ratios

Below is the breakdown of top 5 stocks from our September 13, 2019 list based on the fundamental ratios that we track. Continue reading →

U.S Dividend Watch List: September 13, 2019

The market is attempting to test the all-time highs once again. This upward movement is dwindling the number of companies on our watch list. In fact, this is the lowest number of companies on our watch list this year. Continue reading →

U.S Dividend Watch List: August 30, 2019

Previous Year Performance Review

In our ongoing review of the NLO Dividend Watch List, we have taken the top five stocks on our list from August 31, 2018 and have checked the performance one year later. The top five companies on that list can be seen in the table below.

Symbol Name 2018 Price 2019 Price % change
LM Legg Mason 31.20 36.79 17.9%
IVZ Invesco Ltd. 24.10 15.70 -34.9%
AMAT Applied Materials 43.02 48.02 11.6%
BEN Franklin Resources 31.74 26.28 -17.2%
VMC Vulcan Materials 110.80 141.25 27.5%
      Average 1.0%
         
DJI Dow Jones Industrial 25,964.82 26,403.28 1.7%
SPX S&P 500 2,901.52 2,926.46 0.9%

The average gain for the top five companies was 1.0% which is comparable with S&P 500 gain of 0.9%. The best performer was Vulcan Materials (VMC) with 27.5% gain. The worse performer was Invesco (IVZ) with a loss of 34.9%.

U.S. Dividend Watch List: August 30, 2019

Our team is starting to get defensive and raised more cash. However, we will always utilize the watch list below as a starting point for investment opportunities. Continue reading →

U.S Dividend Watch List: August 16, 2019

Previous Year Performance Review

In our ongoing review of the NLO Dividend Watch List, we have taken the top five stocks on our list from August 17, 2018 and have checked the performance one year later. The top five companies on that list can be seen in the table below.

Symbol Name 2018 Price 2019 Price % change
LM Legg Mason 31.44 36.53 16.2%
IVZ Invesco Ltd. 24.48 15.64 -36.1%
VMC Vulcan Materials 110.34 141.80 28.5%
AMAT Applied Materials 43.77 46.63 6.5%
PBI Pitney Bowes Inc 8.08 3.46 -57.2%
      Average -8.4%
         
DJI Dow Jones Industrial 25,669.32 25,886.01 0.8%
SPX S&P 500 2,850.13 2,888.68 1.4%

The average loss for the top five companies was 8.4% compare to the market gain of 1.4%. The largest contributor of this loss was Pitney Bowes (PBI) whose market value fell 57%. Any company with dividend yield of 6% or more should be avoid and Pitney Bowes had a yield of nearly 10%. We thought Illinois Tool Works (ITW) is ripe for accumulation and shares gained 7.7%. At the time, we didn't think that Applied Materials (AMAT) was attractive but shares managed to gain 6.5%. However, shares of Applied Materials did fall 33% to $29 before rebounding to the current level.

U.S. Dividend Watch List: August 16, 2019

The market was on a roller coaster. After reaching an all-time high of 3,025, the fear of recession and tariff took the market down by about 5%. There is an important technical level to watch out for at 2,745 so keep an eye on it as we wait and see if the market can consolidate to move higher or lower. Continue reading →

U.S Dividend Watch List: August 2, 2019

Previous Year Performance Review

In our ongoing review of the NLO Dividend Watch List, we have taken the top five stocks on our list from August 3, 2018 and have checked the performance one year later. The top five companies on that list can be seen in the table below.

Symbol Name 2018 Price 2019 Price % change
FFIC Flushing Financial Corp. 24.87 19.67 -20.9%
IVZ Invesco Ltd. 25.15 17.84 -29.1%
FII Federated Investors Inc 22.91 33.99 48.4%
LM Legg Mason 32.24 37.98 17.8%
CBRL Cracker Barrel Old Country Store, Inc. 145.58 172.25 18.3%
      Average 6.9%
         
DJI Dow Jones Industrial 25,462.58 26,485.01 4.0%
SPX S&P 500 2,840.35 2,932.05 3.2%

Last year, there were numbers of financial companies trading near their yearly low. As such, we suggested our readers to explore Financial ETF, XLF, as an alternative to individual shares. Price for XLF were virtually flat year-over-year but price fell to $22.31 in late December of last year.

Illinois Tool Works (ITW) raised dividend payout by 28% last year which was a bullish sign. Share rose 9% in one year and we can expect more dividend increase to be in the short horizon.

U.S. Dividend Watch List: August 2, 2019

Market closed the week 3% lower than last week. There were several news one could attribute to this weakness. The first one was the rate cut from the Federal Reserve and the second was the plan to impose more tariffs on China. How should one position for this market? The fact that the market is near its all-time high, we can say that buying at this level poses some short-term risk. Buffett, as an example, was a net selling of stocks in the last quarter. Continue reading →

U.S. Dividend Watch List: July 26 2019

Below is the watch list for this week. Continue reading →

U.S Dividend Watch List: July 19, 2019

Previous Year Performance Review

In our ongoing review of the NLO Dividend Watch List, we have taken the top five stocks on our list from July 20, 2018 and have checked the performance one year later. The top five companies on that list can be seen in the table below.

Symbol Name 2018 Price 2019 Price % change
T AT&T Inc 31.10 32.79 5.4%
IVZ Invesco Ltd. 25.46 19.77 -22.3%
LM Legg Mason 33.36 38.09 14.2%
SLGN Silgan Holdings Inc. 26.62 30.15 13.3%
CAH Cardinal Health 48.80 44.99 -7.8%
      Average 0.5%
         
DJI Dow Jones Industrial 25,064.50 27,154.20 8.3%
SPX S&P 500 2,804.49 2,976.61 6.1%

The average gain for the top five company was subpar compared to the market. It was driven by large losses in Invesco (IVZ) and Cardinal Health (CAH). We thought that AT&T (T) offered an exceptional opportunity for income investors last year when it yielded 6%. The good and bad news is that the yield is still at 6% because the price hasn't changed much while the dividend payout has increased by 2%.

Our team shined a spotlight on Hershey Company (HSY) which was the second best performing stock on our watch list with a +58% gain in one year. At $91, the stock was below our 10-year target undervalued level.

U.S. Dividend Watch List: July 19, 2019

After crossing the 3,000 mark, the S&P 500 took a little breather this week and closed -1.3% lower. With the market virtually at an all-time high and the Transport 8% off its high, one has to be a little cautious establishing any position at this point. If you are to do so, we suggest our readers to start with the watch list below. Continue reading →

U.S Dividend Watch List: July 5, 2019

Previous Year Performance Review

In our ongoing review of the NLO Dividend Watch List, we have taken the top five stocks on our list from July 6, 2018 and have checked the performance one year later. The top five companies on that list can be seen in the table below.

Symbol Name 2018 Price 2019 Price % change
LM Legg Mason 34.32 37.96 10.6%
SWK Stanley Black & Decker 133.14 146.52 10.0%
IVZ Invesco Ltd. 26.44 20.97 -20.7%
CMI Cummins Inc. 131.40 169.15 28.7%
FULT Fulton Financial Corp. 16.65 16.57 -0.5%
      Average 5.6%
         
DJI Dow Jones Industrial 24,456.48 26,922.12 10.1%
SPX S&P 500 2,759.82 2,990.41 8.4%

The top five companies slightly underperformed the market. The best performer was Cummins (CMI) which is a major industrial company operating in the natural gas market. Cummins raised their dividend payment by 5%, from $1.08 to $1.14. The share price increase of +29% could be attributed to a strong gain in the net income. At the time of our writing last year, EPS were at $5.56 with projected EPS for 2018 to be at $14.07, current EPS (TTM) is at $15.41.

Our team said Legg Mason (LM) was setting up to be a good long-term accumulation and shares rose +10.60% in one year. However, share fell -32% hitting $23.51 before rebounding to $37.96. That's a 62% swing in share price to the upside. This type of action helps reaffirm our strategy of multi-stage purchases which could involve buying 1/3 or 1/2 of the position with the anticipation for further declines.

LM 07.05.2019

Another company we highlighted was 3M (MMM) which lost -13% of its value in one year. Shares were trading at a 2.50% dividend yield one year ago and the yield is currently at 3.30%. 3M raised their dividend 5.80%, from $1.36 to $1.44. Our 10-year target suggests that 3M is undervalued and should be considered for long-term accumulation.

U.S Dividend Watch List: July 5, 2019

The S&P 500 and the Dow Jones Industrial Average pushed through their all-time highs this week. This upward movement isn't confirmed by the Transportion index which is about 10% off the peak. Naturally a rise in the market leads to lower number of companies trading near their yearly low. Below is our watch list. Continue reading →

U.S. Dividend Watch List: June 16, 2019

Previous Year Performance Review

In our ongoing review of the NLO Dividend Watch List, we have taken the top five stocks on our list from June 15, 2018 and have checked the performance one year later. The top five companies on that list can be seen in the table below.

Symbol Name 2018 Price 2019 Price % change
FII Federated Investors Inc 23.60 32.41 37.3%
CINF Cincinnati Financial Corp. 68.99 103.54 50.1%
HRB H&R Block 23.66 28.69 21.3%
CB Chubb Corp. 130.88 150.26 14.8%
LM Legg Mason 35.97 36.68 2.0%
      Average 25.1%
         
DJI Dow Jones Industrial 25,090.48 26,089.61 4.0%
SPX S&P 500 2,779.66 2,886.98 3.9%

Average gain of the top five companies were extraordinary at 25%. Financial sector was the strongest with Cincinnati Financial (CINF) rising 50% in one year, followed by Federated Investors (FII). However, Legg Mason (LM) was virtually flat for the year.

U.S. Dividend Watch List: June 16, 2019

Below are companies on our watch list this week. Continue reading →