The Dow Jones Industrial average had an outstanding gain in the month of March. The blue chip index rose +7%. Continue reading
- Japan
- Market Indicator
- Price Momentum Indicators
- Richard Russell
- Silver
- Speed Resistance Lines
- U.S. Dividend Watch List

The Dow Jones Industrial average had an outstanding gain in the month of March. The blue chip index rose +7%. Continue reading
The Dow Jones Industrial average gained ground in February. However, that didn’t change the direction of the Coppock Curve which dipped to –23.4. Below is the current chart of the curve. Continue reading
We started the year off on with a big market selloff. The Dow Jones Industrial Average fell -5.4% in January. For the first time since June 2008, the Coppock Curve dipped into negative territory. This is a welcoming sign for our team and any long-term investors. Below is the current chart of the Coppock Curve. Continue reading
The market was flat for the month of November. However, it didn't stop the Coppock indicator to fall another -20% or 6.2 points. As always, we remind our readers that the Coppock Curve serves as a buy signal when they it turns upward after moving into negative territory. Continue reading
The market reversed a recent declining trend in October by increasing +8%. Despite the reversal of the trend, the Coppock indicator continued its downward path. The index fell 9.8 points and is only 32 points away from approaching negative territory. As always, we remind our readers that the Coppock Curve serves as a buy signal when they it turns upward after moving into negative territory. Continue reading
The market continued its down draft in September. Long-term investors should be very excited to see the market pull back. Our Coppock indicator is approaching a level we haven’t seen since 2008. As a reminder, the Coppock Curve serves as a buy signal when they it turns upward after moving into negative territory.
It didn't take long for the market to cave in after our July post on the Coppock Curve. The Dow Jones Industrial Average shed -6.5% in August alone. Immediately, we were curious what type of damage this decline did to the indicator and how close are we to that negative territory. As a reminder, the Coppock Curve serves as a buy signals only. Continue reading
It's been quite sometime since we've updated our readers on Coppock Curve. We've gotten more excited to see this indicator approach zero because it would point to a major opportunity to be long equities. While the indicator provides buy signals it doesn't offer any sell indication. As such, one can only take this as a buy only indicator.

About Coppock Curve
The Coppock Curve is one of the technical indicators that we focus on for long-term buy signals for the stock market. The Coppock Curve is only useful as a BUY indicator when the chart goes from positive territory to the negative territory then turns decidedly upward. As previously indicated, the Coppock Curve does not provide SELL signals in any way.
The Coppock Curve is one of the technical indicators that we focus on for long-term buy signals for the stock market. The Coppock Curve is only useful as a BUY indicator when the chart goes from positive territory to the negative territory then turns decidedly upward. As previously indicated, the Coppock Curve does not provide SELL signals in any way.
Once the signal turns upward (while in the negative territory), investors should consider buying stocks at the beginning of the month. Our last “buy” indication came at the end of April 2009. Anyone who purchased the Dow Jones Industrial ETF (DIA) on the first trading day of May 2009, they would have gained +109% in the process (based on the closing price of March 2015).
While the curve remain positive, the direction and the slope is negative. We would get excited if and when this indicator reach the negative zone. We will certainly update our readers when that time comes.

Posted in Coppock Curve, Coppock Index
The Coppock Curve is one of the technical indicators that we focus on for long-term buy signals for the stock market. The Coppock Curve is only useful as a BUY indicator when the chart goes from positive territory to the negative territory then turns decidedly upward. As previously indicated, the Coppock Curve does not provide SELL signals in any way.
Once the signal turns upward (while in the negative territory), investors should consider buying stocks at the beginning of the month. Our last “buy” indication came at the end of April 2009. Anyone who purchased the Dow Jones Industrial ETF (DIA) on the first trading day of May 2009, they would have gained +104% in the process (based on the closing price of May 2014).
The Coppock Curve is one of the technical indicators that we focus on for long-term buy signals for the stock market. The Coppock Curve is only useful as a BUY indicator when the chart goes from positive territory to the negative territory and then starts to turn decidedly upwards. As previously indicated, the Coppock Curve does not provide SELL signals in any way.
The Coppock Curve is one of the technical indicators that we focus on for long-term buying signals. The Coppock Curve is only useful as a BUY indicator when the chart goes from positive territory to the negative territory and then starts to turn decidedly upwards. As previously indicated, the Coppock Curve does not provide SELL signals in any way.
Once the signal starts to turn up, investors should consider buying stocks at the beginning of the month after the indicator turns upward. Our last "buy" indication came at the end of April 2009. Anyone who purchased the Dow Jones Industrial ETF (DIA) on the first trading day of May 2009, they would have gained +59% in the process.
After July 2012, the Coppock Curve remains far from the negative zone. This suggests that, overall, the market is not considered a "buy."

More about the Coppock Curve.
| Date | Index |
| Mar-09 | -374.4 |
| Apr-09 | -386.0 |
| May-09 | -380.5 |
| Jun-09 | -376.5 |
| Jul-09 | -357.8 |
| Aug-09 | -319.1 |
| Sep-09 | -265.3 |
| Oct-09 | -212.7 |
| Nov-09 | -147.3 |
| Dec-09 | -61.7 |
| Jan-10 | 25.1 |
| Feb-10 | 95.0 |
| Mar-10 | 168.0 |
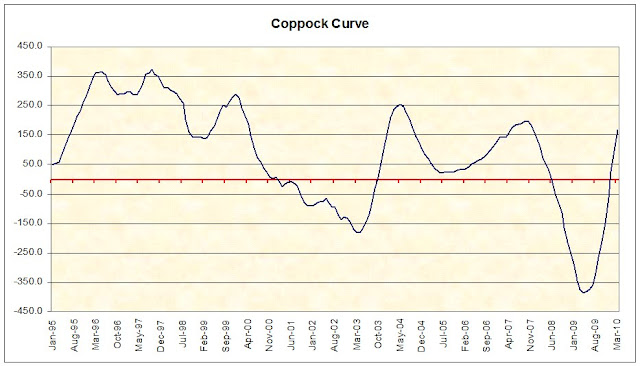
Click here for more explanation on the Coppock Curve and here for the calculation method. - Art
Quote of the day:
So far the Coppock curve is indicating that, although we may not be at the bottom in the stock market, we are still in a relatively risk free period to invest in stocks. The following is the movement of the index from the lowest point since April 2009:
With the Coppock Curve indicating that we're at a relatively risk free period for stocks along with the Industrial Production Index moving up and the Dow Theory bull market indication of July 23rd, it appears that we could be on our way to higher levels in the stock market and the economy over an extended period of time. Dow Theory still has a pending non-confirmation to be worked through but I will not report on that until we get a resolute signal. Touc.
related articles:
Comments Off on Coppock Curve Review
Posted in Coppock Curve, Coppock Index