Author Archives: NLObserver Team

Sell Aqua America (WTR) at the Market

Is it possible that your ship can come not once but twice?  We think so.  This is a situation where shareholders of AquaAmerica (WTR) get to understand exactly what Geraldine Weiss, author of Dividend's Don't Lie, means when she says that a stock trades in its own value range. 
In our research recommendation (found here) of WTR, it just so happened that we managed to pick the proverial bottom in the stock's price.  The stock has not fallen below the level indicated in the last year.  However, in our haste to obtain 10% profits, we sold our position in the stock on our sell recommendation of December 15, 2009.  On an annualized basis, we landed a 79.35% gain on our invested capital in 46 days.  Just a note about our view on investing, we want 10% returns in the shortest time possible with the fallback provision being the compounding of dividends if we happen to be wrong in our timing.
In the chart above, you can see our own buy and sell points along with the two most opportune times to exit WTR after our sell recommendation.  With WTR reaching a new high in the stock price and  exhibiting signs of topping out on a technical basis, it may be worth selling this stock.  If you had bought based on our research your total return so far (including dividends) would be 22.77% or an annualized gain of 33.44%. 
We know for a fact that better alternatives exist in the world of Dividend Achievers based on our Watch List and strongly recommend that you capture the sizable gains that have been made thus far.  An opportunity to cash out now is the equivalent of your ship coming in for the second time since May.

August Ex-Dividend Dates for Watch List Companies

Below are the approximate ex-dividend dates for August for companies that appeared on our Dividend Achiever Watch List from this week. If you happen to be researching these companies for potential investment, it would be advisable to consider the ex-dividend date prior to possible purchases. Owning the shares of the company that you're interested in before the ex-dividend date entitles you to the upcoming dividend payment. Owning the shares on or after the ex-dividend date means that you would have to wait at least three months before receipt of the next dividend payment.
Symbol Name Ex-Div Date
FII Federated Investors, Inc. 8/3/2010
PFE Pfizer, Inc. 8/3/2010
CWT California Water Service Group 8/4/2010
XOM Exxon Mobil 8/9/2010
WMT Wal-Mart Stores, Inc. 8/10/2010
WAG Walgreen Company 8/16/2010
DNB Dun & Bradstreet 8/24/2010
GS Goldman Sachs 8/25/2010
JNJ Johnson & Johnson 8/25/2010
SVU SuperValu Inc. 8/25/2010
CTWS Connecticut Water Service, Inc. 8/25/2010
UFPI Universal Forest Products, Inc. 8/25/2010
AROW Arrow Financial 8/30/2010

Please verify the ex-dividend date and payout ratio before committing funds to these stocks. Additionally, do not base your next long or short-term purchase on the dividend payment or yield. Instead, get as much research in as you possibly can before the ex-dividend date "just in case" you're actually interested in buying the stock.
Email our team here.

Dow Theory and Richard Russell

In attempting to understand Dow Theory it is necessary to follow the best and the brightest on this topic. Over the last 52 years, the brightest person on Dow Theory has been Richard Russell. No single person has been more outspoken on their views on the market using Dow Theory, uninterrupted since 1958, than Richard Russell. So when Richard Russell does an about face on his interpretation of Dow Theory it is worth our time to examine the reasons.
First, it is necessary to provide context around the ideas on Russell’s most recent market call.
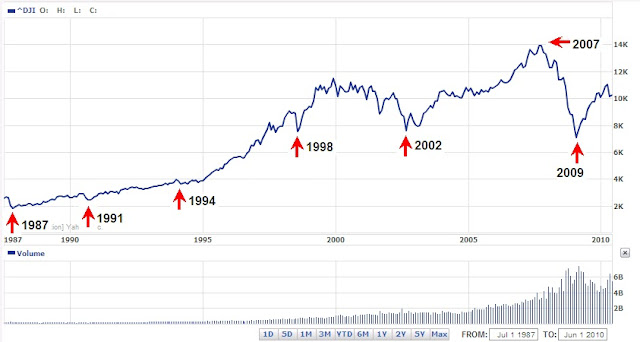
  • From November 12, 2007 to January 2, 2009, Russell indicated that we were in a bear market. The Dow went from 12,987.55 to 9,034.69, a decline of -30.44%.
  • From January 5, 2009 to January 12, 2009, Russell indicated that we were in a bull market. The Dow went from 8,952.89 to 6,926.49, a decline of –22.63%.
  • From March 11, 2009 to July 22, 2009, Russell indicated that we were in a bear market. The Dow went from 6,930.40 to 8,881.26, a gain of +28.15%.
  • From July 23, 2009 to May 19, 2010, Russell indicated that we were in a bull market. The Dow went from 9,069.29 to 10,444.37, a gain of +15.16%.
  • From May 20, 2010 to July 8, 2010, Russell indicated that we were in a bear market. The Dow went from 10,068.01 to 10,138.99, a slight gain was registered for the period (<1%).
On July 9, 2010, Richard Russell said:


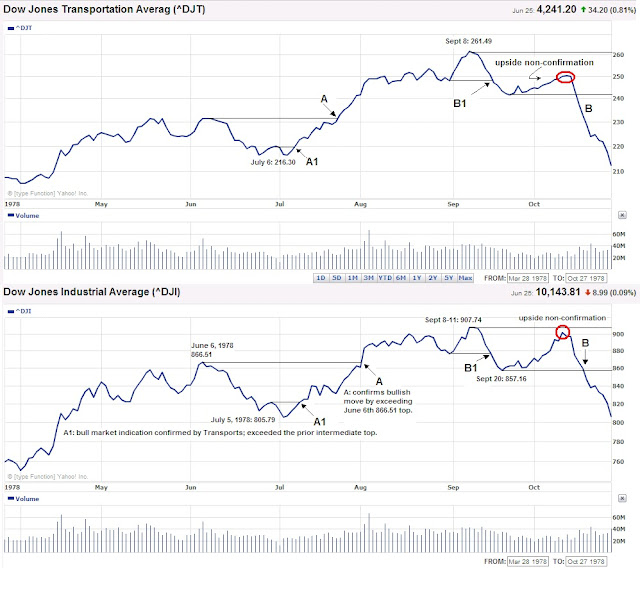
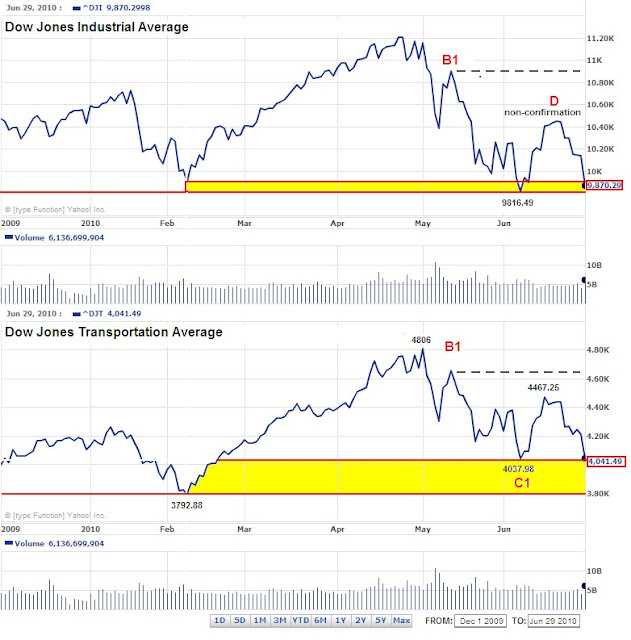
“When the facts change, I change. To do otherwise would be idiotic. Something occurred yesterday that made me sit up and take notice. We had the non-confirmation by the D-J Transportation Average, a situation that I discussed on the July 5 site.”
“Following the Transport non-confirmation, yesterday the market surged higher, Dow up 274 and Transports up 152. But that's not all. What I noticed was that yesterday was a 90% up day [up volume versus down volume] -- the formula for a bottom.”
According to Russell, the Transports non-confirmation along with a 90% up volume/down volume ratio is what led to the conclusion that the market was indicating that a bottom was in. Russell goes on to recommend buying various ETFs with stop losses. Several problems arise when market action is viewed from Russell’s perspective.
First, Russell has ignored the fact that a trend is in place until a counter trend is signaled. So far, we haven’t had a bear market indication since the March 9, 2009 low. If the Transports were to confirm the Industrials by falling below the February 5, 2010 low, then we’d have our first bear market signal.
Second, when thinking in terms of Dow Theory, market participants have three variables to consider the Dow Jones Transportation index, Dow Jones Industrials and NYSE volume. Volume attributes are considered over a period of time. Single day action on volume should not be the determining factor for considering a bull or bear market. If this is the case, then most market signals could be very misleading. In my observations, market volume has increasingly become an addendum to Dow Theory.
Third, Russell has often disregarded the pure Dow Theory indications that have come along the way since the March 2009 low. It seems that Russell’s understanding of macro issues and his personal experience in the markets has led to his decision to err on the side of caution. However, Russell’s cautious streak has usurped the value of Dow Theory to act as a “…composite index of all the hopes, disappointments, and knowledge of everyone who knows anything of financial matters, and for that reason the effects of coming events (excluding acts of God) are always properly discounted in their movement. The averages quickly appraise such calamities as fires and earthquakes.” (Rhea, Robert, The Dow Theory, page 19).
Next, Russell has set himself up for the need to change his analysis by not thinking through Dow Theory to its conclusion. By calling a bottom at this juncture, Russell has left out the all-important confirmation that is required by the Industrials and Transports. 10,450.64 and 4,467.25 are the new levels that the Industrials and Transports need to surpass before any buying policy should be considered. In addition, after surpassing the referenced upside confirmation points, the next level of resistance is 8% away for both indexes. This means that we could go to the old high and then quickly reverse to the downside if a bull market confirmation isn’t signaled. However, given the most recent market action, our focus should be on the confirmation of the reversal pattern first, then the possible bull market indication.
Another matter of concern is that Richard Russell makes recommendations that don’t address the issue of investing in values. Values are a core tenet of Dow Theory. In fact, when you read Dow Theory Unplugged or Charles H. Dow: Economist, you will find that values, not technicals, are espoused. Russell points his readers to speculative opportunities instead of undervalued stocks which can be held for “the long term” if the bullish assessment happens to be incorrect. Our list of Dividend Achiever stocks at or near a new low addresses the prospect that if we’re wrong there is some recourse. In this case, you get the ability to compound your investment over time with the prospect of capital appreciation.
Finally, our stance on stop loss orders is widely known as indicated in the article “Automatic Orders Don’t Provide Protection” as well as our disclaimer at the end of each sell recommendation. Russell's recommendation of buying ETFs is reckless at best especially in light of the May 6, 2010 “flash crash.” Adding fuel to the flames is the article titled “ETF ‘Circuit Breakers’ Needed to Stop Flash Crashes: Pros.” Our stance on ETFs is well founded and preceded any discussion of the true risks associated with them on May 6th (“ETF: Mediocrity With No Pretense of Value” and “ETF: Indiscriminant Risk”).
It is likely that perma-bulls will seize on the Russell commentary of July 9th as the heralding of a new-new era in investing. On the other hand, “contrarian investors” will suggest that when Richard Russell, perma-bear that he is, has entered the bull ring then the bull run is definitely over. It is our contention that while Richard Russell might be right about a reversal pattern being in place he is not using Dow Theory.
Our latest views on Dow Theory can be found at the following link (NLO on Dow Theory). Keep in mind that all trends are considered to remain in place until otherwise indicated. So far we are still in a cyclical bull market within a secular bear market.

Dividend Achiever Watch List

At the end of the week, our watch list contracted to 38 companies. Here is the watch list which ranks current and former Dividend Achievers that are within 10% of the 52-week low for July 9, 2010. Stocks that appear on our watch lists are not recommendations to buy.  Instead, they are the starting point for doing your research and determining the best company to buy.  Ideally, a stock that is purchased from this list is done after a considerable decline in the price and extensive due diligence.

Symbol Name Price % Yr Low P/E EPS (ttm) Div/Shr Yield Payout Ratio
FRS Frisch's Restaurants, Inc 19.95 2.26% 10.08 1.98 0.52 2.61% 26%
DNB Dun & Bradstreet Corp. 67.46 2.99% 13.52 4.99 1.40 2.08% 28%
WMT Wal-Mart Stores, Inc. 49.43 4.39% 12.97 3.81 1.21 2.45% 32%
FII Federated Investors Inc 21.24 4.84% 10.84 1.96 0.96 4.52% 49%
XOM Exxon Mobil Corp.   58.78 5.08% 13.39 4.39 1.76 2.99% 40%
PFE Pfizer Inc 14.77 5.50% 13.68 1.08 0.72 4.87% 67%
AROW Arrow Financial Corp.  24.14 5.60% 12.91 1.87 1.00 4.14% 53%
UMBF UMB Financial Corp.  36.62 5.93% 15.92 2.30 0.74 2.02% 32%
MATW Matthews International Corp.  29.69 6.04% 14.34 2.07 0.28 0.94% 14%
FFIN First Financial Bankshares, Inc.  49.32 6.04% 19.12 2.58 1.36 2.76% 53%
GS Goldman Sachs Group, Inc.   138.06 6.61% 5.75 24.01 1.40 1.01% 6%
THFF First Financial Corp. Indiana  26.82 6.77% 14.74 1.82 0.92 3.43% 51%
NTRS Northern Trust Corp.  48.53 6.78% 15.26 3.18 1.12 2.31% 35%
TR Tootsie Roll Industries Inc  24.15 6.86% 25.69 0.94 0.32 1.33% 34%
T AT&T Inc 24.83 7.07% 12.35 2.01 1.68 6.77% 84%
CWT California Water Service Group 36.35 7.51% 18.83 1.93 1.19 3.27% 62%
JNJ Johnson & Johnson   60.54 7.63% 12.72 4.76 2.16 3.57% 45%
SVU SUPERVALU INC 11.21 7.79% 6.06 1.85 0.35 3.12% 19%
WAG Walgreen Co. 28.40 8.15% 13.65 2.08 0.55 1.94% 26%
HSC Harsco Corp. 24.90 8.54% 18.58 1.34 0.82 3.29% 61%
HRB H&R Block, Inc. 14.60 8.63% 10.21 1.43 0.60 4.11% 42%
XRAY DENTSPLY International Inc.  30.22 8.74% 16.51 1.83 0.20 0.66% 11%
HCC HCC Insurance Holdings, Inc. 25.59 8.89% 8.53 3.00 0.54 2.11% 18%
STR Questar Corp. 16.22 9.15% 6.01 2.70 0.52 3.21% 19%
CTWS Connecticut Water Service, Inc.  21.88 9.40% 18.54 1.18 0.91 4.16% 77%
NJR New Jersey Resources Corp. 36.65 9.44% 16.58 2.21 1.36 3.71% 62%
BDX Becton, Dickinson and Co. 69.46 9.54% 13.33 5.21 1.48 2.13% 28%
UFPI Universal Forest Products, Inc.  32.04 9.54% 23.73 1.35 0.40 1.25% 30%
STFC State Auto Financial Corp.  16.24 9.58% 17.46 0.93 0.60 3.69% 65%
LOW Lowe's Companies Inc 20.43 9.72% 16.75 1.22 0.44 2.15% 36%
LLY Eli Lilly & Co. 35.17 9.84% 9.06 3.88 1.96 5.57% 51%
PAYX Paychex, Inc.  26.28 10.23% 19.91 1.32 1.24 4.72% 94%
ADM Archer Daniels Midland Co. 26.72 10.32% 11.00 2.43 0.60 2.25% 25%
BRC Brady Corp. 26.18 10.42% 17.34 1.51 0.70 2.67% 46%
KO Coca-Cola Co 52.40 10.50% 17.24 3.04 1.76 3.36% 58%
ABT Abbott Laboratories 48.03 10.54% 14.09 3.41 1.76 3.66% 52%
NWN Northwest Natural Gas Co. 45.25 10.83% 16.82 2.69 1.66 3.67% 62%
VIVO Meridian Bioscience Inc.  17.77 10.85% 22.49 0.79 0.76 4.28% 96%
38 Companies


*Goldman Sachs isn't a former or current dividend achiever but we feel that it is worth watching because it's a proxy of our financial system.

Watch List Summary

The best performing stock from the previous list was Monsanto (MON) which rose 6.1%.  The worst performing stock was SuperValu (SVU) which fell 6.6%.  Overall, the Dividend Achiever watch list gained 0.8% versus the Dow which was up 0.5%. Because our list has more than a handful of great companies, I urged investors to filter for companies with less than 50% payout ratio. This should minimized the risk of dividend reduction if earnings are to fall by half. If you understand the companies' history and their ability to pay the dividend, payout ratios in excess of 50% may be considered.
Investor flocked to safety as Aaa bond yield fell to 4.88% in June.  This is the lowest yield since February of 1966 (4.78%).  Yield at the December 2008 low, the peak of credit crunch, was at 5.05%.  This allow corporations, those with good balance sheets, to refinance or issue more debts at lower rate.
There are many great names on this list. One in particular is Becton Dickinson (BDX) which last traded at $69.46.  The reason why we like this name is because Warren Buffett added the name in late 2009. We highlighted the company in our watch list in 8/14/09 when BDX was trading at $66.39. After Buffett took position, shares rose to $80 and now have retraced back.  For those who missed the opportunity then have the opportunity now. As an added bonus, BDX is currently paying $0.37 of dividend quarterly compared to $0.33 in 2009. This is 12% above the previous payout. So while stock price have flat line, fundamental improved. While the stock price looks higher at $69, it is cheaper now at $69 because of the dividend yield (2.13% vs 2.00%).
Once again, I suggest readers to use the March 2009 low (or companies' most distressed time) as downside projection for investing.  Our conservative view is to embrace the worse case scenario prior to investing.  March 2009 low fits that description.  Although we use the one year (52 weeks) time frame, the past year was nothing but a major bull run and anyone who bought at or near the low could, and should, be taking profits.  It is important to place these companies in your own watch list so that when opportunity arises, you can purchase them with a greater margin of safety.

Email our team here.

Canadian Dividend Achievers

This list of Canadian Dividend Achievers, published by Mergent's, includes current and former Canadian Dividend Achievers and then ranking the companies based on those closest to the 52-week low. We've updated the stock symbol to connect to the Financial Post, one of Canada's top business publications. You'll find the most complete fundamental information on these companies at the FP website.  However, Yahoo!Finance probably has the better long-term charts and historical dividend data.  Enjoy.
Yahoo! Finanical Post Name Trade % from Low
RBA.TO RBA Ritchie Bros Auctioneers $19.62 2.88%
IMO.TO IMO Imperial Oil $38.86 2.94%
ESI.TO ESI Ensign Energy Services $12.61 3.62%
IGM.TO IGM IGM Financial $38.66 5.31%
CCO.TO CCO Cameco $23.59 9.01%
CTC-A.TO CTC.A Canadian Tire $54.27 9.64%
SU.TO SU Suncor Energy $32.88 9.93%
POW.TO POW Power Corp $26.35 11.04%
SNC.TO SNC SNC-Lavalin $44.00 11.36%
TLM.TO TLM Talisman Energy $16.58 12.03%
TIH.TO TIH Toromont $23.50 12.93%
PWF.TO PWF Power Financial $28.06 14.48%
TRI.TO TRI Thomson Reuters $38.54 18.66%
Email our team here.

Richard Russell Review: Letter 742

Dow Theory Letters issue 742 was published on November 1, 1978. At the time, the Dow Jones Industrial Average indicated was at the 806.05 level. In this issue, Richard Russell discusses several topics that are very important to every Dow Theorist.
First, Russell states that:
…history shows that when bull (or bear) markets really begin, Dow Theory signals are generally greeted with derision, skepticism, and scorn-rather than wholesale agreement!” page 1
This comment is in response to the Dow Theory bull market signal that was given on August 2, 1978. In this case, Russell felt there wasn’t enough skepticism by market participants to warrant a need to trust the signal. I’m guessing that after 12 years of a secular bear market any good news about the market would appeal to the glass half-full crowd.
Letter 742 also has a chart (located here) of the Dow Jones Industrials, Transports, Utility Averages and NYSE volume. Upon closer inspection of the chart below, ranging from March 28, 1978 to October 27, 1978, you can find two confirmations of a bull market and one confirmed bear market indication as part of Dow Theory.

According to Russell, point A (August 2nd), on the Dow Industrials, was a false secondary peak or bull market indication. However, it should be noted that when the Industrials went above the June 29th peak of 821.64 (point A1) on July 21st it was a clear indication that the index was going to retest the previous high at point A.

After the bull market move upward a bear market indication was given when the Industrials and Transports fell below point B1 that corresponded to the August 31st low of 876.82 and 248.78 respectively. A bull market non-confirmation was indicated (red circles) in the fact that neither index could exceed the high of September 8, 1978.
Let’s do the math for a moment, point A1 gave a buy signal plus point A’s confirmation of the buy signal equaled a 9.62% rise by the time the market gave the bull market non-confirmation at Dow Industrials 900. The same timing applied to the Dow Transports would have equaled a gain of 13.64%. To my mind, this was in line with our view that any return close to 10% in less than a year is an acceptable amount to trigger a sell of any stock.
Russell also repeats a common attribute that he seeks in the market before considering going “all in.” Russell says:

I noted that every bull market in history had started from an over-sold base, but that this market had not seen a over-sold condition since late-1976.” Page 1.

In this remark, I have two thoughts that immediately come to mind which is reflected in the chart below. The first is that even after the 1974 bottom there was another time (1976) that was “most ideal” to buy stocks at over-sold levels, according to Russell. However, even though late-1976 was experiencing oversold conditions, it certainly didn’t mean that further declines were out of the question. After the ’76 bottom, the Dow Industrials had a short rally and then fell as low as 742.12, a decline of 19.69% from the 1976 lows, by February 28, 1978. Finally, the view that an over-sold base is a condition necessary for a bull market may not be accurate.

On page 2 Russell said:

Right now, I want all my subscribers to stay out as per my instructions in Letter after Letter.”

This suggests that after the January 1975 buy signal given by Russell, it was very difficult to keep a long-term position even though it was the absolute best time to “buy and hold” stocks.

The violence and rapidity of this smash has few precedents in stock market history.” Page 2.

When calculated to the November 14, 1978 low, the decline from September 8, 1978 equaled a drop of 13.5%. To me this doesn’t seem like all the much of a decline.

Somewhere in the period ahead, we are going to see the real ‘third phase bear market action’ in the Dow and most other stocks. True, during 1973-1974 the majority of stocks were pulverized in a slide that was comparable to 1929-32 in many ways. But the Dow lost less than 50% of its value at that time. My guess is that before the third or final phase of this bear market is over, we are going to see the Dow at drastic new lows, we’re going to see dividends cut across the board, we’re going to see very high interest rates, and we’re going to see something that this generation has never seen before-wholesale liquidation of debt in all sections of the economy, private, corporate and perhaps even government.” Page 2

“Each time it looks as if the ‘plug is going to be pulled,’ the bear market (with the help of huge infusions of monetary inflation from the Fed) pulls itself out of the hole.” Page 2

Russell was waiting for the third phase of the bear market. According to Russell, the Fed was holding the market up with the trade-off being higher inflation. My thinking is that a crash didn’t occur simply because the Fed was willing to accept higher inflation as a substitute for a crash. In addition, if the markets were to get a crash and record inflation at the same time it would be exceptional situation. The third phase decline that Russell expected never seemed to materialize on the scale of 1973-74 or greater.
Other Notes in Letter 742:
  • E. George Schaefer’s investment performance from 1949 to 1966.
  • James Dines book the “Invisible Crash
  • MC Horsey’s chart of an inflation adjusted Dow since 1960
  • Benjamin and Herbert Stein’s book “On the Brink” with reference to, of all things, the Chinese cornering the gold market
More:

Richard Russell Review: Letter 745

Dow Theory Letters Issue 745 was written on December 6, 1978.  At the time, the Dow Jones Industrial Average was indicated to be at the 811.42 level.  What stood out the most to me was the fact that Richard Russell made very clear commentary on the price of gold and the direction of stocks.  Russell made the following commentary:

"It [gold/stock ratio] is telling us that for the foreseeable future (until the next signal), if we do anything we should do it in stocks." page 3.

Anyone familiar with the stock market in 1978 would know that if you had bought a handful of stocks and didn't sell them until 10 years later you would have had a compounded annual growth rate of 8.73% (this takes into consideration the crash of 1987).  Russell's comments on being in stocks would have seemed to be very much on target.  However, it is his aversion to gold at this time that seems to contradict his earlier comments on gold.
In Letter 742 dated November 1, 1978, Richard Russell said the following about gold:
"Slowly, very slowly, it's dawning on the world that we're witnessing one hell of a bull market-in gold. I've been writing pages and pages about gold in each Letter, trying to get new subscribers in the metal (or the coins), trying to get older subscribers to STAY in gold.  Happily, a large percentage of my subscribers are now sitting with large gold positions.  And the paper profits (in terms of dollars) are mounting." page 5.

This commentary seems odd because in Letter 745, Russell goes on to say:

"At any rate, it is a bearish omen when the [gold] open interest stays high in the face of a persistent decline, and that is what has occurred." page 6

Russell called himself to task by asking the following question:

"Question: Russell, you were so hot on gold a few months ago.  Gold was 'real money,' you said.  Gold 'would save the system,' you said.  How can you just "turn off" on gold?
"Answer: I haven't turned off on gold, I've turned off on gold at this time.  The market isn't like your wife or your daughter who you love through thick and thin.  We're dealing here with correct procedure and purchasing power.  The fact that I advocate gold-backed currency has nothing to do with the fact that I think gold is in a bear trend over the coming months.  In this business, you had better learn that the trend makes you the money, not the item.  I'd rather buy Cesspools, Inc. if that stock was going up than IBM if IBM is heading down." Page 7
In retrospect, we know that gold went as high as $850 an ounce in January 1980.  However, it is interesting to me that Russell said that a bear trend was approaching "...over the coming months."  In Letter 745, Russell included a chart that compared the London Gold to the Gold Stock Average.


Russell's favorable comments of gold on November 1, 1978 were well off of the highs from the prior month.  However, since Russell was a practioner of Dow Theory and was using the London price of gold along with the equivalent of the XAU gold index to act as a confirming mechanism for the future price of gold, it should have been considered that because the London price didn't fall to the corresponding low set in April of 1978 that there must have been a non-confirmation of the downside trend.  Instead, Russell said the following:
"The GSA [Gold Stock Average] has collapsed, and is now down to its previous low for the year recorded last April.  Bullion has obviously held up better than the gold shares, but so far the downside non-confirmations by bullion have failed to halt the decline.  This kind of action is always indicative of a weak market, and it just seems that there are still too many optimistic gold-holders around." Page 6.
Is it possible that the gold shares are held by the public and speculators (weak hands) and the bullion is held by investors and "institutions" (strong hands)?    Somehow I think this relationship has some value.  I'm just not sure if Russell called this intermediate move correctly.  So I decided to search for an updated version of the London Gold and GSA comparison.  Below is what I found in the July 5, 1979 issue:


It should be noted that the exact bottom in the price of gold and gold stocks (red circles) coincided with the publishing of the December 6, 1978 Letter 745.
Also Worth Mentioning:
  • Russell said that "Greed and options don't mix."  My impression on this remark is that I always thought that the purpose of options is to get exaggerated gains with the trade-off being no equity.  Seems to me that greed and options go hand in hand.
  • Dow Theory Letters are available at http://www.dowtheoryletters.com/
More:

Nasdaq 100 Watch List

Below are the top 20 Nasdaq 100 companies that are within 7% of the 52-week low. This list is strictly for the purpose of researching whether or not the companies have viable business models. These companies are deemed highly speculative unless otherwise noted.

Symbol Name Trade P/E EPS Yield P/B % from Low
APOL Apollo Group, Inc. 41.86 10.47 4 0.00% 4.9 0.99%
RIMM Research In Motion Limited 48.14 N/A 0 0.00% N/A 1.35%
DELL Dell Inc. 12.03 15.95 0.75 0.00% 4 1.60%
YHOO Yahoo! Inc. 14.07 25.26 0.56 0.00% 1.53 2.33%
QCOM QUALCOMM Incorporated 32.37 17.26 1.88 2.20% 2.53 2.34%
SPLS Staples, Inc. 19.19 17.75 1.08 1.80% 2.07 2.51%
AMGN Amgen Inc. 51.7 10.97 4.71 0.00% 2.25 2.74%
ADBE Adobe Systems Incorporated 26.73 37.54 0.71 0.00% 2.71 2.77%
SYMC Symantec Corporation 13.98 16.03 0.87 0.00% 2.43 2.95%
VRTX Vertex Pharmaceuticals 32.22 0 -3.5 0.00% 6.59 3.10%
ERTS Electronic Arts Inc. 14.6 0 -2.08 0.00% 1.73 3.84%
STLD Steel Dynamics, Inc. 13.03 18.97 0.69 2.20% 1.39 4.83%
FISV Fiserv, Inc. 45.47 14.25 3.19 0.00% 2.24 5.40%
NVDA NVIDIA Corporation 10.25 21.27 0.48 0.00% 2.08 5.56%
XRAY DENTSPLY Intl 29.39 16.07 1.83 0.60% 2.38 5.76%
MSFT Microsoft Corporation 23.27 12.06 1.93 2.10% 4.44 5.77%
GILD Gilead Sciences, Inc. 34.87 11.18 3.12 0.00% 4.19 6.18%
LOGI Logitech Intl 13.91 38.43 0.36 0.00% 2.34 6.26%
CEPH Cephalon, Inc. 55.95 11.16 5.01 0.00% 1.76 6.47%
PAYX Paychex, Inc. 25.47 19.31 1.32 4.70% 6.7 6.84%

Email our team here.

Dow Theory

The markets are getting very close to giving us the Dow Theory indication that we need to exit a majority of our positions. Today (June 29, 2010), the Dow Jones Industrial Average closed at 9870.29 which is 53.80 points above the June 7, 2010 of 9816.49. Falling below 9816.49 would be one half of the bear market signal needed to indicate that the market will fall precipitously.

To make matters worse, the Dow Jones Transportation Index closed down today nearly twice as much as the Industrial Index. This indicates that there is significant selling interest. This doesn’t bode well for the Transports because in order to trigger the second half of the bear market signal the index would only have to fall 248.61 points. After today’s decline of 169.52 points in a single day, the remaining 79.09 points needed would not be all that difficult to come by.
The chart below displays a critical reason why I would be bearish on the market at this time. The dashed black line extending from B1 was supposed to be the upside target from point C1 in our last Dow Theory article. However, neither the Industrials nor the Transports were able to come close enough to be misinterpreted as an indication that the bull market run was likely to continue. The inability of the market to breach point B1 was a major non-confirmation according to Dow Theory.
Finally, any simultaneous declines of the Industrials and Transports below the yellow zones on a closing basis would tell us for certain that the bull market has run its course and that an additional correction of 15% on the Dow Jones Industrial Average is likely.

We’re being generous by not considering the June 7th lows for both indexes as the critical points for a bear market indication. For some Dow Theorists, waiting for the Transports low on February 5th is akin to playing with fire. However, we must adhere to the extremes to ensure quality buy and sell signals.

The only holdout is that either the Transportation Index or the Industrial Index gives us a downside non-confirmation by not going below the Feb. 5th or the June 7th lows, respectively. If we get a downside non-confirmation then we will consider selling a small portion of the portfolio on any strength.

Dividend Achiever Watch List

We've decided to make a slight modification to our criteria for the Dividend Achiever watch list.  Over the past several weeks, the number of companies on our watch list has been exploding.  As we explore the alternative field of investment, we thought that if there are adequate companies in the 10% range then we could use that as our criteria.  Therefore, this week's list (and going forward) will contain Dividend Achievers that are within 10% of the 52-week low.  If this list shirks to a certain size, we'll broaden our range to 20% as usual.

At the end of the week, our watch list contracted to 41 companies. Here is the watch list which ranks current and former Dividend Achievers that are within 10% of the 52-week low for June 25, 2010. Stocks that appear on our watch lists are not recommendations to buy.  Instead, they are the starting point for doing your research and determining the best company to buy.  Ideally, a stock that is purchased from this list is done after a considerable decline in the price and extensive due diligence.

Symbol Name Price % Yr Low P/E EPS (ttm) Div/Shr Yield Payout Ratio
WAG Walgreen Co. 26.93 0.00% 12.64 2.13 0.55 2.04% 26%
MON Monsanto Co. 48.27 0.23% 20.11 2.40 1.06 2.20% 44%
SVU SUPERVALU INC 12.00 0.59% 6.49 1.85 0.35 2.92% 19%
XOM Exxon Mobil Corp.   59.10 1.09% 13.46 4.39 1.76 2.98% 40%
HSC Harsco Corp. 25.05 1.58% 18.69 1.34 0.82 3.27% 61%
UMBF UMB Financial Corp.  36.73 1.72% 15.97 2.30 0.74 2.01% 32%
DNB Dun & Bradstreet Corp. 70.48 2.00% 14.12 4.99 1.40 1.99% 28%
FII Federated Investors Inc 21.32 2.40% 10.88 1.96 0.96 4.50% 49%
WMT Wal-Mart Stores, Inc. 48.80 3.06% 12.81 3.81 1.21 2.48% 32%
FFIN First Financial Bankshares, Inc.  49.55 3.53% 19.21 2.58 1.36 2.74% 53%
NTRS Northern Trust Corp.  48.44 3.68% 15.23 3.18 1.12 2.31% 35%
PFE Pfizer Inc 14.64 3.76% 13.56 1.08 0.72 4.92% 67%
FRS Frisch's Restaurants, Inc 20.70 3.97% 10.45 1.98 0.52 2.51% 26%
HRB H&R Block, Inc. 15.55 4.50% 10.58 1.47 0.60 3.86% 41%
CRRC Courier Corp.  12.74 5.29% 13.13 0.97 0.84 6.59% 87%
MATW Matthews International Corp.  29.53 5.46% 14.27 2.07 0.28 0.95% 14%
UFPI Universal Forest Products, Inc.  31.90 5.49% 23.63 1.35 0.40 1.25% 30%
NJR New Jersey Resources Corp. 35.45 5.85% 16.04 2.21 1.36 3.84% 62%
VIVO Meridian Bioscience Inc.  16.98 5.93% 21.49 0.79 0.76 4.48% 96%
LLY Eli Lilly & Co. 33.94 6.00% 8.75 3.88 1.96 5.77% 51%
GS* Goldman Sachs Group, Inc.   139.66 6.37% 5.82 24.01 1.40 1.00% 6%
JNJ Johnson & Johnson   58.70 6.49% 12.33 4.76 2.16 3.68% 45%
KO Coca-Cola Co 50.26 6.53% 16.53 3.04 1.76 3.50% 58%
CTWS Connecticut Water Service, Inc.  21.37 6.85% 18.11 1.18 0.91 4.26% 77%
T AT&T Inc 24.79 6.90% 12.33 2.01 1.68 6.78% 84%
AROW Arrow Financial Corp.  25.28 6.93% 13.52 1.87 1.00 3.96% 53%
CWT California Water Service Group 36.34 7.48% 18.83 1.93 1.19 3.27% 62%
THFF First Financial Corp. Indiana  27.23 7.50% 14.96 1.82 0.92 3.38% 51%
NWN Northwest Natural Gas Co. 44.22 8.30% 16.44 2.69 1.66 3.75% 62%
ABT Abbott Laboratories 47.19 8.61% 13.84 3.41 1.76 3.73% 52%
ADM Archer Daniels Midland Co. 26.34 8.75% 10.84 2.43 0.60 2.28% 25%
BDX Becton, Dickinson and Co. 69.05 8.89% 13.25 5.21 1.48 2.14% 28%
MDU MDU Resources Group Inc. 18.67 9.12% 13.34 1.40 0.63 3.37% 45%
PGN Progress Energy, Inc. 39.28 9.20% 14.44 2.72 2.48 6.31% 91%
HCC HCC Insurance Holdings, Inc. 25.36 9.22% 8.45 3.00 0.54 2.13% 18%
SFNC Simmons First National Corp.  26.78 9.31% 16.33 1.64 0.76 2.84% 46%
VVC Vectren Corp. 23.78 9.79% 15.64 1.52 1.36 5.72% 89%
AWR American States Water Co. 34.27 9.84% 19.15 1.79 1.04 3.03% 58%
AVP Avon Products, Inc. 27.49 9.96% 21.65 1.27 0.88 3.20% 69%
TMP Tompkins Financial Corp. 38.18 10.20% 12.64 3.02 1.36 3.56% 45%
OMI Owens & Minor, Inc. 28.19 10.46% 14.99 1.88 0.71 2.52% 38%
41 Companies


*Goldman Sachs isn't a former or current dividend achiever but we feel that it is worth watching because it's a proxy of our financial system.

Watch List Summary
The best performing stock from last week's list was Shenandoah Telecom (SHEN) which rose 7.9%.  The worst performing stock was Walgreen (WAG) which fell 10.5%.  Overall, the Dividend Achiever watch list lost 2.4% versus the Dow which was down 2.95%. Because our list has more than a handful of great companies, I urged investors to filter for companies with less than 50% payout ratio. This should minimized the risk of dividend reduction if earnings are to fall by half. If you understand the companies' history and their ability to pay the dividend, payout ratios in excess of 52% may be considered.

With Aaa bond ratings falling to 4.96%, I expected more companies to pass the first criteria of Graham's stock selection. But nothing has changed materially. Supervalue (SVU), Eli Lilly (LLY), Goldman Sachs (GS), and HCC Insurance Holdings (HCC) are the companies with an earnings yield that exceeds twice the Aaa bond rate and payout ratio less than 50%.

Another company we'd like to highlight is Walgreen (WAG).  The recent sell-off brought the yield up to 2.04%.  Although that doesn't appear to be like much, WAG highest yield was 2.36% (in 1989).  Using current dividend figure and the highest yielding period for WAG, shares would be at $23.30 or 13.5% down from current price. Since the company started paying dividend in 1985, they have increase their payout every year at an annual rate of  12.7%.

Once again, I suggest readers to use the March 2009 low (or companies' most distressed time) as downside projection for investing.  Our conservative view is to embrace the worse case scenario prior to investing.  March 2009 low fits that description.  Although we use the one year (52 weeks) time frame, the past year was nothing but a major bull run and anyone who bought at or near the low could, and should, be taking profits.  It is important to place these companies in your own watch list so that when opportunity arises, you can purchase them with a greater margin of safety.

Related Article:
Benjamin Graham's Stock Selection Criteria

Email our team here.

Q and A on Elliott Wave Cycles


Question:

A reader asks, "[Robert] Prechter's recent prediction based on his interpretation of the EWT [Elliott Wave Theory] cycles calls for a market top in 2012 and then a slide of humongous proportions to bottom in 2016. I am of course very familiar with his EWT, but just wanted to bring this to your attention.

"How do you view this in light of your cycle work?  Prechter is mentioning two cycles -- 7.25 yr and 20 yr -- both topping in 2012 as per the last paragraph in the article titled 'Elliott Wave predicts triple-digit Dow in 2016.'”

Answer:

Our most recent article of June 13, 2010 on the 4 ½ year cycle perfectly lines up with the EWT assertion of a peak in the market around 2012.  Remember, our 2011 estimate for a peak was conservative since it ignores that most 4 to 4 ½ year peaks occur in the 3rd year while we only assumed the 2nd year as the most likely (preemptive) top.  Interestingly, the 2016 cycle bottom fits snugly within Charles H. Dow’s claim of a 3 to 4 year cycle with a concentration on half-cycle tops.

Our view on the specific downside targets based on the Wave principle was addressed in the article dated October 16, 2009.  In that article we said,

The second type of market low is based on the premise that the Dow fulfills the Wave principle and falls below the upward trending line (red) to the old support level 8100 and then 6440. A true Wave move down to the old low would bring the market below 6440. However, the last time this was fulfilled, in the period from 1970 to 1974, the market only fell 8.5% below the previous low of 631.16 on the Dow Industrials in 1970. Additionally, the Industrials ran up from 631.16 in 1970 to 1051.70 in 1973, an increase of 118% of the previous peak. As more time passes I expect the index to fall to 5474 [8.5% of the March 9, 2009] if we do manage to complete a Wave formation on the downside.”


Our view is that we start from the premise of prior fulfillment of the Wave Principle (using Dow’s requirement of precedent to prove; until proven otherwise) at or near major market bottoms and then work our way down from there.  The Wave principle, as strictly defined by R.N. Elliott, indicates that the market only needs to fall slightly below the prior all time low to be complete.  The major super cycle low that was predicted for 1974 didn’t go to 100 or 200 as expected at the time.  Instead it fell only 8.5% below the 1970 low.

We believe that the 5474 is the most realistic starting point to work from.  Any declines below 5474 level need to be assessed based on the conditions of the market at that specific time.   

We cannot emphasize enough the fact that the calls of 90% declines, or Grand Supercycle bottoms, are based falsely, in our opinion, on the Dow declines of 1929 to 1932 which was largely a result of dramatic changes to the index during that period rather that a relatively static constituency of the index from the 1929 top to the 1932 bottom (Article 1 and Article 2 addressing the issue of index changes and post Depression performance, respectively). 

Again, we would rather assess the situation once we meet the minimum requirement of “fulfilling” the Wave principle which may concurrently meet the requirement needed to acquire stocks at “traditionally” undervalued levels.

Email our team here.

Dividend Achiever Watch List

At the end of the week, our watch list contracted to 69 companies. Here is the watch list which ranks current and former Dividend Achievers that are within 20% of the 52-week low for June 18, 2010. Stocks that appear on our watch lists are not recommendations to buy.  Instead, they are the starting point for doing your research and determining the best company to buy.  Ideally, a stock that is purchased from this list is done after a considerable decline in the price and extensive due diligence.
Symbol Name Price % Yr Low P/E EPS (ttm) Div/Shr Yield Payout Ratio
UMBF UMB Financial Corp.  37.38 2.98% 16.25 2.30 0.74 1.98% 32%
UFPI Universal Forest Products, Inc.  31.34 3.64% 23.21 1.35 0.40 1.28% 30%
FRS Frisch's Restaurants, Inc 20.73 4.12% 10.47 1.98 0.52 2.51% 26%
FFIN First Financial Bankshares, Inc.  50.07 4.62% 19.41 2.58 1.36 2.72% 53%
MON Monsanto Co. 50.39 4.63% 21.00 2.40 1.06 2.10% 44%
GS* Goldman Sachs Group, Inc.   138.18 5.24% 5.76 24.01 1.40 1.01% 6%
HSC Harsco Corp. 25.99 5.39% 19.40 1.34 0.82 3.16% 61%
DNB Dun & Bradstreet Corp. 73.23 5.98% 14.68 4.99 1.40 1.91% 28%
HRB H&R Block, Inc. 15.80 6.18% 10.75 1.47 0.60 3.80% 41%
FII Federated Investors Inc 22.15 6.39% 11.30 1.96 0.96 4.33% 49%
SHEN Shenandoah Telecom 16.68 7.20% 15.16 1.10 0.32 1.92% 29%
AROW Arrow Financial Corp.  25.44 7.61% 13.60 1.87 1.00 3.93% 53%
NTRS Northern Trust Corp.  50.30 7.66% 15.82 3.18 1.12 2.23% 35%
THFF First Financial Corp. Indiana  27.27 7.66% 14.98 1.82 0.92 3.37% 51%
JNJ Johnson & Johnson   59.18 7.78% 12.43 4.76 2.16 3.65% 45%
SVU SUPERVALU INC 12.86 7.80% 6.95 1.85 0.35 2.72% 19%
PFE Pfizer Inc 15.21 7.80% 14.08 1.08 0.72 4.73% 67%
WAG Walgreen Co. 30.09 7.89% 14.13 2.13 0.55 1.83% 26%
XOM Exxon Mobil Corp.   63.10 7.94% 14.37 4.39 1.76 2.79% 40%
LLY Eli Lilly & Co. 34.61 8.09% 8.92 3.88 1.96 5.66% 51%
CTWS Connecticut Water Service, Inc.  21.63 8.15% 18.33 1.18 0.91 4.21% 77%
CWT California Water Service Group 36.66 8.43% 18.99 1.93 1.19 3.25% 62%
WMT Wal-Mart Stores, Inc. 51.55 8.87% 13.53 3.81 1.21 2.35% 32%
NJR New Jersey Resources Corp. 36.52 9.05% 16.52 2.21 1.36 3.72% 62%
AWR American States Water Co. 34.12 9.36% 19.06 1.79 1.04 3.05% 58%
T AT&T Inc 25.43 9.66% 12.65 2.01 1.68 6.61% 84%
HCC HCC Insurance Holdings, Inc. 25.54 9.99% 8.51 3.00 0.54 2.11% 18%
KO Coca-Cola Co 52.31 10.87% 17.21 3.04 1.76 3.36% 58%
VVC Vectren Corp. 24.11 11.31% 15.86 1.52 1.36 5.64% 89%
SFNC Simmons First National Corp.  27.32 11.51% 16.66 1.64 0.76 2.78% 46%
TMP Tompkins Financial Corp. 38.69 11.67% 12.81 3.02 1.36 3.52% 45%
MDU MDU Resources Group Inc. 19.13 11.81% 13.66 1.40 0.63 3.29% 45%
PGN Progress Energy, Inc. 40.34 12.15% 14.83 2.72 2.48 6.15% 91%
ABT Abbott Laboratories 48.77 12.24% 14.30 3.41 1.76 3.61% 52%
ADM Archer Daniels Midland Co. 27.19 12.26% 11.19 2.43 0.60 2.21% 25%
BEC Beckman Coulter, Inc. 60.25 12.28% 25.21 2.39 0.72 1.20% 30%
VIVO Meridian Bioscience Inc.  18.00 12.29% 22.78 0.79 0.76 4.22% 96%
BDX Becton, Dickinson and Co. 71.32 12.47% 13.69 5.21 1.48 2.08% 28%
MATW Matthews International Corp.  31.56 12.71% 15.25 2.07 0.28 0.89% 14%
OMI Owens & Minor, Inc. 28.77 12.74% 15.30 1.88 0.71 2.47% 38%
NWN Northwest Natural Gas Co. 46.12 12.96% 17.14 2.69 1.66 3.60% 62%
CRRC Courier Corp.  13.77 13.80% 14.20 0.97 0.84 6.10% 87%
PBI Pitney Bowes Inc   23.23 13.98% 12.10 1.92 1.46 6.28% 76%
XRAY DENTSPLY International Inc.  31.72 14.14% 17.33 1.83 0.20 0.63% 11%
UGI UGI Corp. 26.50 14.32% 12.10 2.19 1.00 3.77% 46%
BCR CR Bard, Inc. 80.30 14.55% 16.98 4.73 0.72 0.90% 15%
AVP Avon Products, Inc. 28.74 14.96% 22.63 1.27 0.88 3.06% 69%
MGEE MGE Energy Inc.  36.94 15.22% 16.94 2.18 1.47 3.98% 67%
TR Tootsie Roll Industries Inc  25.28 15.28% 26.89 0.94 0.32 1.27% 34%
WTR Aqua America Inc 17.77 15.46% 22.49 0.79 0.58 3.26% 73%
WEYS Weyco Group, Inc.  24.07 15.61% 19.57 1.23 0.64 2.66% 52%
SBSI Southside Bancshares, Inc.  20.11 15.64% 7.56 2.66 0.68 3.38% 26%
FPL FPL Group, Inc. 52.51 15.94% 11.88 4.42 2.00 3.81% 45%
WGL WGL Holdings, Inc. 35.24 16.04% 15.19 2.32 1.51 4.28% 65%
CL Colgate-Palmolive Co. 80.59 16.07% 19.70 4.09 2.12 2.63% 52%
SIAL Sigma-Aldrich Corp.  53.21 16.18% 18.16 2.93 0.64 1.20% 22%
RNST Renasant Corp.  14.24 16.24% 18.74 0.76 0.68 4.78% 89%
STFC State Auto Financial Corp.  17.67 16.94% 19.00 0.93 0.60 3.40% 65%
ATO Atmos Energy Corp. 28.67 17.45% 13.78 2.08 1.34 4.67% 64%
CTBI Community Trust BanCorp., Inc.  26.06 17.65% 15.60 1.67 1.20 4.60% 72%
APD Air Products & Chemicals, Inc. 71.54 18.21% 17.93 3.99 1.96 2.74% 49%
CLX Clorox Co. 65.07 18.50% 15.31 4.25 2.20 3.38% 52%
PAYX Paychex, Inc.  28.33 18.83% 21.46 1.32 1.24 4.38% 94%
SJW SJW Corp. 24.59 19.20% 28.59 0.86 0.68 2.77% 79%
TRH Transatlantic Holdings, Inc. 49.46 19.24% 7.90 6.26 0.84 1.70% 13%
WST West Pharmaceutical Services, Inc. 37.81 19.46% 16.96 2.23 0.64 1.69% 29%
MDT Medtronic, Inc. 38.87 20.04% 13.93 2.79 0.82 2.11% 29%
PNY Piedmont Natural Gas Co., Inc. 27.03 20.13% 12.75 2.12 1.12 4.14% 53%
PX Praxair, Inc. 81.17 20.81% 19.85 4.09 1.80 2.22% 44%
69 Companies


*Goldman Sachs isn't a former or current dividend achiever but we feel that it is worth watching because it's a proxy of our financial system.

Watch List Summary

The best performing stock from last week's list was Archer Daniels (ADM) which rose 6%.  The worst performing stock was Universal Forest Products (UFPI) which fell 7.7%.  Overall, the Dividend Achiever watch list gained 2.1% versus the Dow which was up 2.3%. Because our list has more than a handful of great companies, I urged investors to filter through company with maximum of 50% payout ratio. This should minimized the risk of dividend reduction. If you understand the companies history and their ability to pay dividend, payout ratio in excess of 50% may be considered.

Take a closer look at our top 10 companies on the list. These companies combined for an average payout ratio of 37% and 8% earning yield.

Readers should use the March 2009 low (or companies' most distress time) as a base case for investing.  Our conservative view is to embrace the worse case scenario prior to investing.  March 2009 low fits that description.  Although we use the one year (52 weeks) time frame, the past year was nothing but major bull run and anyone who bought at or near the low can be taking profit.  It's important to place these companies in your own watch list so that when opportunities arise, you can purchase them with greater margin of safety.

Email our team here.

Remaining Ex-Dividend Dates for the Month of June

Below are the approximate ex-dividend dates for companies that appear on our Dividend Achiever and Nasdaq 100 Watch Lists for the rest of June. If you happen to be researching these companies for potential investment, it would be advisable to consider the ex-dividend date prior to possible purchases. Owning the shares of the company that you're interested in before the ex-dividend date entitles you to the upcoming dividend payment. Owning the shares on or after the ex-dividend date means that you would have to wait at least three months before receipt of the next dividend payment.
Please verify the ex-dividend date and payout ratio before committing funds to these stocks. Additionally, do not base your next long or short-term purchase on the dividend payment or yield. Instead, get as much research in as you possibly can before the ex-dividend date "just in case" you're actually interested in buying the stock.
Symbol Name Trade % from Low Yield Ex-Div
SRE Sempra Energy Common Stock $48.22 9.82% 3.20% 6/16/2010
EGP EastGroup Properties, Inc. $37.80 19.77% 5.60% 6/16/2010
FRS Frisch's Restaurants, Inc. $20.39 2.41% 2.50% 6/17/2010
OSBC Old Second Bancorp, Inc. $3.72 10.71% 1.10% 6/22/2010
PNY Piedmont Natural Gas $25.86 14.93% 4.30% 6/22/2010
XRAY DENTSPLY International $31.27 12.52% 0.60% 6/23/2010
SUP Superior Industries $14.45 12.98% 4.40% 6/23/2010
SPLS Staples, Inc. $21.72 16.03% 1.70% 6/23/2010
STLD Steel Dynamics, Inc. $14.38 15.69% 2.10% 6/27/2010
STT State Street Corp $37.03 3.09% 0.10% 6/28/2010
NUE Nucor Corporation $42.43 10.87% 3.40% 6/28/2010
HCC HCC Insurance Holdings $24.85 7.02% 2.20% 6/29/2010
APD Air Products and Chemicals $69.02 14.04% 2.90% 6/29/2010
Email our team here.

The 4 to 4 1/2 Year Market Cycle

When introducing the topic of market cycles it is often looked upon as something that is more wishful thinking more than anything else. However, it is my hope that I can provided sufficient evidence to convince you that objective observation of the 4 to 4 ½ year market cycle is well worth your time.
Introduction of the topic of the 4 to 4 ½ year market cycle does not come lightly. On September 13, 1900, Charles H. Dow, founder and editor of the Wall Street Journal, referenced the 4-year cycle as noted below:
We have frequently demonstrated that the stock market, while full of short fluctuations, has a continuing main movement, which often runs in one direction for three or four years at a time.”
Again on February 21, 1901, Dow makes reference to the 4 to 4 ½ year cycle by saying:
For the past 25 years the commodity market and the stock market have moved almost exactly together. The index number representing many commodities rose from 88 in 1878 to 120 in 1881. It dropped back to 90 in 1885, rose to 95 in 1891, dropped back to 73 in 1896, and recovered to 90 in 1900. Furthermore, index numbers kept in Europe and applied to quite different commodities had almost exactly the same movement in the same time. It is not necessary to say to anyone familiar with the course of the stock market that this has been exactly the course of stocks in the same period.”
All of the period that Dow mentions are based on the 4 year market cycle.  However, you don’t need to have a background in secular bull or bear markets from the 19th century to understand the value and weight of the 4 to 4 ½ year market cycle. In the Richard Russell’s Dow Theory Letter dated July 5, 1979, the 4 to 4 ½ year cycle is mentioned again. Of the cycle in question, Russell said:
We appear to have skipped the surest thing in the market this year, and that is the bottoming of the 4 to 4 ½ year cycle.”
Russell said this even though in retrospect we can clearly see, from a technical standpoint, that 1978 was the actual bottom in the cycle. Only four years later was the ultimate bottom of 1982 that would be the launching pad for the bull market from Dow 1,000 to Dow 10,000. In the same 1979 issue of the Dow Theory Letters, Russell includes a chart that points out the prior cycle bottoms since 1949 (1953, 1957, 1962, 1966, 1970, 1974, 1978) which I’ve included below.
We’ve pointed out that 1982 was the cycle bottom that launched a powerful bull market. However, that bull market wasn’t without interruptions. In the chart below we note the 4 to 4 ½ year cycles that took place along the way (1987, 1991, 1994,1998, and 2002).
Every cycle implies a halfway point that a reversal may take place from. For the 4 to 4 ½ year cycle, this means that the first two years of the cycle are spent going up. No matter whether there is secular bull or secular bear market, the 4 to 4 ½ year market cycle plays itself out for the most part.
Our last major market bottom was March 9, 2009. If my observations on this topic are correct, then we have at least until January 2011 to June 2011 before the half cycle is complete. Afterwards, the market would either trade in a range or establish a well-defined bottom in accordance with the 4 to 4 ½ year market cycle.
Sources:

Canadian Dividend Achievers

This list of Canadian Dividend Achievers, published by Mergent's, includes current and former Canadian Dividend Achievers and then ranking the companies based on those closest to the 52-week low. You'll find the most complete fundamental information on these companies at the FP website.

Symbol Name Price % from Low
CCO.TO CAMECO CORP $23.78 2.24%
IGM.TO IGM FINANCIAL INC. $38.86 3.54%
ESI.TO ENSIGN ENERGY SERVICES $12.99 6.56%
IMO.TO IMPERIAL OIL $40.54 7.39%
RBA.TO RITCHIE BROS AUCTIONEERS $21.78 7.93%
POW.TO POWER CORP CDA $25.87 9.57%
SU.TO SUNCOR ENERGY INC. $33.75 12.88%
CTC-A.TO CANADIAN TIRE CORP LTD $56.02 13.17%
PWF.TO POWER FINANCIAL CORP. $27.76 13.31%
SNC.TO SNC-LAVALIN SV $45.08 14.10%
TIH.TO TOROMONT IND $24.37 17.11%
TRI.TO THOMSON REUTERS $37.91 18.06%
Email our team here.