Below is a chart of ConAgra Brands (CAG) from 1983 to 2021 reflecting Price Momentum data.
-
Topics
Archives
-
-
Recent Posts
-
-
-
-

Below is a chart of ConAgra Brands (CAG) from 1983 to 2021 reflecting Price Momentum data.
Below is a chart of Verizon Communications (VZ) from 1985 to 2021 reflecting Price Momentum data.
Below is a chart of Hormel Foods Corp. (HRL) from 1981 to 2021 reflecting Price Momentum data.
Below is a chart of McCormick & Company (MKC) from 1974 to 2021 reflecting Price Momentum data.
This posting will cover the downside targets for the S&P 500 Index using Dow Theory and Edson Gould’s Speed Resistance Lines [SRL].
Dow’s Theory: 2020-2021
Applying Dow Theory from the March 23, 2020 to September 2, 2021 period, the downside targets for the S&P 500 Index are: Continue reading
This posting will cover the downside targets for the Dow Jones Industrial Average using Dow Theory and Edson Gould’s Speed Resistance Lines [SRL].
Dow’s Theory: 2020-2021
Applying Dow Theory from the March 23, 2020 to September 2, 2021 period, the downside targets for the Dow Jones Industrial Average are: Continue reading
Below is a chart of Brown-Forman Corporation (BF-B) from 1981 to 2021.
Below is the year-to-date performance of the stocks that constitute the Dogs of the TSX 60, the ten highest yielding stocks. For contrast, we’ve included the breakdown of the top 5, top 3 and 2nd, 3rd, 4th ranked members of the Toronto Stock Exchange with the lowest dividend yield for a sense of perspective.

Overall, all of the groupings are outperforming the Toronto Stock Exchange by a comfortable margin. This is the stated goal of the strategy, “to beat the index.”
Below is our breakdown of the performance of the Top Ten Low Yield Stocks as compared to the index: Continue reading
Below is the year-to-date performance of the stocks that constitute the Dogs of the Dow, the ten highest yielding stocks. For contrast, we’ve included the breakdown of the top 5, top 3 and 2nd, 3rd, 4th ranked members of the Dow Jones Industrial Average with the lowest dividend yield for a sense of perspective.
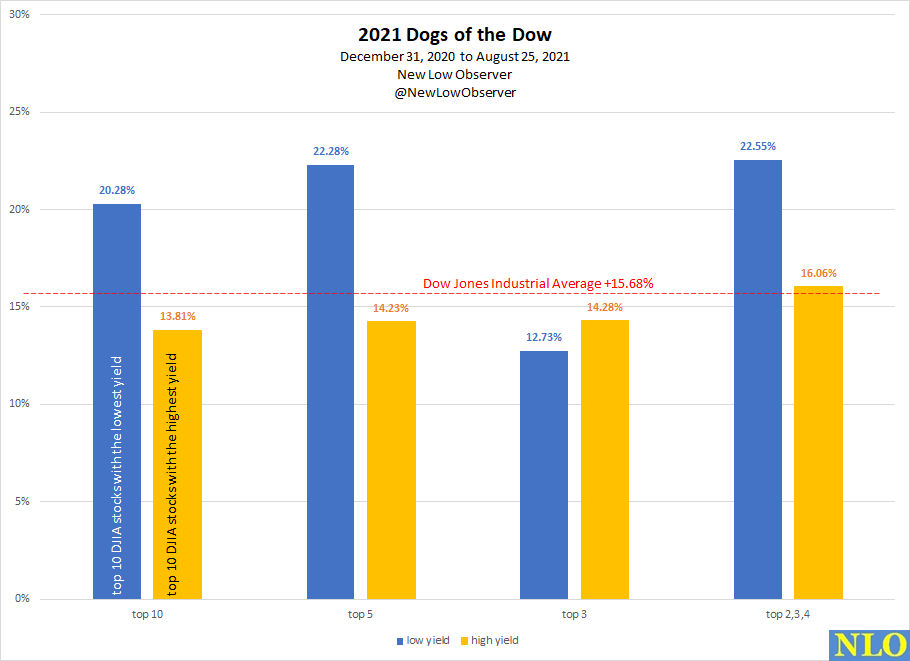
As noted in the chart, the Dow Jones Industrial Average has gained +15.68%. In the same period of time, the low yield stocks have gained +20.28% while the high yield stocks have gained +13.81%. This stands in stark contrast to the claim that the Dogs of the Dow (ten high yield stocks) beat the market. We’ve added the 10 low yield stocks show just how much the Dogs of the Dow strategy underperforms.
Below is our breakdown of the performance of the Dow Jones Industrial Average and the members of the index: Continue reading
The market ended the week virtually flat after hitting all-time high on Monday. The Transport and the Russell continue to struggle to move higher and test the peak. At the end of the week, they are nearly 10% off from the high. Below is the dividend watch list for the week. Nearly a third of the companies on this list are Dividend Aristocrat which would be a great start for anyone seeking high quality companies with strong record of dividend payments. Continue reading
Posted in Dividend Achiever Watch List, Dividend Achievers, Dividend Watch List
Tagged members
Below are the upside resistance targets based on the work of Edson Gould.
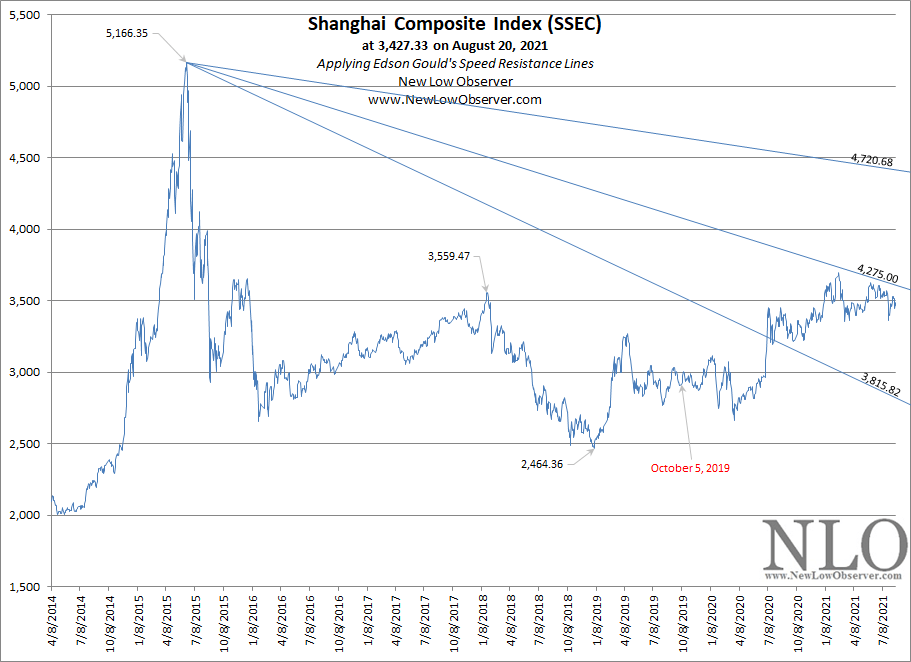
Our commentary from October 5, 2019 has remained accurate. At the time, we said:
“The more time passes the easier it gets to exceed the minimum upside resistance target of 3,815.82. The problem comes up when the market fails to breakout out on the upside in spite of the passage of time.”
The 3,815.82 target was achieved on what appeared to be strength. However, the 4,275 target has been met with resistance.
See Also:
Below are the downside targets based on the work of Edson Gould.

Using the Speed Resistance Lines of Edson Gould is ideal since it is a relative scale for every stock no matter the price AND TIME. Additionally, parabolic increases have been consistent in achieving the conservative target in the past (except in the case of Telsa).
See Also:
Posted in downside, Edson Gould, SRL, TCEHY
Below are the downside targets based on the work of Edson Gould.
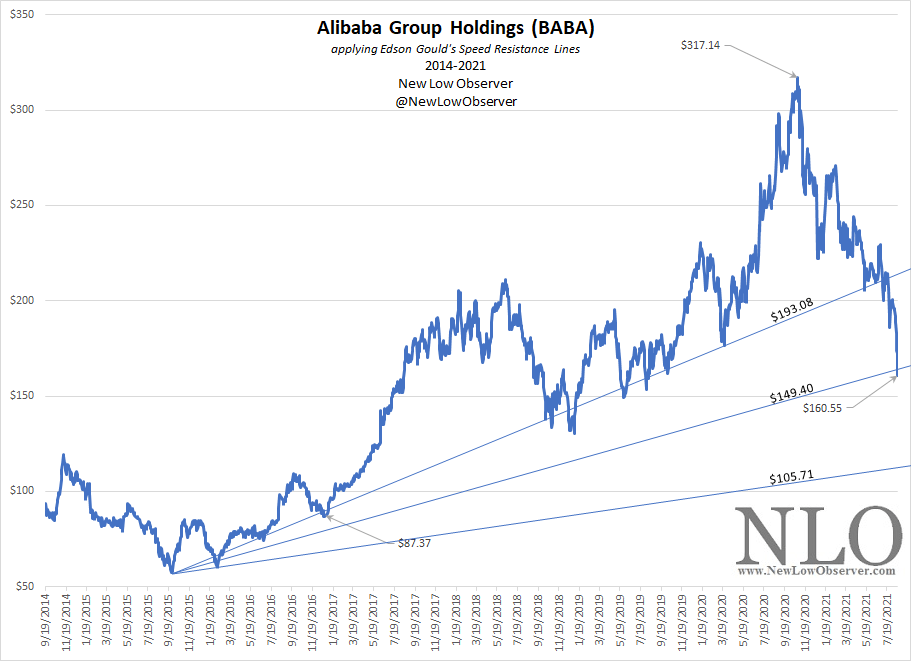
Using the Speed Resistance Lines of Edson Gould is ideal since it is a relative scale for every stock no matter the price AND TIME. Additionally, parabolic increases have been consistent in achieving the conservative target in the past (except in the case of Telsa).
Posted in BABA, downside, Edson Gould, SRL
We executed the following transaction(s):
The market continue to push all-time high. At the end of this week, the Industrial and S&P 500 closed at all-time high. The Nasdaq is off by a fraction of percentage. However, the Transport can’t seems to push back up to the top and remain nearly 10% off the high. Despite this concern, there are numbers of good companies to consider as part of building investment portfolio. Continue reading
Posted in Dividend Achiever Watch List, Dividend Achievers, Dividend Watch List
Tagged members