Below are the upside and downside targets based on the work of Edson Gould’s Speed Resistance Lines. Continue reading
-
Topics
Archives
-
-
Recent Posts
-
-
-
-

Below are the upside and downside targets based on the work of Edson Gould’s Speed Resistance Lines. Continue reading
Posted in Crude Oil, Edson Gould, Speed Resistance Lines, upside target
Tagged members
Drawing from the data provided by the Federal Reserve Bank of St. Louis, we have outlined the cyclical trends in the price of Crude Oil: West Texas Intermediate (DCOILWTICO) from 1986 to 2019.
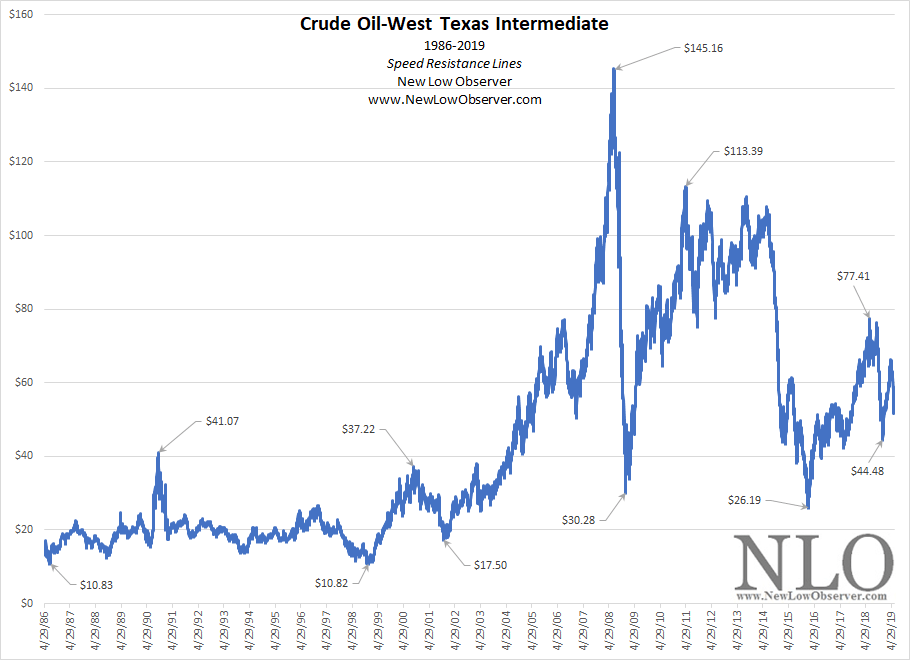
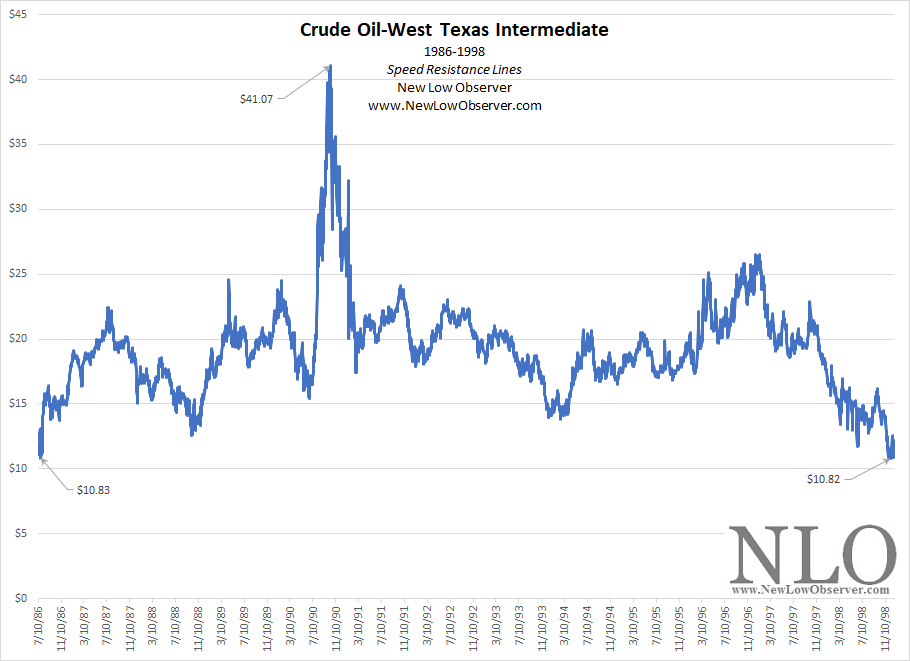
In the period from 1986 to 1998, crude oil experienced a full cycle that included an increase of +279% and a decline of -73%.
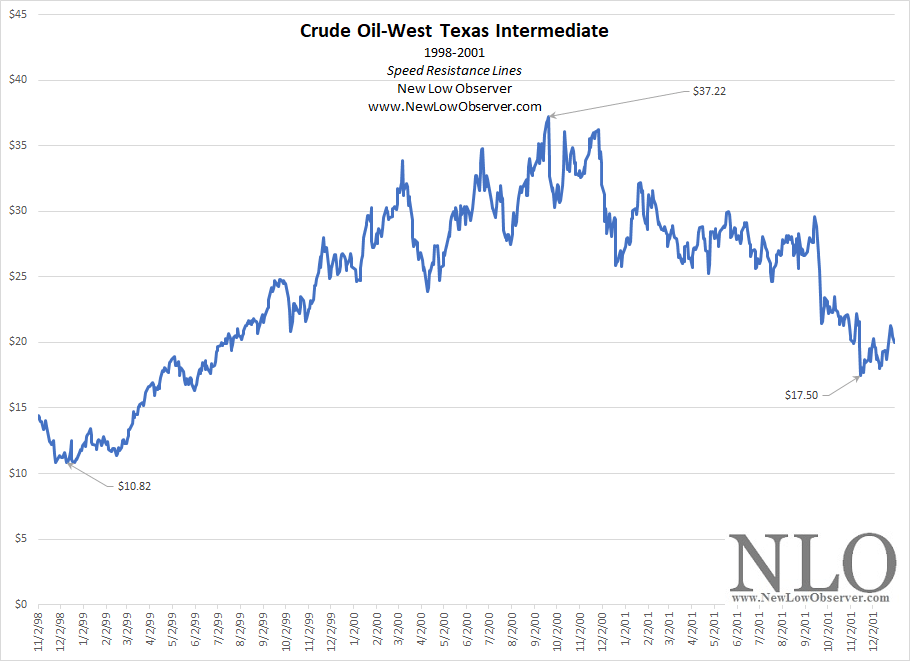
In the period from 1998 to 2001, crude oil experienced a full cycle that included an increase of +243% and a decline of -52%.
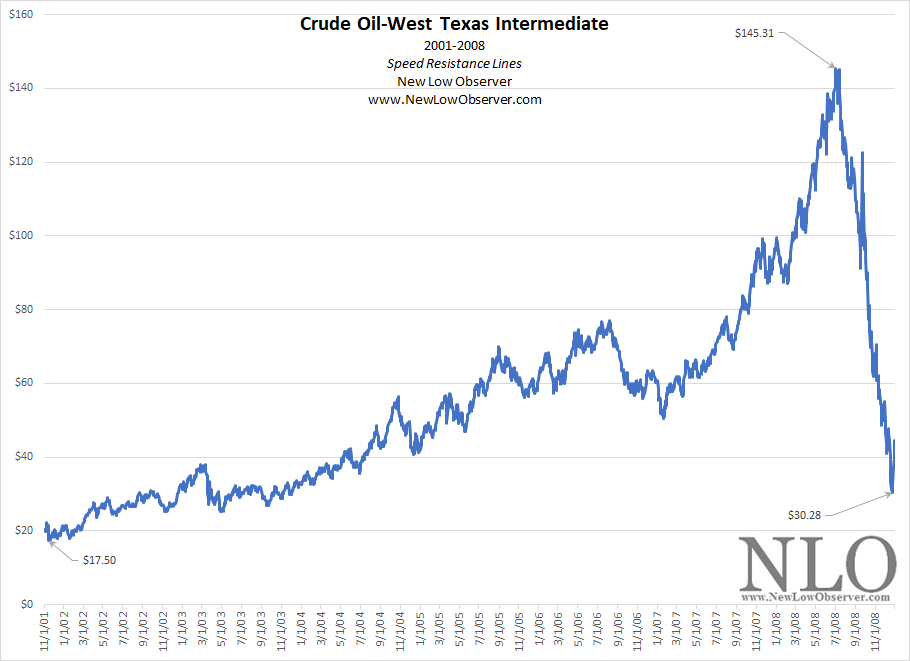
In the period from 2001 to 2008, crude oil experienced a full cycle that included an increase of +729% and a decline of -79%.
In the period from 2008 to 2016, crude oil experienced a full cycle that included an increase of +274% and a decline of -76%.
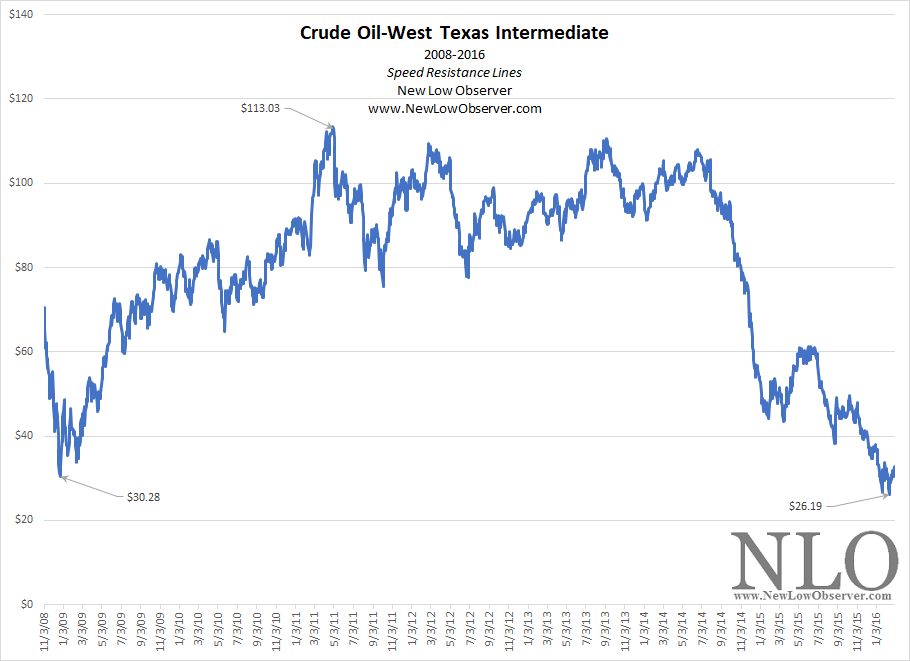
In the period from 2016 to the present, oil has experienced a cycle that included an increase of 195% and a decline of -42%.
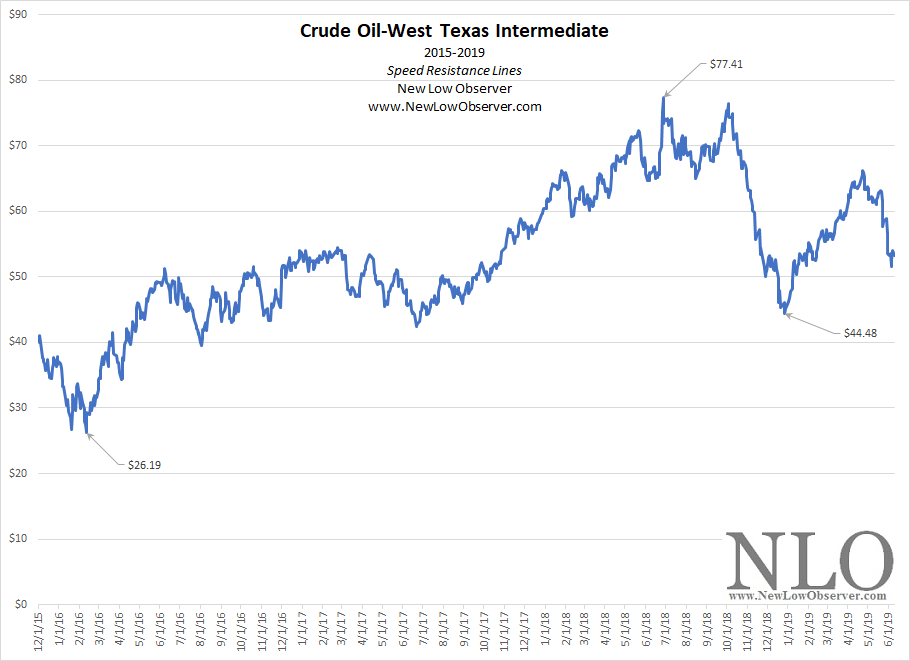
The data from the peak in 2018 to the most recent low at $44.48 is provided to reflect the cycle up to this point in time. The table below reflects the date, price, and percentage change (excluding the peak to trough from June 2018 to December 2018). When all declining periods are included, the average decline is -65.04%.
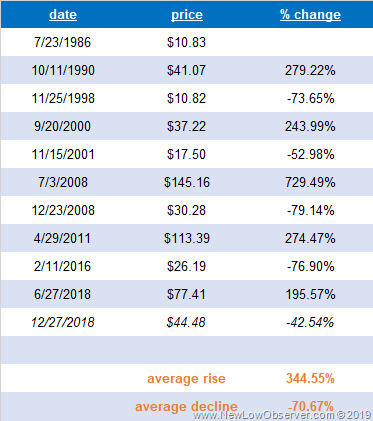
Our assessment of the data, as is commonly the case, is to default to the most conservative scenario. In the case of the latest decline in the price of oil from June 27, 2018 to the present, we calculated the decline of -52.98% as a possible turning point for the price of oil. A decline to such a level would bring the price of oil to $36.40, an additional decline of -29.40%.
Posted in Crude Oil, Cyclical Trends
The NLO team executed the following transaction(s): Continue reading
Below are the valuation targets for Cimarex Energy Co. (XEC) for the next 10 years. Continue reading
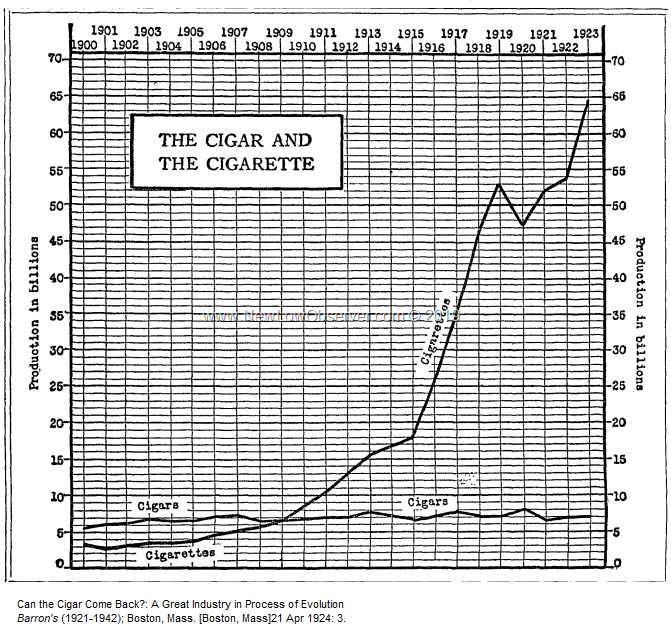
Below is a chart of the production of cigars and cigarettes from 1900-1923.
We have included the market share comparison of Juul, the e-cigarette that Altria (MO) recently increased their stake in, and other tobacco related products from 2014 to 2017 in a research report generated by Bonnie Herzog, senior analyst at Wells Fargo Securities.

Are cigarettes going the way of the cigar? Maybe. Will e-cigarettes replace cigarettes? Possibly.
As far as we’re concerned, all articles on the topic of cigarettes and e-cigs should mirror the 1924 Barron’s article title, “Can the Cigarette Come Back?: A Great Industry in Process of E-volution.”
Posted in 1900, 1923, Chart of the Day, cigarettes
Below is a chart of the price index of Southern England from 1290 to 1950. Highlighted in the chart is the formation of the Bank of England in 1694.

Additional reading: Interest Rate Policy: Bizarre to the Uninitiated
Posted in 1290, 1950, Chart of the Day, Federal Reserve Bank, inflation
Below is the average price-to-earnings ratio of twelve stocks from the 1921 low to December 1930.
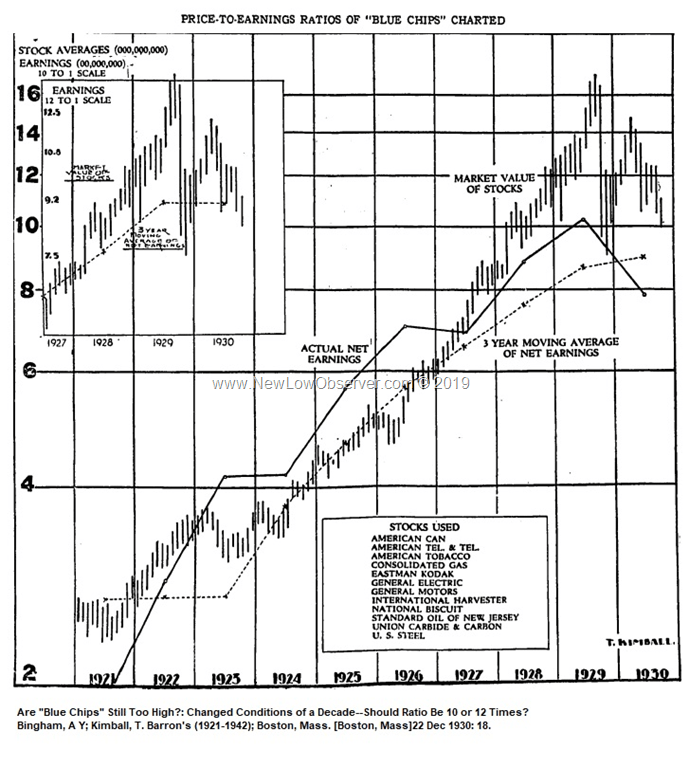
Worth noting is that the late 1929 low would have been considered undervalued to most investors.
Posted in Chart of the Day, High P/E, P/E ratio
Below are the valuation targets for Cintas Corp. (CTAS) for the next 10 years. Continue reading
Below are the valuation targets for CMS Energy Corp. (CMS) for the next 10 years. Continue reading
Below are the valuation targets for Church & Dwight Co. (CHD) for the next 10 years. Continue reading
Below is the annual 52-week low for Montana Power (MTP) from 1958 to 1968. We’ve also included the 3-month Treasury Bill as a comparison to show how utility stocks perform against the backdrop of rising interest rates.
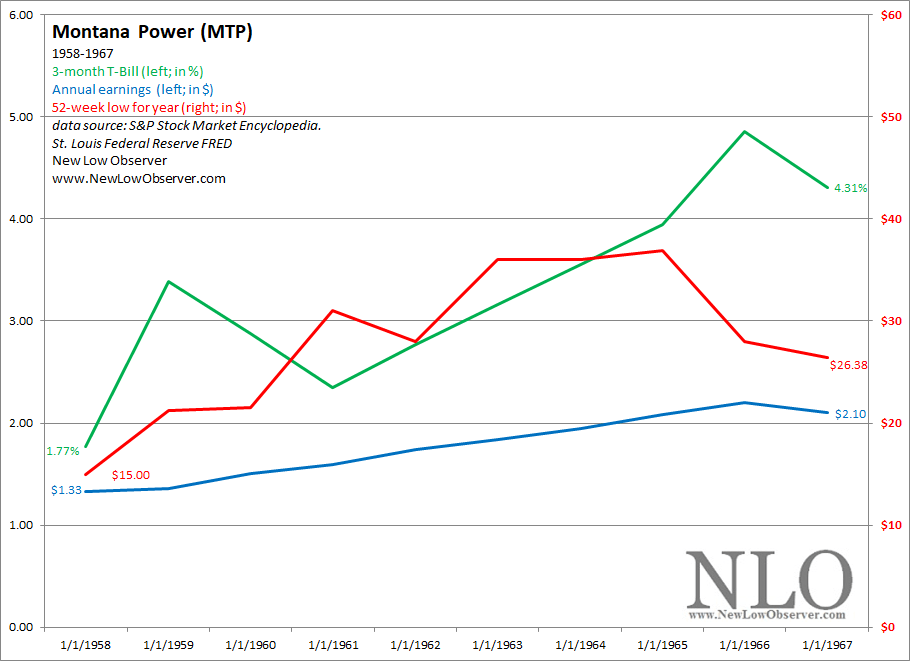
In this example, the 3-month Treasury Bill increased from 1.77% to 4.31%. Meanwhile, Montana Power (MTP) had a 52-week low range from $15.00 to $26.38.
Posted in 1958-1968, Chart of the Day, interest rates, Montana Power
Below is the annual 52-week low for Consolidated Edison (ED) from 1958 to 1967. We’ve also included the 3-month Treasury Bill as a comparison to show how utility stocks perform against the backdrop of rising interest rates.
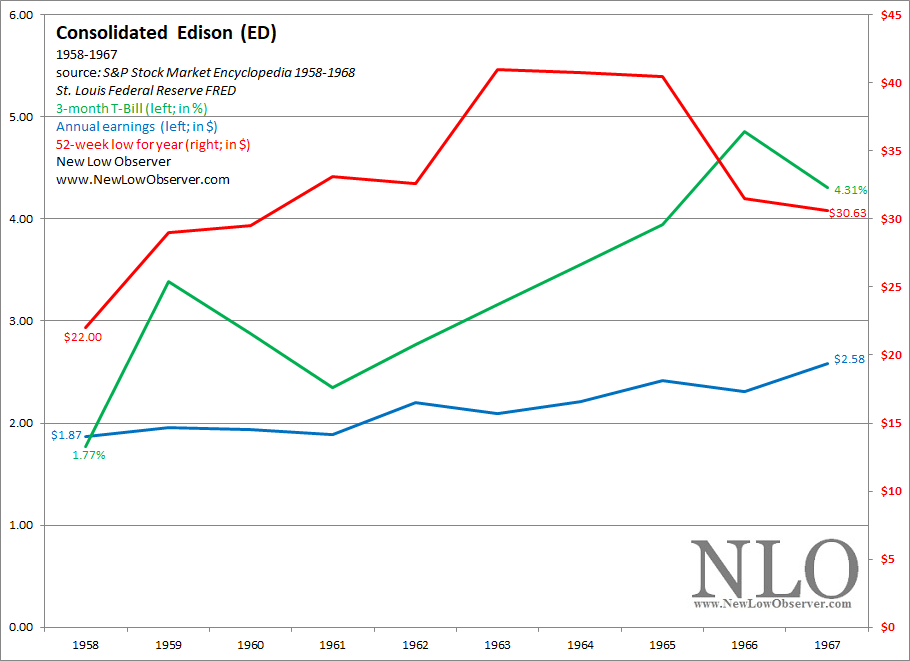
In this example, the 3-month Treasury Bill increased from 1.77% to 4.31%. Meanwhile, Consolidated Edison (ED) had a 52-week low range from $22.00 to $30.63.
Below is the annual 52-week low for Florida Power Corp. from 1958 to 1968. We’ve also included the Effective Fed Funds Rate as a comparison to show how utility stocks perform against the backdrop of rising interest rates.
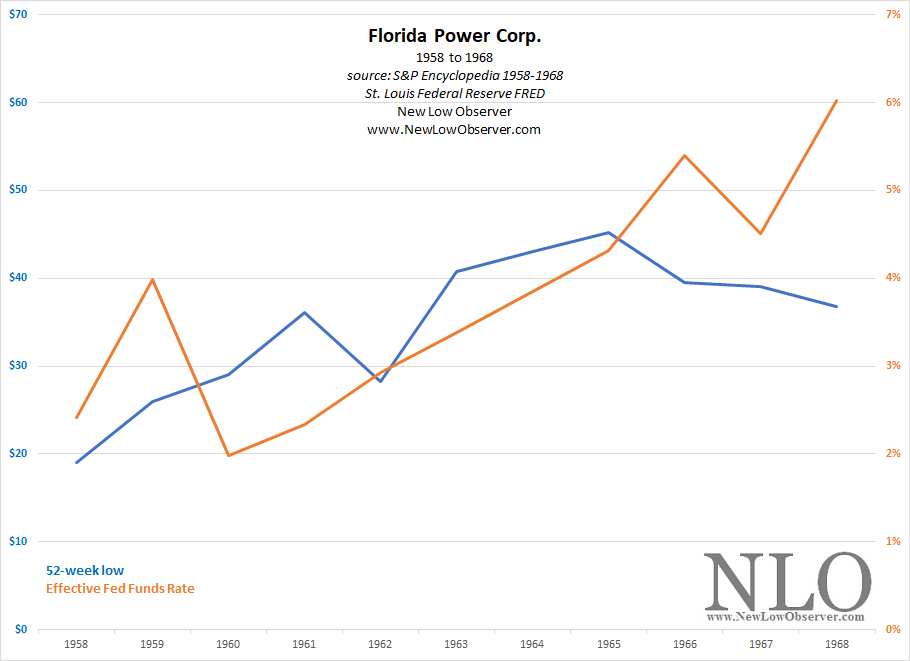
In this example, the Effective Fed Funds Rate increased from 2.42% to 6.02%. Meanwhile, Florida Power Corp. had a 52-week low range from $19 to $36.75.
Posted in 1958-1968, Chart of the Day, interest rates
The following are the established Bitcoin cycles since 2010 which are instrumental in our forecasting of the market price for Bitcoin going forward.
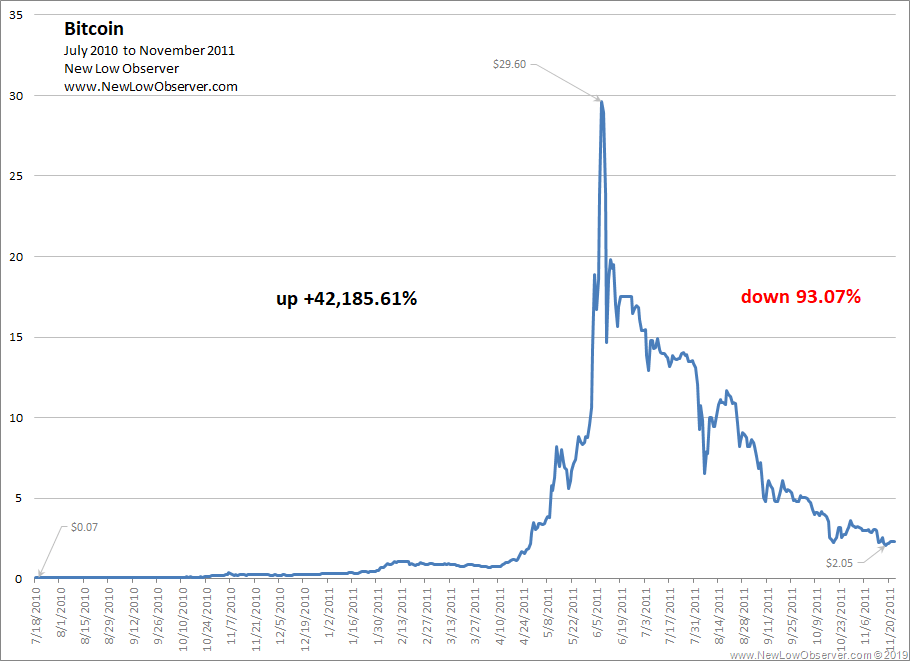
In the period from July 2010 to November 2011, Bitcoin increased +42,185.61% and decreased from the peak -93.07%.
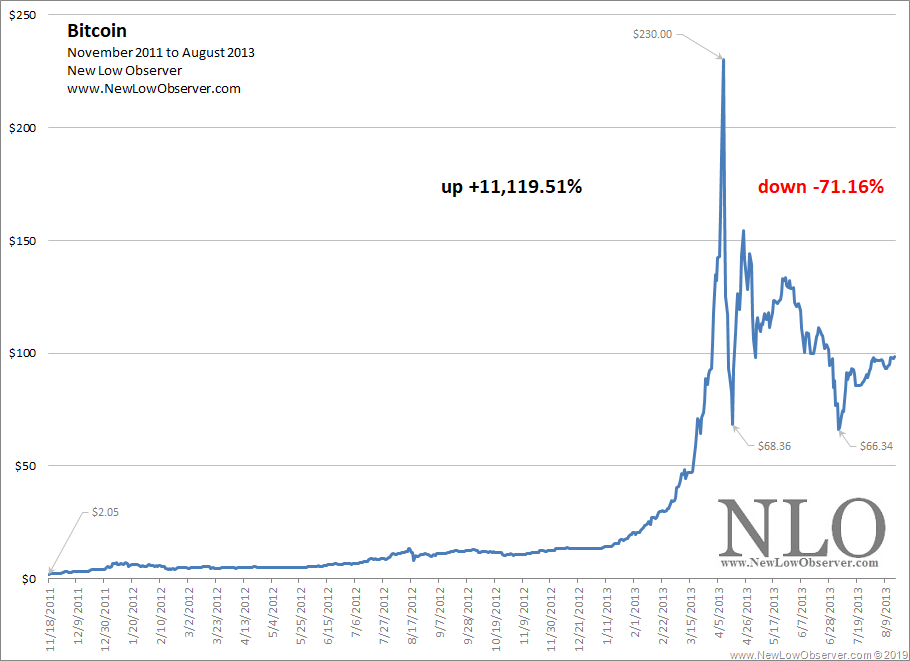
In the period from November 2011 to August 2013, Bitcoin increased +11,119.51% and decreased from the peak -71.16%.

In the period from April 2013 to October 2014, Bitcoin increased +1,629.35% and decreased from the peak -84.54%.
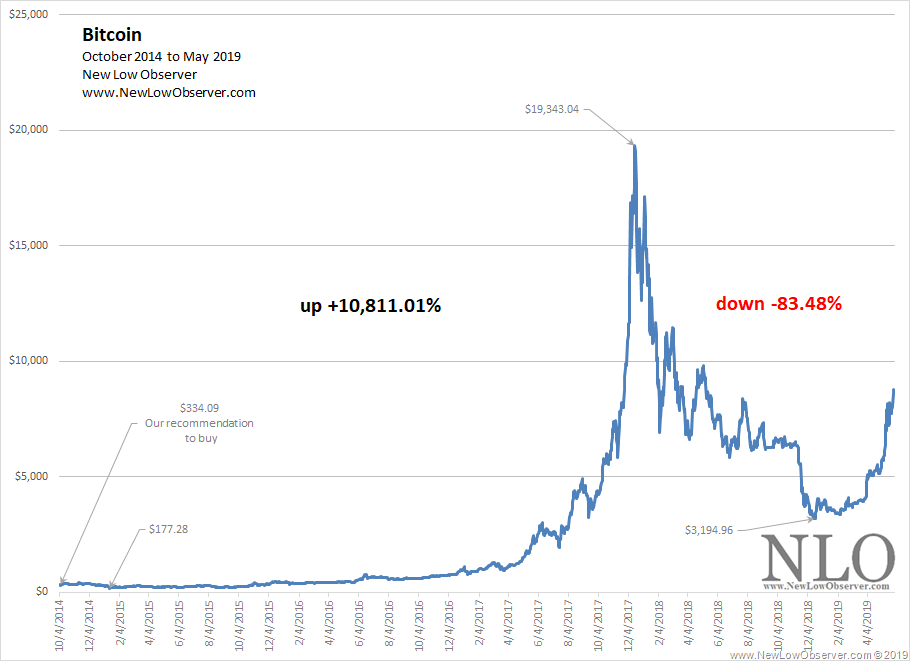
In the period from October 2014 to May 2019, Bitcoin increased +10,811.01% and decreased from the peak -83.48%. Our October 7, 2014 recommendation of Bitcoin at $334.09 found here.
Posted in Bitcoin, cycle analysis, Cyclical Trends, Market cycles