Monthly Archives: June 2010

Dow Theory

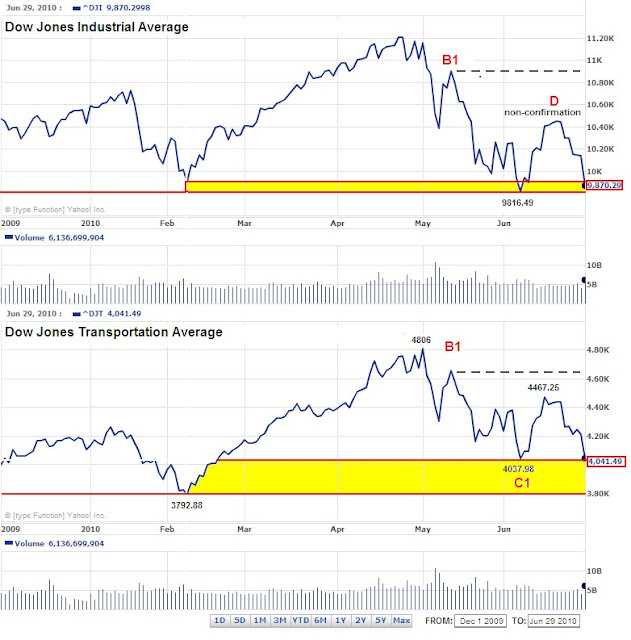
The markets are getting very close to giving us the Dow Theory indication that we need to exit a majority of our positions. Today (June 29, 2010), the Dow Jones Industrial Average closed at 9870.29 which is 53.80 points above the June 7, 2010 of 9816.49. Falling below 9816.49 would be one half of the bear market signal needed to indicate that the market will fall precipitously.

To make matters worse, the Dow Jones Transportation Index closed down today nearly twice as much as the Industrial Index. This indicates that there is significant selling interest. This doesn’t bode well for the Transports because in order to trigger the second half of the bear market signal the index would only have to fall 248.61 points. After today’s decline of 169.52 points in a single day, the remaining 79.09 points needed would not be all that difficult to come by.
The chart below displays a critical reason why I would be bearish on the market at this time. The dashed black line extending from B1 was supposed to be the upside target from point C1 in our last Dow Theory article. However, neither the Industrials nor the Transports were able to come close enough to be misinterpreted as an indication that the bull market run was likely to continue. The inability of the market to breach point B1 was a major non-confirmation according to Dow Theory.
Finally, any simultaneous declines of the Industrials and Transports below the yellow zones on a closing basis would tell us for certain that the bull market has run its course and that an additional correction of 15% on the Dow Jones Industrial Average is likely.

We’re being generous by not considering the June 7th lows for both indexes as the critical points for a bear market indication. For some Dow Theorists, waiting for the Transports low on February 5th is akin to playing with fire. However, we must adhere to the extremes to ensure quality buy and sell signals.

The only holdout is that either the Transportation Index or the Industrial Index gives us a downside non-confirmation by not going below the Feb. 5th or the June 7th lows, respectively. If we get a downside non-confirmation then we will consider selling a small portion of the portfolio on any strength.

Dividend Achiever Watch List

We've decided to make a slight modification to our criteria for the Dividend Achiever watch list.  Over the past several weeks, the number of companies on our watch list has been exploding.  As we explore the alternative field of investment, we thought that if there are adequate companies in the 10% range then we could use that as our criteria.  Therefore, this week's list (and going forward) will contain Dividend Achievers that are within 10% of the 52-week low.  If this list shirks to a certain size, we'll broaden our range to 20% as usual.

At the end of the week, our watch list contracted to 41 companies. Here is the watch list which ranks current and former Dividend Achievers that are within 10% of the 52-week low for June 25, 2010. Stocks that appear on our watch lists are not recommendations to buy.  Instead, they are the starting point for doing your research and determining the best company to buy.  Ideally, a stock that is purchased from this list is done after a considerable decline in the price and extensive due diligence.

Symbol Name Price % Yr Low P/E EPS (ttm) Div/Shr Yield Payout Ratio
WAG Walgreen Co. 26.93 0.00% 12.64 2.13 0.55 2.04% 26%
MON Monsanto Co. 48.27 0.23% 20.11 2.40 1.06 2.20% 44%
SVU SUPERVALU INC 12.00 0.59% 6.49 1.85 0.35 2.92% 19%
XOM Exxon Mobil Corp.   59.10 1.09% 13.46 4.39 1.76 2.98% 40%
HSC Harsco Corp. 25.05 1.58% 18.69 1.34 0.82 3.27% 61%
UMBF UMB Financial Corp.  36.73 1.72% 15.97 2.30 0.74 2.01% 32%
DNB Dun & Bradstreet Corp. 70.48 2.00% 14.12 4.99 1.40 1.99% 28%
FII Federated Investors Inc 21.32 2.40% 10.88 1.96 0.96 4.50% 49%
WMT Wal-Mart Stores, Inc. 48.80 3.06% 12.81 3.81 1.21 2.48% 32%
FFIN First Financial Bankshares, Inc.  49.55 3.53% 19.21 2.58 1.36 2.74% 53%
NTRS Northern Trust Corp.  48.44 3.68% 15.23 3.18 1.12 2.31% 35%
PFE Pfizer Inc 14.64 3.76% 13.56 1.08 0.72 4.92% 67%
FRS Frisch's Restaurants, Inc 20.70 3.97% 10.45 1.98 0.52 2.51% 26%
HRB H&R Block, Inc. 15.55 4.50% 10.58 1.47 0.60 3.86% 41%
CRRC Courier Corp.  12.74 5.29% 13.13 0.97 0.84 6.59% 87%
MATW Matthews International Corp.  29.53 5.46% 14.27 2.07 0.28 0.95% 14%
UFPI Universal Forest Products, Inc.  31.90 5.49% 23.63 1.35 0.40 1.25% 30%
NJR New Jersey Resources Corp. 35.45 5.85% 16.04 2.21 1.36 3.84% 62%
VIVO Meridian Bioscience Inc.  16.98 5.93% 21.49 0.79 0.76 4.48% 96%
LLY Eli Lilly & Co. 33.94 6.00% 8.75 3.88 1.96 5.77% 51%
GS* Goldman Sachs Group, Inc.   139.66 6.37% 5.82 24.01 1.40 1.00% 6%
JNJ Johnson & Johnson   58.70 6.49% 12.33 4.76 2.16 3.68% 45%
KO Coca-Cola Co 50.26 6.53% 16.53 3.04 1.76 3.50% 58%
CTWS Connecticut Water Service, Inc.  21.37 6.85% 18.11 1.18 0.91 4.26% 77%
T AT&T Inc 24.79 6.90% 12.33 2.01 1.68 6.78% 84%
AROW Arrow Financial Corp.  25.28 6.93% 13.52 1.87 1.00 3.96% 53%
CWT California Water Service Group 36.34 7.48% 18.83 1.93 1.19 3.27% 62%
THFF First Financial Corp. Indiana  27.23 7.50% 14.96 1.82 0.92 3.38% 51%
NWN Northwest Natural Gas Co. 44.22 8.30% 16.44 2.69 1.66 3.75% 62%
ABT Abbott Laboratories 47.19 8.61% 13.84 3.41 1.76 3.73% 52%
ADM Archer Daniels Midland Co. 26.34 8.75% 10.84 2.43 0.60 2.28% 25%
BDX Becton, Dickinson and Co. 69.05 8.89% 13.25 5.21 1.48 2.14% 28%
MDU MDU Resources Group Inc. 18.67 9.12% 13.34 1.40 0.63 3.37% 45%
PGN Progress Energy, Inc. 39.28 9.20% 14.44 2.72 2.48 6.31% 91%
HCC HCC Insurance Holdings, Inc. 25.36 9.22% 8.45 3.00 0.54 2.13% 18%
SFNC Simmons First National Corp.  26.78 9.31% 16.33 1.64 0.76 2.84% 46%
VVC Vectren Corp. 23.78 9.79% 15.64 1.52 1.36 5.72% 89%
AWR American States Water Co. 34.27 9.84% 19.15 1.79 1.04 3.03% 58%
AVP Avon Products, Inc. 27.49 9.96% 21.65 1.27 0.88 3.20% 69%
TMP Tompkins Financial Corp. 38.18 10.20% 12.64 3.02 1.36 3.56% 45%
OMI Owens & Minor, Inc. 28.19 10.46% 14.99 1.88 0.71 2.52% 38%
41 Companies


*Goldman Sachs isn't a former or current dividend achiever but we feel that it is worth watching because it's a proxy of our financial system.

Watch List Summary
The best performing stock from last week's list was Shenandoah Telecom (SHEN) which rose 7.9%.  The worst performing stock was Walgreen (WAG) which fell 10.5%.  Overall, the Dividend Achiever watch list lost 2.4% versus the Dow which was down 2.95%. Because our list has more than a handful of great companies, I urged investors to filter for companies with less than 50% payout ratio. This should minimized the risk of dividend reduction if earnings are to fall by half. If you understand the companies' history and their ability to pay the dividend, payout ratios in excess of 52% may be considered.

With Aaa bond ratings falling to 4.96%, I expected more companies to pass the first criteria of Graham's stock selection. But nothing has changed materially. Supervalue (SVU), Eli Lilly (LLY), Goldman Sachs (GS), and HCC Insurance Holdings (HCC) are the companies with an earnings yield that exceeds twice the Aaa bond rate and payout ratio less than 50%.

Another company we'd like to highlight is Walgreen (WAG).  The recent sell-off brought the yield up to 2.04%.  Although that doesn't appear to be like much, WAG highest yield was 2.36% (in 1989).  Using current dividend figure and the highest yielding period for WAG, shares would be at $23.30 or 13.5% down from current price. Since the company started paying dividend in 1985, they have increase their payout every year at an annual rate of  12.7%.

Once again, I suggest readers to use the March 2009 low (or companies' most distressed time) as downside projection for investing.  Our conservative view is to embrace the worse case scenario prior to investing.  March 2009 low fits that description.  Although we use the one year (52 weeks) time frame, the past year was nothing but a major bull run and anyone who bought at or near the low could, and should, be taking profits.  It is important to place these companies in your own watch list so that when opportunity arises, you can purchase them with a greater margin of safety.

Related Article:
Benjamin Graham's Stock Selection Criteria

Email our team here.

Q and A on Elliott Wave Cycles


Question:

A reader asks, "[Robert] Prechter's recent prediction based on his interpretation of the EWT [Elliott Wave Theory] cycles calls for a market top in 2012 and then a slide of humongous proportions to bottom in 2016. I am of course very familiar with his EWT, but just wanted to bring this to your attention.

"How do you view this in light of your cycle work?  Prechter is mentioning two cycles -- 7.25 yr and 20 yr -- both topping in 2012 as per the last paragraph in the article titled 'Elliott Wave predicts triple-digit Dow in 2016.'”

Answer:

Our most recent article of June 13, 2010 on the 4 ½ year cycle perfectly lines up with the EWT assertion of a peak in the market around 2012.  Remember, our 2011 estimate for a peak was conservative since it ignores that most 4 to 4 ½ year peaks occur in the 3rd year while we only assumed the 2nd year as the most likely (preemptive) top.  Interestingly, the 2016 cycle bottom fits snugly within Charles H. Dow’s claim of a 3 to 4 year cycle with a concentration on half-cycle tops.

Our view on the specific downside targets based on the Wave principle was addressed in the article dated October 16, 2009.  In that article we said,

The second type of market low is based on the premise that the Dow fulfills the Wave principle and falls below the upward trending line (red) to the old support level 8100 and then 6440. A true Wave move down to the old low would bring the market below 6440. However, the last time this was fulfilled, in the period from 1970 to 1974, the market only fell 8.5% below the previous low of 631.16 on the Dow Industrials in 1970. Additionally, the Industrials ran up from 631.16 in 1970 to 1051.70 in 1973, an increase of 118% of the previous peak. As more time passes I expect the index to fall to 5474 [8.5% of the March 9, 2009] if we do manage to complete a Wave formation on the downside.”


Our view is that we start from the premise of prior fulfillment of the Wave Principle (using Dow’s requirement of precedent to prove; until proven otherwise) at or near major market bottoms and then work our way down from there.  The Wave principle, as strictly defined by R.N. Elliott, indicates that the market only needs to fall slightly below the prior all time low to be complete.  The major super cycle low that was predicted for 1974 didn’t go to 100 or 200 as expected at the time.  Instead it fell only 8.5% below the 1970 low.

We believe that the 5474 is the most realistic starting point to work from.  Any declines below 5474 level need to be assessed based on the conditions of the market at that specific time.   

We cannot emphasize enough the fact that the calls of 90% declines, or Grand Supercycle bottoms, are based falsely, in our opinion, on the Dow declines of 1929 to 1932 which was largely a result of dramatic changes to the index during that period rather that a relatively static constituency of the index from the 1929 top to the 1932 bottom (Article 1 and Article 2 addressing the issue of index changes and post Depression performance, respectively). 

Again, we would rather assess the situation once we meet the minimum requirement of “fulfilling” the Wave principle which may concurrently meet the requirement needed to acquire stocks at “traditionally” undervalued levels.

Email our team here.

Dividend Achiever Watch List

At the end of the week, our watch list contracted to 69 companies. Here is the watch list which ranks current and former Dividend Achievers that are within 20% of the 52-week low for June 18, 2010. Stocks that appear on our watch lists are not recommendations to buy.  Instead, they are the starting point for doing your research and determining the best company to buy.  Ideally, a stock that is purchased from this list is done after a considerable decline in the price and extensive due diligence.
Symbol Name Price % Yr Low P/E EPS (ttm) Div/Shr Yield Payout Ratio
UMBF UMB Financial Corp.  37.38 2.98% 16.25 2.30 0.74 1.98% 32%
UFPI Universal Forest Products, Inc.  31.34 3.64% 23.21 1.35 0.40 1.28% 30%
FRS Frisch's Restaurants, Inc 20.73 4.12% 10.47 1.98 0.52 2.51% 26%
FFIN First Financial Bankshares, Inc.  50.07 4.62% 19.41 2.58 1.36 2.72% 53%
MON Monsanto Co. 50.39 4.63% 21.00 2.40 1.06 2.10% 44%
GS* Goldman Sachs Group, Inc.   138.18 5.24% 5.76 24.01 1.40 1.01% 6%
HSC Harsco Corp. 25.99 5.39% 19.40 1.34 0.82 3.16% 61%
DNB Dun & Bradstreet Corp. 73.23 5.98% 14.68 4.99 1.40 1.91% 28%
HRB H&R Block, Inc. 15.80 6.18% 10.75 1.47 0.60 3.80% 41%
FII Federated Investors Inc 22.15 6.39% 11.30 1.96 0.96 4.33% 49%
SHEN Shenandoah Telecom 16.68 7.20% 15.16 1.10 0.32 1.92% 29%
AROW Arrow Financial Corp.  25.44 7.61% 13.60 1.87 1.00 3.93% 53%
NTRS Northern Trust Corp.  50.30 7.66% 15.82 3.18 1.12 2.23% 35%
THFF First Financial Corp. Indiana  27.27 7.66% 14.98 1.82 0.92 3.37% 51%
JNJ Johnson & Johnson   59.18 7.78% 12.43 4.76 2.16 3.65% 45%
SVU SUPERVALU INC 12.86 7.80% 6.95 1.85 0.35 2.72% 19%
PFE Pfizer Inc 15.21 7.80% 14.08 1.08 0.72 4.73% 67%
WAG Walgreen Co. 30.09 7.89% 14.13 2.13 0.55 1.83% 26%
XOM Exxon Mobil Corp.   63.10 7.94% 14.37 4.39 1.76 2.79% 40%
LLY Eli Lilly & Co. 34.61 8.09% 8.92 3.88 1.96 5.66% 51%
CTWS Connecticut Water Service, Inc.  21.63 8.15% 18.33 1.18 0.91 4.21% 77%
CWT California Water Service Group 36.66 8.43% 18.99 1.93 1.19 3.25% 62%
WMT Wal-Mart Stores, Inc. 51.55 8.87% 13.53 3.81 1.21 2.35% 32%
NJR New Jersey Resources Corp. 36.52 9.05% 16.52 2.21 1.36 3.72% 62%
AWR American States Water Co. 34.12 9.36% 19.06 1.79 1.04 3.05% 58%
T AT&T Inc 25.43 9.66% 12.65 2.01 1.68 6.61% 84%
HCC HCC Insurance Holdings, Inc. 25.54 9.99% 8.51 3.00 0.54 2.11% 18%
KO Coca-Cola Co 52.31 10.87% 17.21 3.04 1.76 3.36% 58%
VVC Vectren Corp. 24.11 11.31% 15.86 1.52 1.36 5.64% 89%
SFNC Simmons First National Corp.  27.32 11.51% 16.66 1.64 0.76 2.78% 46%
TMP Tompkins Financial Corp. 38.69 11.67% 12.81 3.02 1.36 3.52% 45%
MDU MDU Resources Group Inc. 19.13 11.81% 13.66 1.40 0.63 3.29% 45%
PGN Progress Energy, Inc. 40.34 12.15% 14.83 2.72 2.48 6.15% 91%
ABT Abbott Laboratories 48.77 12.24% 14.30 3.41 1.76 3.61% 52%
ADM Archer Daniels Midland Co. 27.19 12.26% 11.19 2.43 0.60 2.21% 25%
BEC Beckman Coulter, Inc. 60.25 12.28% 25.21 2.39 0.72 1.20% 30%
VIVO Meridian Bioscience Inc.  18.00 12.29% 22.78 0.79 0.76 4.22% 96%
BDX Becton, Dickinson and Co. 71.32 12.47% 13.69 5.21 1.48 2.08% 28%
MATW Matthews International Corp.  31.56 12.71% 15.25 2.07 0.28 0.89% 14%
OMI Owens & Minor, Inc. 28.77 12.74% 15.30 1.88 0.71 2.47% 38%
NWN Northwest Natural Gas Co. 46.12 12.96% 17.14 2.69 1.66 3.60% 62%
CRRC Courier Corp.  13.77 13.80% 14.20 0.97 0.84 6.10% 87%
PBI Pitney Bowes Inc   23.23 13.98% 12.10 1.92 1.46 6.28% 76%
XRAY DENTSPLY International Inc.  31.72 14.14% 17.33 1.83 0.20 0.63% 11%
UGI UGI Corp. 26.50 14.32% 12.10 2.19 1.00 3.77% 46%
BCR CR Bard, Inc. 80.30 14.55% 16.98 4.73 0.72 0.90% 15%
AVP Avon Products, Inc. 28.74 14.96% 22.63 1.27 0.88 3.06% 69%
MGEE MGE Energy Inc.  36.94 15.22% 16.94 2.18 1.47 3.98% 67%
TR Tootsie Roll Industries Inc  25.28 15.28% 26.89 0.94 0.32 1.27% 34%
WTR Aqua America Inc 17.77 15.46% 22.49 0.79 0.58 3.26% 73%
WEYS Weyco Group, Inc.  24.07 15.61% 19.57 1.23 0.64 2.66% 52%
SBSI Southside Bancshares, Inc.  20.11 15.64% 7.56 2.66 0.68 3.38% 26%
FPL FPL Group, Inc. 52.51 15.94% 11.88 4.42 2.00 3.81% 45%
WGL WGL Holdings, Inc. 35.24 16.04% 15.19 2.32 1.51 4.28% 65%
CL Colgate-Palmolive Co. 80.59 16.07% 19.70 4.09 2.12 2.63% 52%
SIAL Sigma-Aldrich Corp.  53.21 16.18% 18.16 2.93 0.64 1.20% 22%
RNST Renasant Corp.  14.24 16.24% 18.74 0.76 0.68 4.78% 89%
STFC State Auto Financial Corp.  17.67 16.94% 19.00 0.93 0.60 3.40% 65%
ATO Atmos Energy Corp. 28.67 17.45% 13.78 2.08 1.34 4.67% 64%
CTBI Community Trust BanCorp., Inc.  26.06 17.65% 15.60 1.67 1.20 4.60% 72%
APD Air Products & Chemicals, Inc. 71.54 18.21% 17.93 3.99 1.96 2.74% 49%
CLX Clorox Co. 65.07 18.50% 15.31 4.25 2.20 3.38% 52%
PAYX Paychex, Inc.  28.33 18.83% 21.46 1.32 1.24 4.38% 94%
SJW SJW Corp. 24.59 19.20% 28.59 0.86 0.68 2.77% 79%
TRH Transatlantic Holdings, Inc. 49.46 19.24% 7.90 6.26 0.84 1.70% 13%
WST West Pharmaceutical Services, Inc. 37.81 19.46% 16.96 2.23 0.64 1.69% 29%
MDT Medtronic, Inc. 38.87 20.04% 13.93 2.79 0.82 2.11% 29%
PNY Piedmont Natural Gas Co., Inc. 27.03 20.13% 12.75 2.12 1.12 4.14% 53%
PX Praxair, Inc. 81.17 20.81% 19.85 4.09 1.80 2.22% 44%
69 Companies


*Goldman Sachs isn't a former or current dividend achiever but we feel that it is worth watching because it's a proxy of our financial system.

Watch List Summary

The best performing stock from last week's list was Archer Daniels (ADM) which rose 6%.  The worst performing stock was Universal Forest Products (UFPI) which fell 7.7%.  Overall, the Dividend Achiever watch list gained 2.1% versus the Dow which was up 2.3%. Because our list has more than a handful of great companies, I urged investors to filter through company with maximum of 50% payout ratio. This should minimized the risk of dividend reduction. If you understand the companies history and their ability to pay dividend, payout ratio in excess of 50% may be considered.

Take a closer look at our top 10 companies on the list. These companies combined for an average payout ratio of 37% and 8% earning yield.

Readers should use the March 2009 low (or companies' most distress time) as a base case for investing.  Our conservative view is to embrace the worse case scenario prior to investing.  March 2009 low fits that description.  Although we use the one year (52 weeks) time frame, the past year was nothing but major bull run and anyone who bought at or near the low can be taking profit.  It's important to place these companies in your own watch list so that when opportunities arise, you can purchase them with greater margin of safety.

Email our team here.

Remaining Ex-Dividend Dates for the Month of June

Below are the approximate ex-dividend dates for companies that appear on our Dividend Achiever and Nasdaq 100 Watch Lists for the rest of June. If you happen to be researching these companies for potential investment, it would be advisable to consider the ex-dividend date prior to possible purchases. Owning the shares of the company that you're interested in before the ex-dividend date entitles you to the upcoming dividend payment. Owning the shares on or after the ex-dividend date means that you would have to wait at least three months before receipt of the next dividend payment.
Please verify the ex-dividend date and payout ratio before committing funds to these stocks. Additionally, do not base your next long or short-term purchase on the dividend payment or yield. Instead, get as much research in as you possibly can before the ex-dividend date "just in case" you're actually interested in buying the stock.
Symbol Name Trade % from Low Yield Ex-Div
SRE Sempra Energy Common Stock $48.22 9.82% 3.20% 6/16/2010
EGP EastGroup Properties, Inc. $37.80 19.77% 5.60% 6/16/2010
FRS Frisch's Restaurants, Inc. $20.39 2.41% 2.50% 6/17/2010
OSBC Old Second Bancorp, Inc. $3.72 10.71% 1.10% 6/22/2010
PNY Piedmont Natural Gas $25.86 14.93% 4.30% 6/22/2010
XRAY DENTSPLY International $31.27 12.52% 0.60% 6/23/2010
SUP Superior Industries $14.45 12.98% 4.40% 6/23/2010
SPLS Staples, Inc. $21.72 16.03% 1.70% 6/23/2010
STLD Steel Dynamics, Inc. $14.38 15.69% 2.10% 6/27/2010
STT State Street Corp $37.03 3.09% 0.10% 6/28/2010
NUE Nucor Corporation $42.43 10.87% 3.40% 6/28/2010
HCC HCC Insurance Holdings $24.85 7.02% 2.20% 6/29/2010
APD Air Products and Chemicals $69.02 14.04% 2.90% 6/29/2010
Email our team here.

The 4 to 4 1/2 Year Market Cycle

When introducing the topic of market cycles it is often looked upon as something that is more wishful thinking more than anything else. However, it is my hope that I can provided sufficient evidence to convince you that objective observation of the 4 to 4 ½ year market cycle is well worth your time.
Introduction of the topic of the 4 to 4 ½ year market cycle does not come lightly. On September 13, 1900, Charles H. Dow, founder and editor of the Wall Street Journal, referenced the 4-year cycle as noted below:
We have frequently demonstrated that the stock market, while full of short fluctuations, has a continuing main movement, which often runs in one direction for three or four years at a time.”
Again on February 21, 1901, Dow makes reference to the 4 to 4 ½ year cycle by saying:
For the past 25 years the commodity market and the stock market have moved almost exactly together. The index number representing many commodities rose from 88 in 1878 to 120 in 1881. It dropped back to 90 in 1885, rose to 95 in 1891, dropped back to 73 in 1896, and recovered to 90 in 1900. Furthermore, index numbers kept in Europe and applied to quite different commodities had almost exactly the same movement in the same time. It is not necessary to say to anyone familiar with the course of the stock market that this has been exactly the course of stocks in the same period.”
All of the period that Dow mentions are based on the 4 year market cycle.  However, you don’t need to have a background in secular bull or bear markets from the 19th century to understand the value and weight of the 4 to 4 ½ year market cycle. In the Richard Russell’s Dow Theory Letter dated July 5, 1979, the 4 to 4 ½ year cycle is mentioned again. Of the cycle in question, Russell said:
We appear to have skipped the surest thing in the market this year, and that is the bottoming of the 4 to 4 ½ year cycle.”
Russell said this even though in retrospect we can clearly see, from a technical standpoint, that 1978 was the actual bottom in the cycle. Only four years later was the ultimate bottom of 1982 that would be the launching pad for the bull market from Dow 1,000 to Dow 10,000. In the same 1979 issue of the Dow Theory Letters, Russell includes a chart that points out the prior cycle bottoms since 1949 (1953, 1957, 1962, 1966, 1970, 1974, 1978) which I’ve included below.
We’ve pointed out that 1982 was the cycle bottom that launched a powerful bull market. However, that bull market wasn’t without interruptions. In the chart below we note the 4 to 4 ½ year cycles that took place along the way (1987, 1991, 1994,1998, and 2002).
Every cycle implies a halfway point that a reversal may take place from. For the 4 to 4 ½ year cycle, this means that the first two years of the cycle are spent going up. No matter whether there is secular bull or secular bear market, the 4 to 4 ½ year market cycle plays itself out for the most part.
Our last major market bottom was March 9, 2009. If my observations on this topic are correct, then we have at least until January 2011 to June 2011 before the half cycle is complete. Afterwards, the market would either trade in a range or establish a well-defined bottom in accordance with the 4 to 4 ½ year market cycle.
Sources:

Canadian Dividend Achievers

This list of Canadian Dividend Achievers, published by Mergent's, includes current and former Canadian Dividend Achievers and then ranking the companies based on those closest to the 52-week low. You'll find the most complete fundamental information on these companies at the FP website.

Symbol Name Price % from Low
CCO.TO CAMECO CORP $23.78 2.24%
IGM.TO IGM FINANCIAL INC. $38.86 3.54%
ESI.TO ENSIGN ENERGY SERVICES $12.99 6.56%
IMO.TO IMPERIAL OIL $40.54 7.39%
RBA.TO RITCHIE BROS AUCTIONEERS $21.78 7.93%
POW.TO POWER CORP CDA $25.87 9.57%
SU.TO SUNCOR ENERGY INC. $33.75 12.88%
CTC-A.TO CANADIAN TIRE CORP LTD $56.02 13.17%
PWF.TO POWER FINANCIAL CORP. $27.76 13.31%
SNC.TO SNC-LAVALIN SV $45.08 14.10%
TIH.TO TOROMONT IND $24.37 17.11%
TRI.TO THOMSON REUTERS $37.91 18.06%
Email our team here.

Nasdaq 100 Watch List

Below are the Nasdaq 100 companies that are between 10% and  20% of the 52-week low.  For companies that are within 10% of the 52-week low, please refer to last week's Nasdaq 100 watch list.  This list is strictly for the purpose of researching whether or not the companies have viable business models or are about to go out of business. These companies are deemed highly speculative unless otherwise noted.

Symbol Name Price P/E EPS Yield P/B % from Low
FISV Fiserv, Inc. $47.51 14.9 3.19 0.00% 2.31 10.13%
BIIB Biogen Idec Inc $46.22 14 3.3 0.00% 2.18 10.71%
DELL Dell Inc. $13.15 16.3 0.81 0.00% 4.29 11.06%
XRAY DENTSPLY Intl $31.20 17.1 1.83 0.60% 2.51 12.27%
LOGI Logitech Intl $14.57 40.3 0.36 0.00% 2.58 13.56%
VRTX Vertex Pharmaceuticals $35.01 0 -3.5 0.00% 6.96 14.79%
TEVA Teva Pharmaceutical $52.97 21 2.52 1.20% 2.39 14.80%
STLD Steel Dynamics, Inc. $14.28 20.8 0.69 2.10% 1.50 14.88%
SIAL Sigma-Aldrich $52.66 18 2.93 1.20% 3.74 14.98%
SPLS Staples, Inc. $21.73 20.1 1.08 1.70% 2.36 16.08%
HOLX Hologic, Inc. $14.57 26.5 0.55 0.00% 1.32 16.37%
ORCL Oracle Corporation $22.69 20.3 1.12 0.90% 3.91 16.54%
MSFT Microsoft Corporation $25.66 13.3 1.93 2.00% 4.79 16.64%
MXIM Maxim Integrated Products $17.52 72.1 0.24 4.60% 2.17 17.11%
JNPR Juniper Networks $24.99 47.2 0.53 0.00% 2.11 17.71%
CTAS Cintas Corporation $25.30 23.6 1.07 1.90% 1.57 18.78%
PAYX Paychex, Inc. $28.36 21.6 1.32 4.40% 7.40 18.96%
CHRW C.H. Robinson Worldwide $58.21 27.2 2.14 1.70% 8.98 19.43%
NVDA NVIDIA Corporation $11.61 24.1 0.48 0.00% 2.27 19.57%
Email our team here.

Dividend Achiever Watch List

At the end of the week, our watch list contracted to 72 companies. Here is the watch list which ranks current and former Dividend Achievers that are within 20% of the 52-week low for June 11, 2010. Stocks that appear on our watch lists are not recommendations to buy.  Instead, they are the starting point for doing your research and determining the best company to buy.  Ideally, a stock that is purchased from this list is done after a considerable decline in the price and extensive due diligence.

Symbol Name Price % Yr Low P/E EPS (ttm) Div/Shr Yield Payout Ratio
SVU SUPERVALU INC 12.24 2.60% 6.62 1.85 0.35 2.86% 19%
FRS Frisch's Restaurants, Inc 20.55 3.21% 10.38 1.98 0.52 2.53% 26%
CWT California Water Service Group 34.91 3.25% 18.09 1.93 1.19 3.41% 62%
GS* Goldman Sachs Group, Inc.   135.64 3.31% 5.65 24.01 1.40 1.03% 6%
UMBF UMB Financial Corp.  37.58 3.53% 16.34 2.30 0.74 1.97% 32%
NJR New Jersey Resources Corp. 34.81 3.94% 15.75 2.21 1.36 3.91% 62%
DNB Dun & Bradstreet Corp. 71.84 3.97% 14.40 4.99 1.40 1.95% 28%
FFIN First Financial Bankshares, Inc.  49.92 4.30% 19.35 2.58 1.36 2.72% 53%
AWR American States Water Co. 32.68 4.74% 18.26 1.79 1.04 3.18% 58%
SHEN Shenandoah Telecom 16.34 5.01% 14.85 1.10 0.32 1.96% 29%
LLY Eli Lilly & Co. 33.67 5.15% 8.68 3.88 1.96 5.82% 51%
HSC Harsco Corp. 25.99 5.39% 19.40 1.34 0.82 3.16% 61%
WAG Walgreen Co. 29.48 5.70% 13.84 2.13 0.55 1.87% 26%
XOM Exxon Mobil Corp.   61.86 5.82% 14.09 4.39 1.76 2.85% 40%
CTWS Connecticut Water Service, Inc.  21.17 5.85% 17.94 1.18 0.91 4.30% 77%
ADM Archer Daniels Midland Co. 25.64 5.86% 10.55 2.43 0.60 2.34% 25%
THFF First Financial Corp. Indiana  26.84 5.96% 14.75 1.82 0.92 3.43% 51%
AROW Arrow Financial Corp.  25.10 6.17% 13.42 1.87 1.00 3.98% 53%
MON Monsanto Co. 51.23 6.37% 21.35 2.40 1.06 2.07% 44%
HRB H&R Block, Inc. 15.86 6.59% 10.79 1.47 0.60 3.78% 41%
NTRS Northern Trust Corp.  49.93 6.87% 15.70 3.18 1.12 2.24% 35%
FII Federated Investors Inc 22.25 6.87% 11.35 1.96 0.96 4.31% 49%
SFNC Simmons First National Corp.  26.21 6.98% 15.98 1.64 0.76 2.90% 46%
VVC Vectren Corp. 23.21 7.16% 15.27 1.52 1.36 5.86% 89%
HCC HCC Insurance Holdings, Inc. 24.89 7.19% 8.30 3.00 0.54 2.17% 18%
JNJ Johnson & Johnson   58.46 7.19% 12.28 4.76 2.16 3.69% 45%
WMT Wal-Mart Stores, Inc. 50.86 7.41% 13.35 3.81 1.21 2.38% 32%
PGN Progress Energy, Inc. 38.84 8.01% 14.28 2.72 2.48 6.39% 91%
VIVO Meridian Bioscience Inc.  17.35 8.23% 21.96 0.79 0.76 4.38% 96%
NWN Northwest Natural Gas Co. 44.25 8.38% 16.45 2.69 1.66 3.75% 62%
ABT Abbott Laboratories 47.20 8.63% 13.84 3.41 1.76 3.73% 52%
T AT&T Inc 25.29 9.06% 12.58 2.01 1.68 6.64% 84%
MDU MDU Resources Group Inc. 18.68 9.18% 13.34 1.40 0.63 3.37% 45%
KO Coca-Cola Co 51.65 9.47% 16.99 3.04 1.76 3.41% 58%
BDX Becton, Dickinson and Co. 69.69 9.90% 13.38 5.21 1.48 2.12% 28%
PFE Pfizer Inc 15.46 10.27% 14.31 1.08 0.72 4.66% 67%
FPL FPL Group, Inc. 50.00 10.40% 11.31 4.42 2.00 4.00% 45%
MATW Matthews International Corp.  30.96 10.57% 14.96 2.07 0.28 0.90% 14%
WTR Aqua America Inc 17.05 10.79% 21.58 0.79 0.58 3.40% 73%
BEC Beckman Coulter, Inc. 59.32 10.90% 24.82 2.39 0.72 1.21% 30%
PBI Pitney Bowes Inc   22.64 11.09% 11.79 1.92 1.46 6.45% 76%
TMP Tompkins Financial Corp. 38.59 11.39% 12.78 3.02 1.36 3.52% 45%
WGL WGL Holdings, Inc. 33.84 11.43% 14.59 2.32 1.51 4.46% 65%
XRAY DENTSPLY International Inc.  31.20 12.27% 17.05 1.83 0.20 0.64% 11%
AVP Avon Products, Inc. 28.09 12.36% 22.12 1.27 0.88 3.13% 69%
MGEE MGE Energy Inc.  35.70 12.55% 16.38 2.18 1.47 4.12% 67%
TRH Transatlantic Holdings, Inc. 46.69 12.56% 7.46 6.26 0.84 1.80% 13%
UGI UGI Corp. 26.14 12.77% 11.94 2.19 1.00 3.83% 46%
WEYS Weyco Group, Inc.  23.55 13.11% 19.15 1.23 0.64 2.72% 52%
SJW SJW Corp. 23.37 13.28% 27.17 0.86 0.68 2.91% 79%
STFC State Auto Financial Corp.  17.17 13.60% 18.46 0.93 0.60 3.49% 65%
TR Tootsie Roll Industries Inc  24.82 13.70% 26.40 0.94 0.32 1.29% 34%
BCR CR Bard, Inc. 80.07 14.22% 16.93 4.73 0.68 0.85% 14%
ATO Atmos Energy Corp. 27.88 14.22% 13.40 2.08 1.34 4.81% 64%
SBSI Southside Bancshares, Inc.  19.87 14.26% 7.47 2.66 0.68 3.42% 26%
PNY Piedmont Natural Gas Co., Inc. 25.78 14.58% 12.16 2.12 1.12 4.34% 53%
APD Air Products & Chemicals, Inc. 69.43 14.72% 17.40 3.99 1.96 2.82% 49%
SIAL Sigma-Aldrich Corp.  52.66 14.98% 17.97 2.93 0.64 1.22% 22%
PX Praxair, Inc. 77.78 15.76% 19.02 4.09 1.80 2.31% 44%
CL Colgate-Palmolive Co. 79.15 15.85% 19.35 4.09 2.12 2.68% 52%
MSEX Middlesex Water Company  15.40 17.02% 20.81 0.74 0.72 4.68% 97%
MSA Mine Safety Appliances Co 25.68 18.07% 22.53 1.14 1.00 3.89% 88%
CTAS Cintas Corp.  25.30 18.78% 23.64 1.07 0.48 1.90% 45%
MDT Medtronic, Inc. 38.13 18.90% 13.67 2.79 0.82 2.15% 29%
PAYX Paychex, Inc.  28.36 18.96% 21.48 1.32 1.24 4.37% 94%
UFPI Universal Forest Products, Inc.  33.96 19.16% 25.16 1.35 0.40 1.18% 30%
SYBT S.Y. BanCorp., Inc.  23.61 19.24% 19.51 1.21 0.68 2.88% 56%
CHRW C.H. Robinson Worldwide, Inc.  58.21 19.43% 27.20 2.14 1.00 1.72% 47%
BRC Brady Corp. 27.50 19.57% 18.21 1.51 0.70 2.55% 46%
CLX Clorox Co. 64.18 19.92% 15.10 4.25 2.20 3.43% 52%
WABC Westamerica BanCorp.  54.47 19.93% 17.29 3.15 1.44 2.64% 46%
ED Consolidated Edison, Inc.  43.13 20.14% 13.15 3.28 2.38 5.52% 73%
72 Companies


*Goldman Sachs isn't a former or current dividend achiever but we feel that it is worth watching because it's a proxy of our financial system.
Watch List Summary
The best performing stock from last week's list was Avon Products (AVP) which rose 9.2%.  The worst performing stock was Goldman Sachs (GS) which fell 4.6%.  Overall, the Dividend Achiever watch list gained 2% versus the Dow which was up 2.8%. Because our list has more than a handful of great companies, I urged investors to filter through company with maximum of 50% payout ratio. This should minimized the risk of dividend reduction. If you understand the companies history and their ability to pay dividend, payout ratio in excess of 50% may be considered.

Supervalu (SVU) is now on the top of our list. Although appear to be somewhat risky, the company have taken actions to strengthen its balance sheet. One of method was to cut the dividend. The current yield of 2.86% exceed the 2.5% yield over the past five years. Anyone interested in more research on SVU can refer to our observation on January 6, 2010 article. Nothing material has changed except the chart. Also note that after nine days of issuing an observation, the stock rose 11% and we issued a sell on January 15, 2010.

Readers should use the March 2009 low (or companies' most distress time) as a base case for investing.  Our conservative view is to embrace the worse case scenario prior to investing.  March 2009 low fits that description.  Although we use the one year (52 weeks) time frame, the past year was nothing but major bull run and anyone who bought at or near the low can be taking profit.  It's important to place these companies in your own watch list so that when opportunities arise, you can purchase them with greater margin of safety.

Email our team here.

Canadian Dividend Achievers

This list of top 8 Canadian Dividend Achievers, published by Mergent's, includes current and former Canadian Dividend Achievers and then ranking the companies based on those closest to the 52-week low. We've updated the stock symbol to connect to the Financial Post, one of Canada's top business publications.  You'll find the most complete fundamental information on these companies at the FP website.  If you know of a better resource then by all means pass it on, we'd love to spread the word about quality Canadian Dividend Achievers.

Symbol Name Price % from Low
CCO.TO CAMECO CORP $24.32 1.21%
RBA.TO RITCHIE BROS AUCTIONEERS $20.87 3.42%
IGM.TO IGM FINANCIAL INC. $39.26 4.61%
IMO.TO IMPERIAL OIL $39.80 5.43%
ESI.TO ENSIGN ENERGY SERVICES $13.05 7.05%
SU.TO SUNCOR ENERGY INC. $32.12 7.42%
SJR-B.TO SHAW COMM. CL.B $19.28 8.87%
SNC.TO SNC-LAVALIN SV $43.50 10.10%
Email our team here.

Nasdaq 100 Watch List

Below are the top ten Nasdaq 100 companies that are within 20% of the 52-week low. This list is strictly for the purpose of researching whether or not the companies have viable business models or are about to go out of business. These companies are deemed highly speculative unless otherwise noted.

Symbol Name Price P/E EPS Yield P/B % from Low
GILD Gilead Sciences, Inc. $34.71 11.13 3.12 0.00% 4.41 0.42%
SYMC Symantec Corporation $13.92 15.96 0.87 0.00% 2.56 0.58%
ERTS Electronic Arts Inc. $15.81 0 -2.08 0.00% 2 0.70%
APOL Apollo Group, Inc. $51.48 12.88 4 0.00% 5.98 0.81%
QCOM QUALCOMM $35.30 18.83 1.88 2.20% 2.89 2.27%
GENZ Genzyme $47.75 115.9 0.41 0.00% 1.76 5.20%
FISV Fiserv, Inc. $46.22 14.48 3.19 0.00% 2.33 7.13%
YHOO Yahoo! Inc. $15.00 26.93 0.56 0.00% 1.68 7.37%
ATVI Activision $10.70 45.53 0.24 1.40% 1.26 7.75%
RIMM Research In Motion $59.68 0 0 0.00% 0 9.91%
Email our team here.

Dividend Achiever Watch List

At the end of the week, our watch list contracted to 80 companies. Here is the watch list which ranks current and former Dividend Achievers that are within 20% of the 52-week low for June 4, 2010. Stocks that appear on our watch lists are not recommendations to buy.  Instead, they are the starting point for doing your research and determining the best company to buy.  Ideally, a stock that is purchased from this list is done after a considerable decline in the price and extensive due diligence.

Symbol Name Price % Yr Low P/E EPS (ttm) Div/Shr Yield Payout Ratio
VIVO Meridian Bioscience Inc.  17.18 0.06% 21.75 0.79 0.76 4.42% 96%
CWT California Water Service Group 34.67 0.38% 17.96 1.93 1.19 3.43% 62%
LLY Eli Lilly & Co. 32.37 1.09% 8.34 3.88 1.96 6.05% 51%
CTWS Connecticut Water Service, Inc.  20.30 1.15% 17.20 1.18 0.91 4.48% 77%
FFIN First Financial Bankshares, Inc.  48.54 1.42% 18.81 2.58 1.36 2.80% 53%
MON Monsanto Co. 49.02 1.79% 20.43 2.40 1.06 2.16% 44%
UMBF UMB Financial Corp.  37.00 1.82% 16.09 2.30 0.74 2.00% 32%
XOM Exxon Mobil Corp.   59.53 1.82% 13.56 4.39 1.76 2.96% 40%
FII Federated Investors Inc 21.80 1.96% 11.12 1.96 0.96 4.40% 49%
DNB Dun & Bradstreet Corp. 70.49 2.01% 14.13 4.99 1.40 1.99% 28%
NJR New Jersey Resources Corp. 34.32 2.48% 15.53 2.21 1.36 3.96% 62%
ADM Archer Daniels Midland Co. 24.83 2.50% 10.22 2.43 0.60 2.42% 25%
AVP Avon Products, Inc. 25.73 2.92% 20.26 1.27 0.88 3.42% 69%
AROW Arrow Financial Corp.  24.35 3.00% 13.02 1.87 1.00 4.11% 53%
SHEN Shenandoah Telecom Co. 16.13 3.66% 14.66 1.10 0.32 1.98% 29%
VVC Vectren Corp. 22.52 3.97% 14.82 1.52 1.36 6.04% 89%
T AT&T Inc 24.17 4.23% 12.02 2.01 1.68 6.95% 84%
FRS Frisch's Restaurants, Inc 20.78 4.37% 10.49 1.98 0.52 2.50% 26%
SVU SUPERVALU INC 12.68 4.53% 6.85 1.85 0.35 2.76% 19%
NTRS Northern Trust Corp.  49.01 4.91% 15.41 3.18 1.12 2.29% 35%
HSC Harsco Corp. 25.88 4.95% 19.31 1.34 0.82 3.17% 61%
NWN Northwest Natural Gas Co. 42.96 5.22% 15.97 2.69 1.66 3.86% 62%
THFF First Financial Corp. Indiana  26.71 5.45% 14.68 1.82 0.92 3.44% 51%
MDU MDU Resources Group Inc. 18.08 5.67% 12.91 1.40 0.63 3.48% 45%
HRB H&R Block, Inc. 15.73 5.71% 10.70 1.47 0.60 3.81% 41%
PFE Pfizer Inc 14.76 5.85% 13.67 1.08 0.72 4.88% 67%
AWR American States Water Co. 33.05 5.93% 18.46 1.79 1.04 3.15% 58%
GS* Goldman Sachs Group, Inc.   142.25 6.00% 5.92 24.01 1.40 0.98% 6%
BEC Beckman Coulter, Inc. 56.29 6.15% 23.55 2.39 0.72 1.28% 30%
JNJ Johnson & Johnson   58.01 6.36% 12.19 4.76 2.16 3.72% 45%
HCC HCC Insurance Holdings, Inc. 24.70 6.37% 8.23 3.00 0.54 2.19% 18%
SFNC Simmons First National Corp.  26.07 6.41% 15.90 1.64 0.76 2.92% 46%
WMT Wal-Mart Stores, Inc. 50.40 6.44% 13.23 3.81 1.21 2.40% 32%
ABT Abbott Laboratories 46.53 7.09% 13.65 3.41 1.76 3.78% 52%
FPL FPL Group, Inc. 48.63 7.37% 11.00 4.42 2.00 4.11% 45%
PGN Progress Energy, Inc. 37.67 7.54% 13.85 2.72 2.48 6.58% 91%
PBI Pitney Bowes Inc   21.98 7.85% 11.45 1.92 1.46 6.64% 76%
KO Coca-Cola Co 51.27 8.67% 16.87 3.04 1.76 3.43% 58%
WGL WGL Holdings, Inc. 33.06 8.86% 14.25 2.32 1.51 4.57% 65%
ATO Atmos Energy Corp. 26.50 9.14% 12.74 2.08 1.34 5.06% 64%
WEYS Weyco Group, Inc.  22.75 9.27% 18.50 1.23 0.64 2.81% 52%
MGEE MGE Energy Inc.  34.25 9.74% 15.71 2.18 1.47 4.29% 67%
APD Air Products & Chemicals, Inc. 66.55 9.96% 16.68 3.99 1.96 2.95% 49%
WTR Aqua America Inc 16.93 10.01% 21.43 0.79 0.58 3.43% 73%
UGI UGI Corp. 25.51 10.05% 11.65 2.19 1.00 3.92% 46%
TMP Tompkins Financial Corp. 38.17 10.17% 12.64 3.02 1.36 3.56% 45%
PX Praxair, Inc. 74.12 10.31% 18.12 4.09 1.80 2.43% 44%
BDX Becton, Dickinson and Co. 70.08 10.52% 13.45 5.21 1.48 2.11% 28%
WAG Walgreen Co. 30.84 10.58% 14.48 2.13 0.55 1.78% 26%
SIAL Sigma-Aldrich Corp.  50.69 10.67% 17.30 2.93 0.64 1.26% 22%
STFC State Auto Financial Corp.  16.76 10.92% 18.02 0.93 0.60 3.58% 65%
SBSI Southside Bancshares, Inc.  19.31 11.04% 7.26 2.66 0.68 3.52% 26%
PNY Piedmont Natural Gas Co., Inc. 25.01 11.16% 11.80 2.12 1.12 4.48% 53%
MATW Matthews International Corp.  31.36 11.99% 15.15 2.07 0.28 0.89% 14%
TR Tootsie Roll Industries Inc  24.50 12.23% 26.06 0.94 0.32 1.31% 34%
BCR CR Bard, Inc. 78.97 12.65% 16.70 4.73 0.68 0.86% 14%
CL Colgate-Palmolive Co. 77.24 13.06% 18.89 4.09 2.12 2.74% 52%
XRAY DENTSPLY International Inc.  31.46 13.19% 17.19 1.83 0.20 0.64% 11%
TRH Transatlantic Holdings, Inc. 45.33 13.33% 7.24 6.26 0.84 1.85% 13%
SJW SJW Corp. 23.52 14.01% 27.35 0.86 0.68 2.89% 79%
CHRW C.H. Robinson Worldwide, Inc.  55.90 14.68% 26.12 2.14 1.00 1.79% 47%
MHP McGraw-Hill Cos., Inc. 27.34 16.09% 11.16 2.45 0.94 3.44% 38%
SYBT S.Y. BanCorp., Inc.  23.03 16.31% 19.03 1.21 0.68 2.95% 56%
CVX Chevron Corp. 71.28 17.08% 10.82 6.59 2.88 4.04% 44%
PAYX Paychex, Inc.  27.97 17.32% 21.19 1.32 1.24 4.43% 94%
CTAS Cintas Corp.  25.01 17.42% 23.37 1.07 0.48 1.92% 45%
CTBI Community Trust BanCorp., Inc.  26.05 17.61% 15.60 1.67 1.20 4.61% 72%
PEP PepsiCo Inc. 61.44 17.90% 15.59 3.94 1.92 3.13% 49%
ED Consolidated Edison, Inc.  41.66 17.92% 12.70 3.28 2.38 5.71% 73%
WABC Westamerica BanCorp.  53.63 18.08% 17.03 3.15 1.44 2.69% 46%
BANF BancFirst Corp.  37.17 18.11% 16.67 2.23 0.92 2.48% 41%
MDT Medtronic, Inc. 38.00 18.49% 13.62 2.79 0.82 2.16% 29%
KMB Kimberly-Clark Corp. 60.18 19.36% 13.49 4.46 2.64 4.39% 59%
BMS Bemis Co Inc 27.95 19.39% 21.50 1.30 0.92 3.29% 71%
HGIC Harleysville Group Inc.  31.20 19.59% 11.35 2.75 1.30 4.17% 47%
BMI Badger Meter, Inc. 39.04 19.83% 17.99 2.17 0.48 1.23% 22%
BRC Brady Corp. 27.66 20.26% 18.32 1.51 0.70 2.53% 46%
CFR Cullen/Frost Bankers, Inc. 52.42 20.26% 17.30 3.03 1.80 3.43% 59%
HRL Hormel Foods Corp. 40.50 20.39% 14.84 2.73 0.84 2.07% 31%
CLX Clorox Co. 63.07 20.41% 14.84 4.25 2.20 3.49% 52%
80 Companies


*Goldman Sachs isn't a former or current dividend achiever but we feel that it is worth watching because it's a proxy of our financial system.

Watch List Summary

The best performing stock from last week's list was Hormel (HSC) which rose 1.8%.  The worst performing stock was State Auto Financial (STFC) which fell 7.3%.  Overall, the Dividend Achiever watch list lost 2.6% versus the Dow which was down only 1.8%. Because our list has more than a handful of great companies, I urged investors to filter through company with maximum of 50% payout ratio. This should minimized the risk of dividend reduction. If you understand the companies history and their ability to pay dividend, payout ratio in excess of 50% may be considered.

Readers should use the March 2009 low (or companies' most distress time) as a base case for investing.  Our conservative view is to embrace the worse case scenario prior to investing.  March 2009 low fits that description.  Although we use the one year (52 weeks) time frame, the past year was nothing but major bull run and anyone who bought at or near the low can be taking profit.  It's important to place these companies in your own watch list so that when opportunities arise, you can purchase them with greater margin of safety.

Email our team here.

It’s a Matter of Economics, Cree is Overpriced

A stock that we’ve been watching closely is Cree Incorporated (CREE) which is a U.S. based developer and manufacturer of light emitting diode [LED] products and other types of compound semiconductors. We've been following this stock since the price was in the mid-$40 range and the P/E was in excess of 50.

CREE recently touched a high of $83 and has pulled back to the $70 range. The P/E ratio has expanded to 60 with the expectation that earning will rise 154% in 2010 (from average estimates on 6/3/10 by $0.66 to $1.68) and followed by a rise of 37% that is expected in 2011 (from $1.68 to $2.30). On a forward earnings basis, stock looks reasonably price at 30 times next year earnings. The caveat here is that it is based on next year earnings.

Competitors
Today’s article from The Wall Street Journal titled "LED's Bright Prospects Could Dim", reaffirmed our thinking of what was the hot company / market in 2009 could become the cold one in the not too distant future. Currently, CREE has a healthy operating margin of 19.7% while the industry's margin sits at around 8.22%. The key is question is, will CREE be able to protect its competitor from creeping into its margins? Our answer to that is, it is only a matter of time before competitors start crowding into the market in pursuit of the healthy margins. Some of competitors are Lumileds (Philips), Sharp, Nichia, Toyoda Gosei, Taiwan Semiconductor  (TSM), and many smaller companies in China.

More Clues From Equipment Supplier

The talk of competition is where things get pretty interesting. Seeing the fat margins that are ripe for the picking, Kulicke & Soffa (KLIC) ), a $500 million market cap company that sells assembly equipment seems to be getting in the game. KLIC is one of the largest companies in their market. What's important is KLIC serves as a leading indicator for the chip industry, LED included. KLIC’s most recent earnings report provided great insight into the state of their backlog. Increasing backlog is an important indicator because it typically leads to excess inventory. Increased inventory leads to a possible contraction of profit margins.

Below is the breakdown of the current and historical backlog for KLIC:

  • 2010 - $132,000
  • 2009 - $15,000
  • 2008 - $73,000
  • 2007 - $59,000
  • 2006 - $60,000
  • 2005 - $62,000

If you take the average of the last six years, the backlog is $66,833. Taking the average of 2005 - 2008 (excluding the extremes), we get $63,500. In both cases, the recent surge to $132,000 is extraordinary. This is caused by KLIC trying to rebuild inventory after depleting it during the credit crisis. Adjusting for the extreme situation, our calculations show that the backlog in 2010 is up by 97.5% from the average of the last 6 years and 108% above the average excluding the extremes.

Additionally, Kulike & Soffa isn't your typical LED equipment supplier as noted by the CEO:

The other point I guess I'd make is that in the 2007-2008 peak we had no LED business. So the LED business is all incremental to that.

This tells us that LED makers are going the last mile to make LEDs. Kulicke & Soffa is also expanding their product offerings so we could be completely wrong in that respect. Regardless, the capacity build up is real. Here's another statement from the CEO from the conference call:

When I look at how we've got bonders allocated in the current quarter and into the future, we're seeing a big spike in LED bonders above those levels. So there is a lot of good things happening in terms of stories. And the other thing about the LED again is that that seems more like a secular story than a cyclical story; it should have longer legs to it.

The bullish tone is great for Kulicke & Soffa but doesn't bode well for CREE.

Technical Picture

The chart below is a weekly chart containing P/E ratio and rolling earnings of CREE going back to 1999. The tech bubble in 2000 carried the stock above $100 mark and P/E ratio well above 200.  The stock has been stuck in a trading range of $15 and $30 for most of the decade.

The important part is that earnings haven't improved materially over the intervening period. Current earnings of $1 is still below the 2005 mark but the price has moved well out of proportion to the historical norm. If the stock can get above $105 with good support from earnings, then the stock is off to the race on the upside. Although we can't imagine anymore upside without calling it a bubble based on the chart.

Bottom Line
We think CREE is overpriced and we point it out not as a short selling opportunity but as an observation. CREE has the tone of a growth stock with expanding multiples (P/E) coming to an end. Some of what we have explained above may be more complicated than it needs to be. If so, a simple way to look at it is that CREE trades at more than 60 times its current earnings, very expensive by any standard. They will probably face more competition in the coming years if not months. As a result, profit margins should diminish. This will eventually lead to lower earnings that will likely lead to (all things being equal) a drastic decline in the stock price.

Sources:
LED's Bright Prospects Could Dim
Kulicke & Soffa 2Q10 Press Release
Cree's Competitors
Kulicke & Soffa Industries, Inc. F2Q10 (Qtr End 04/03/10) Earnings Call Transcript

Email our team here.