
Members
-
Topics
Archives
-
-
Recent Posts
-
-
-
Investor Education
Market Return After Exceptional Years
Dollar Cost Averaging Tool
Dow Theory: The Formation of a Line
Dividend Capture Strategy Analysis
Golden Cross – How Golden Is It?
Debunked – Death Cross
Work Smart, Not Hard
Charles H. Dow, Father of Value Investing
It's All About the Dividends
Dow Theory: Buying in Scales
How to Avoid Losses
When Dividends are Canceled
Cyclical and Secular Markets
Inflation Proof Myth
What is Fair Value?
Issues with P-E Ratios
Beware of Gold Dividends
Gold Standard Myth
Lagging Gold Stocks?
No Sophisticated Investors
Dollar down, Gold up?
Problems with Market Share
Aim for Annualized Returns
Anatomy of Bear Market Trade
Don’t Use Stop Orders
How to Value Earnings
Low Yields, Big Gains
Set Limits, Gain More
Ex-Dividend Dates -
-
Historical Data
1290-1950: Price Index
1670-2012: Inflation Rate
1790-1947: Wholesale Price Cycle
1795-1973: Real Estate Cycle
1800-1965: U.S. Yields
1834-1928: U.S. Stock Index
1835-2019: Booms and Busts
1846-1895: Gold/Silver Value
1853-2019: Recession/Depression Index
1860-1907: Most Active Stock Average
1870-2033: Real Estate Cycles
1871-2020: Market Dividend Yield
1875-1940: St. Louis Rents
1876-1934: Credit-New Dwellings
1896-1925: Inflation-Stocks
1897-2019: Sentiment Index
1900-1903: Dow Theory
1900-1923: Cigars and Cigarettes
1900-2019: Silver/Dow Ratio
1901-2019: YoY DJIA
1903-1907: Dow Theory
1906-1932: Barron's Averages
1907-1910: Dow Theory
1910-1913: Dow Theory
1910-1936: U.S. Real Estate
1910-2016: Union Pacific Corp.
1914-2012: Fed/GDP Ratio
1919-1934: Barron's Industrial Production
1920-1940: Homestake Mining
1921-1939: US Realty
1922-1930: Discount Rate
1924-2001: Gold/Silver Stocks
1927-1937: Borden Co.
1927-1937: National Dairy Products
1927-1937: Union Carbide
1928-1943: Discount Rate
1929-1937: Monsanto Co.
1937-1969: Intelligent Investor
1939-1965: Utility Stocks v. Interest Rates
1941-1967: Texas Pacific Land
1947-1970: Inventory-Sales Ratio
1948-2019: Profits v. DJIA
1949-1970: Dow 600? SRL
1958-1976: Gold Expert
1963-1977: Farmland Values
1971-2018: Nasdaq v. Gold
1971-1974: REIT Crash
1972-1979: REIT Index Crash
1986-2018: Hang Seng Index Cycles
1986-2019: Crude Oil Cycles
1999-2017: Cell Phone Market Share
2008: Transaction History
2010-2021: Bitcoin Cycles -
Interesting Read
Inside a Moneymaking Machine Like No Other
The Fuzzy, Insane Math That's Creating So Many Billion-Dollar Tech Companies
Berkshire Hathaway Shareholder Letters
Forex Investors May Face $1 Billion Loss as Trade Site Vanishes
Why the oil price is falling
How a $600 Million Hedge Fund Disappeared
Hedge Fund Manager Who Remembers 1998 Rout Says Prepare for Pain
Swiss National Bank Starts Negative
Tice: Crash is Coming...Although
More on Edson Gould (PDF)
Schiller's CAPE ratio is wrong
Double-Digit Inflation in the 1970s (PDF)
401k Crisis
Quick Link Archive
Category Archives: XAU
Gold Stocks Near New Low
This is the list of gold related equities that we track within 10% of the one year low. We strongly recommend that you do your own research on these companies and assume that the downside risk is half of the current price, at minimum.
Upside Targets for Individual Gold Stocks
We’ve come to the time when we need to determine the upside targets for gold stocks. There are a few assumption that we’re making in this assessment. First, we believe that our Gold Stock Indicator is right about the direction of gold stocks, in general. Second, we’re assuming that from the current levels there is more downside risk. Third, we have excluded fundamental analysis (government printing, future earnings capacity, gold as money, etc.) from our assessment of the upside potential for individual gold stocks.
Posted in Edson Gould, gold, gold bugs, Gold Stock Indicator, HUI, Performance Review, speed resistance line, SRL, upside target, XAU
Tagged members
Gold Stock Indicator
We rely heavily on our Gold Stock Indicator for signs of when to buy gold stocks. The reason for this is because we found the alternatives, the Gold/XAU and XAU/Gold ratios, to be highly deficient. These two ratios were thought to be the bedrock of indications on when to buy and sell gold stocks. According to well known analyst John Hussman, the Gold/XAU ratio has the following indications:
Gold Stock Indicator: The Big Picture
Article Summary
-
Start accumulating gold stocks now
-
select gold stocks from those in the XAU Index
-
at minimum, investors must allow for 25% downside risk before reinvesting more funds
Our Take
On November 2, 2011, we posted an article which highlighted the fact that gold stocks routinely underperform the price of gold (found here). Also in that article, we introduced our Gold Stock Indicator to show that the timing of when to buy gold stocks was more important than the fact that prices and valuations appear to be low.
To demonstrate the significance of our indicator, we’d like to contrast it to the widely used Gold/XAU ratio. According to noted market commentator and fund manager John Hussman:
“…since 1974, the Gold/XAU ratio has been greater than 5.0 about 15% of the time. When the ratio has been this high, the XAU has followed with annualized gains of 89.6%, on average.” (Hussman, John. “Gold/XAU Ratio Signals Buy for Gold Stocks”. Seeking Alpha. March 13, 2007.)
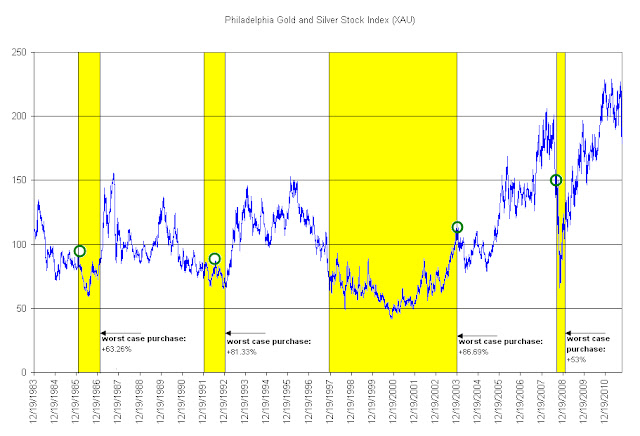
Below is a chart of the Gold/XAU ratio since December 12, 1983:

Unfortunately, as gold has transitioned to a secular bull market cycle, the Gold/XAU ratio since 1999 has not provided a consistent signal of when to buy and sell gold stocks. In fact, on July 15, 2008, the Gold/XAU ratio indicated that gold stocks should be bought even as the XAU Index was about to fall an additional –66%.
Also popular among gold investors is the inverse chart of the same ratio known as the XAU/Gold ratio or gold stock/gold ratio. Many variations of these ratios are carelessly used by market commentators with the hope to prove that gold stocks should be acquired. So far, the Gold/XAU ratio has incorrectly indicated that gold stocks are a “buy” for the past 998 trading days in a row. Few who make reference to these ratios are willing to show the full history of these gold and gold stock ratios. In all cases, the ratio is the same and since July 15, 2008 has failed to steer gold stock investors away from significant loses in gold stocks.
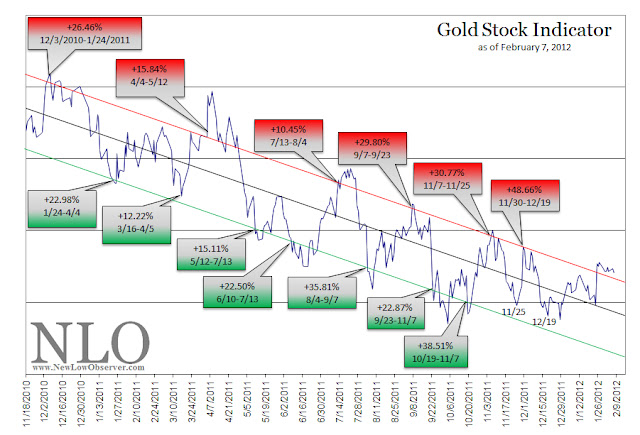
In stark contrast, our Gold Stock Indicator had been able to consistently identify long-term opportunities of when to buy and sell gold stocks. Below is the most updated version of our Gold Stock Indicator:

At the current level, our indicator suggests that gold stocks should be accumulated. The last time that gold stocks were at the exact same level, gold and gold stocks posted the following returns:
| Year(s) | Gold | XAU |
| 1986-1987 | 22.35% | 84.11% |
| 1987-1989 | -4.81% | 52.87% |
| 1992-1993 | 11.03% | 66.44% |
| 1997-2006 | 83.00% | 113.54% |
| 2008-2010 | 64.14% | 99.95% |
| Average gain/loss | 35.14% | 83.38% |
While we recommend accumulating gold stocks at this time, it is important to understand and accept the possible downside risks. Below is the percentage loss that was experienced after each indication to buy gold stocks and before any gains were realized:
| 1986 | -16.57% |
| 1992 | -5.92% |
| 1997 | -34.54% |
| 2008 | -40.81% |
| Average Decline | -24.46% |
The 1987-1989 period was excluded from our downside risk data simply because it did not have any loss before moving to the sell indication. If we included the decline after the 1987 buy signal the average loss would have been –19.57% for all five buy signals since 1983. However, we’d like to opt for the more conservative figure of –24.46% to keep our expectation more realistic.
Those who wish to participate in the eventual run up in gold stocks should consider those that are a part of the XAU index. The members of the XAU index are ranked below based on the percentage from the 52-week low:
| Symbol | Name | price | P/E | EPS | Yield | Price/Book | % from Low | % of Index |
| NEM | Newmont Mining Corp. | $45.06 | 97.31 | 0.46 | 3.1 | 1.72 | 5.12% | 10.90% |
| BVN | Buenaventura SA | $36.89 | 11.17 | 3.31 | 2.1 | 2.88 | 5.45% | 4.60% |
| ABX | Barrick Gold Corporation | $33.17 | 8.11 | 4.1 | 2.5 | 1.34 | 7.26% | 16.00% |
| GFI | Gold Fields Ltd. | $13.09 | 9.72 | 1.34 | 4.6 | 1.66 | 11.70% | 4.70% |
| AU | AngloGold Ashanti Ltd. | $34.55 | 894.90 | 0.04 | 1.2 | 240.61 | 12.61% | 6.60% |
| PAAS | Pan American Silver Corp. | $15.18 | 5.19 | 2.93 | 1 | 0.82 | 12.68% | 0.70% |
| GG | Goldcorp Inc. | $36.70 | 22.94 | 1.6 | 1.5 | 1.36 | 16.30% | 14.50% |
| HMY | Harmony Gold Mining Co. Ltd. | $10.07 | 14.30 | 0.71 | 1 | 1.08 | 17.00% | 2.20% |
| FCX | Freeport-McMoRan | $34.01 | 10.19 | 3.33 | 3.7 | 1.95 | 17.63% | 15.70% |
| KGC | Kinross Gold Corporation | $8.59 | 0.00 | -1.96 | 1.9 | 0.78 | 20.60% | 3.40% |
| AUY | Yamana Gold, Inc. | $15.17 | 19.86 | 0.76 | 1.4 | 1.49 | 23.00% | 5.60% |
| SLW | Silver Wheaton Corp. | $28.27 | 17.48 | 1.62 | 1.3 | 3.59 | 23.45% | 4.80% |
| GOLD | Randgold Resources Ltd. | $91.18 | 19.84 | 4.6 | 0.4 | 3.68 | 25.11% | 4.10% |
| SSRI | Silver Standard Resources Inc. | $13.07 | 15.24 | 0.86 | 0 | 1.06 | 30.02% | 0.50% |
| RGLD | Royal Gold, Inc. | $76.63 | 46.43 | 1.65 | 0.8 | 2.57 | 34.40% | 2.20% |
| AEM | Agnico-Eagle Mines Ltd. | $44.16 | 0.00 | -3.3 | 1.9 | 2.31 | 40.80% | 3.60% |
In theory, the stocks that have the largest weighting in the index contribute the most movement either up or down. However, this may not result in the largest percentage gains that are possible as compared to other stocks in the XAU index. We prefer those stocks that are nearest the low, so we’d opt for NEM, ABX and GG ahead of FCX, BVN and GFI.
Gold stocks that are a part of the XAU index have the benefit of institutional support and the risk of individual implosions. Also, as we’ve explained in our article titled “Why Gold Stocks Will Decline More Than the Markets,” gold stocks are tied strongly to the performance of the general stock market. This was graphically demonstrated in 2008 when gold stocks declined –68% in the period from March 14th to October 27th. Many claim that 2008 was an aberration, our analysis of gold stocks from the 1924 to the present clearly indicates that 2008 was not a fluke. Keep in mind that a –68% decline in the stock index means that individual stocks within the index likely fell much lower, on a percentage basis.
Investors should take their time in acquiring gold stocks as there is some downside risk. However, if 10%-15% of the portfolio is set aside for such investing, there are good opportunities if the purchases are done in stages.
Posted in gold, Gold Stock Indicator, XAU
Market Outlook: Mixed Signals
On February 7, 2012, we wrote an article on the topic of gold titled “Gold Stock Indicator Points Down” (found here). In that article, the very last sentence said the following:
“based on the current trajectory, we have May/June 2012 as our tentative reversal period.”
Well, the month of May has passed and we’ve seen an amazing plunge in gold stocks since the posting of our February 7th article, as reflected in the chart below:

Since February 7, 2012, the XAU gold stock index declined -28.95% to the May 15th low. As we had anticipated, the “May/June” bottom was reached, for now. Ordinarily, this would be the time to buy gold stocks, especially those that pay a dividend. However, in our May 27th transaction review of NUGT (found here), we said that, based on our Gold Stock Indicator, there would be a second opportunity to buy gold stocks at a considerable value.
The recovery in the XAU index has been even more spectacular than the plunge. Historically, such rapid increases in a stock or index would require a decline of at least -50% of the most recent rise, even if the trend is still higher. Therefore, based on the most recent price of 168.71 in the XAU index, there should be a decline to the 154.56 level or half of whichever the most recent peak might be. We’d consider buying dividend paying gold stocks at half of the highest point achieved or lower. (Please, if you have any questions about this paragraph we’d be more than glad to explain further if we were not clear in any way.)
For now, the direction for gold stocks is up based on our Gold Stock Indicator, until proven otherwise. However, at the same time the Gold Stock Indicator is pointing up, we have a Dow Theory bear market indication as outlined in our May 19th article (found here) suggesting that stocks in general are supposed to decline. Our vast amount of research on the topic suggests that if the general stock market were to have a decline of 10%-15% or more, then gold stocks would decline by a greater percentage. As an example, in 2008, when the general stock market declined –37% as reflected in the S&P 500 (full year decline), the XAU gold stock index declined -66% within the period from March 2008 to October 2008.
We don’t know which indication will take precedence. Therefore, we are opting for the most conservative stance possible. We’re waiting for the stock market to confirm the Dow Theory bear market indication or quickly come up with a bull market indication. We’re holding out for the possibility that gold stocks will provide the second opportunity to buy as has been indicated in our May 27th transaction review.
Questions or thoughts? Let us know, we’ll do our best to provided a thoughtful response.
Posted in Dow Theory, Gold Stock Indicator, XAU
Gold Stock Indicator Points Down
Posted in gold, Gold Stock Indicator, XAU
A Strategy is Needed for Lagging Gold Stocks
For gold stock investors, a timing strategy is the most effective way to match or beat the coming metal price increase. Among our caveats, we’re excluding junior and exploration mining companies which will either go out of business, experience share price booms or get acquired by peers or the majors. What follows is our examination of whether the lagging gold stocks, the inability of gold stocks to perform equal to or greater than the price of physical metal, is unique to our time or a fundamental hallmark of gold bull markets.
There is considerable discussion about the divergence between the price of gold and gold stocks. In the divergence, the price of gold has tended to rise to new highs while gold stocks (majors) either trade in a range, decline or increase at a tepid rate compared to the physical metal.
Some argue that due to the divergence, gold stocks represent the best investment opportunity because inevitably, the stocks will catch up with the metal. Others say that, the lack of confirmation of gold stocks to exceed prior highs is an indication that the metal is overvalued or needs to decline.
Unfortunately, although both points seem well reasoned (along with many other explanations), evidence from the previous gold bull market suggests that gold mining majors typically underperform the metal. The primary source that we’re drawing from is Richard Russell’s Dow Theory Letters from 1970 to 1979 with data points confirmed in Barron’s and Kitco.com for the respective dates.
On numerous occasions, Richard Russell would express his concern for the divergence between the price of gold and gold stocks. Below are Russell’s observations of the failure of gold stocks to follow the price of gold higher:
“Meanwhile, despite the recent highs in the price of gold bullion, the gold stocks are not keeping up with the price of the yellow metal. I have received many calls from subscribers asking why.” (Richard Russell, Dow Theory Letters, May 17, 1972, Letter 529, page 6.)
“The general feeling seems to be that the gold stocks have been discounting [falling in advance of] a decline in bullion.” (Richard Russell, Dow Theory Letters, September 27, 1974, Letter 610, page 6.)
“‘What’s happening to the shares’ I am asked. ‘Why don’t they move with gold?’” (Richard Russell, Dow Theory Letters, January 2, 1975, Letter 618, page 5.
“At the bottom of the chart is the Barron’s Gold Average (stocks). This may move, too, but this Average has a long way to go to hit its 1974 high while gold could better the old 200 high easily. That should tell us something. And it’s the reason I’ve been saying all along-gold, not gold stocks.” (Richard Russell, Dow Theory Letters, November 9, 1977, Letter 713, page 5.)
“Since Barron’s Average is very heavily weighted in favor of ASA, we are looking to a large extent at the relative performance of the S. African gold shares against bullion. The picture is clear enough. The market, since mid-1974. has preferred bullion to the gold shares. And who am I to argue with the market? That’s the reason I’ve been recommending gold, not the shares.” (Richard Russell, Dow Theory Letters, February 17, 1978, Letter 722, page 6.)
“Since late-January the gold stocks have been reactionary whereas gold has been hitting new 1977-78 highs. In March both stocks and the metal declined, and as you can see the stocks broke below their February lows. Yet the metal has not confirmed on the downside, holding well above its February low. I take this non-confirmation as a bullish indication. I think it is telling us that the metal will not respond to gold share weakness, and it is telling us that the metal ‘wants’ to go to new highs. Whether the stocks will follow is another story.” (Richard Russell, Dow Theory Letters, April 5, 1978, Letter 726, page 6.)
“My chart of gold and the gold averages (see page 6) is now showing a dramatic divergence. The gold stock average has broke” below its November low, but the bullion price has held well above that point.” (Richard Russell, Dow Theory Letters, May 5, 1978, Letter 729, page 5.)
“This non-confirmation between gold and the gold stock average which I discussed in the last Letter is still in force. Many feared that the reactionary tendencies [decline] in the gold shares were calling for a correction in gold. For this reason many advisors have been telling their clients to sell their gold or even short gold. The consequences have been unhappy for the sellers, disastrous for the shorts.” (Richard Russell, Dow Theory Letters, November 1, 1978, Letter 742, page 5.)
“My chart of gold bullion (daily) and the Gold Stock Average (GSA) documents the extraordinary divergence which continues to build between gold and GSA. Why did gold and GSA rally in tandem up to the October highs and why are the gold shares so
reluctant now?” (Richard Russell, Dow Theory Letters, February 28, 1979, Letter 751, page 7.
“My chart of daily gold and the gold stock average (GSA) continues to picture divergence, with Campbell Red Lake and ASA stubbornly refusing to move back to their October highs.” (Richard Russell, Dow Theory Letters, July 5, 1979, Letter 760, page 6.)
“I obviously cannot tell at this time whether gold is going to surge above 307 to a new high- or whether gold is in the process of topping out. The gold stocks have been weak, and my gold stock average has broken below the three minor bottoms. But so far, even weakness in the gold shares has not rubbed off on the metal.” (Richard Russell, Dow Theory Letters, August 15, 1979, Letter 763, page 6.)
To add to the consternation of gold stock investors, the period after the peak in the price of gold in January 1980 showed gold stocks held up better than the metal. This threw off “seasoned” gold investors because it gave the false impression that gold’s collapse would recover somehow. The following is Russell’s comments on this matter after the peak:
“The gold stocks did not act during the 1980 decline the way they did during the 1974 debacle. This time they tended to hold very well. Now they are looking bullish (despite the many troubles, the increasing troubles in So. Africa). The shares, in other words, show good relative strength against the metal. This is a good sign for gold in general.” (Richard Russell, Dow Theory Letters, June 4, 1980, Letter 784, page 5.)
Although gold stocks are a leveraged play on the price of gold, there are critical points in time when gold stocks should be bought and then sold in order to take advantage of the leveraged characteristics. Those who buy and hold gold stocks for the “long term” will be disappointed with the performance as compared to the price of gold. Therefore, it is necessary to have a timing indicator that will highlight the best times to invest in gold stocks.
Below we have constructed a gold stock indicator based on the Philadelphia Gold and Silver Stock Index (XAU) which reveals the best times to accumulate and dispose of gold stocks. The points above the red line indicates the time to sell gold stocks and the points below the green line indicate when to buy gold stocks. We’ve taken the liberty of considering a sell indication whenever the indicator first reaches the red zone on a move to the upside and a buy/accumulate when the indicator first falls to the green line on a move to the downside.

On average, sell indications occurred after a +52% increase in the XAU index. This does not account for the individual performance of gold stocks that are constituents of the index. The consistency of our Gold Stock Indicator reflected the best times to acquire the major gold stocks as well as the most ideal times to sell the gold stocks.
On the chart of the Philadelphia Gold and Silver Stock Index (XAU) above, we have shown where the indicated “buy/accumulate” recommendations would have taken place in yellow. The green circles show what would have happened if the purchase occurred at the worst possible time in the given period and is measured to the respective peaks in the XAU index soon after. As mentioned in many prior articles, we always account for at least -50% downside risk with any investment position that we take. This appears to be a minimum requirement when applying our indicator to the purchase of constituents of the Philadelphia Gold and Silver Stock Index (XAU).
For an investor who wishes to accumulate gold shares from within the XAU index, they would benefit from well timed purchases rather than getting whip-sawed by a wildly gyrating index that will inevitably underperform the price of gold in the “long-term.” We have identified the top five stocks that are likely to outperform the XAU index when the next buy signal is given. The five companies are AngloGold (AU), Yamana Gold (AUY), Gold Fields (GFI), Randgold (GOLD) and Royal Gold (RGLD).
The obvious alternative to buying gold stocks is with the physical asset. The paper version of gold is the SPDR Gold Shares (GLD). Although not truly tested through a full gold bull and bear cycle, GLD remains the among the most popular ways to “invest” in the physical asset. Our preference is for the non-paperized version of gold in the form of one-ounce coins.
As has been demonstrated in the gold bull market from 1970 to 1980, gold stocks (the majors) will generally underperform the price of gold. Those who are bound and determined to buy gold stocks can pursue the juniors and explorers which provide a wide range of outcomes that are independent of the price of gold (but helped by the rising value of gold) based on new discoveries, getting acquired or going bust. The alternative, buying the majors, should be done with a well constructed strategy that does not rely on hold-and-hope.
Comments Off on A Strategy is Needed for Lagging Gold Stocks
Posted in gold, Gold Stock Indicator, Richard Russell, Richard Russell Review, XAU
Netflix and Speed Resistance Lines
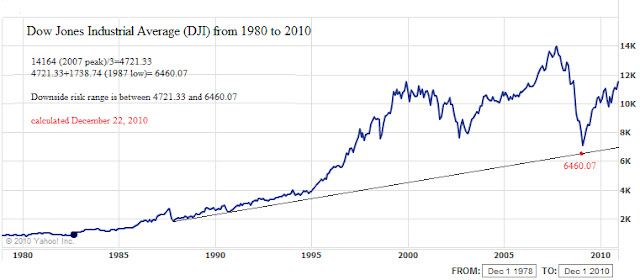
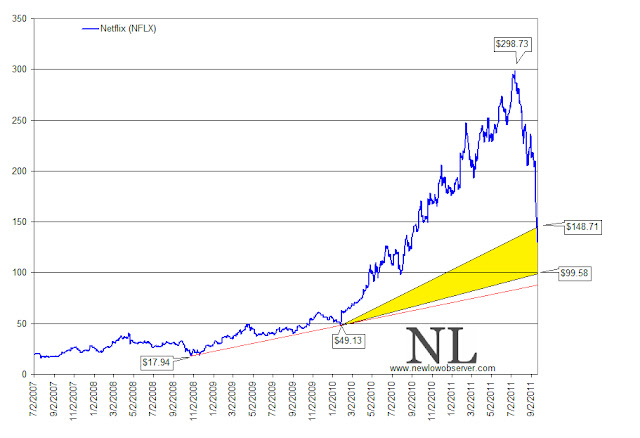
“Resistance lines decline or ascend at one-third or two-thirds the rates of actual declines and advances between significant bottoms and tops. Resistance to advance or decline is frequently encountered at such trendlines; however, if the resistance line is decisively penetrated, the price-action often tends to accelerate in the direction of the penetration.”

Comments Off on Netflix and Speed Resistance Lines
Posted in Edson Gould, Netflix, speed resistance line, William X. Scheinman, XAU