Below are the 50 companies on our U.S. Dividend Watch List that are within 11% of their respective 52-week lows. Stocks that appear on our watch lists are not recommendations to buy. Instead, they are the starting point for doing your research and determining the best company to buy. Ideally, a stock that is purchased from this list is done after a considerable decline in the price and rigorous due diligence.
| Symbol |
Name |
Price |
% Yr Low |
P/E |
EPS (ttm) |
Dividend |
Yield |
Payout Ratio |
| INTC |
Intel Corp. |
21.48 |
0.38% |
9.10 |
2.36 |
0.90 |
4.19% |
38% |
| ABM |
ABM Industries, Inc. |
18.12 |
1.51% |
18.68 |
0.97 |
0.58 |
3.20% |
60% |
| EXPD |
Expeditors International |
34.78 |
1.70% |
20.70 |
1.68 |
0.56 |
1.61% |
33% |
| IBKC |
IBERIABANK Corp. |
45.25 |
1.78% |
20.38 |
2.22 |
1.36 |
3.01% |
61% |
| CLC |
Clarcor Inc. |
44.69 |
2.92% |
18.39 |
2.43 |
0.54 |
1.21% |
22% |
| ERIE |
Erie Indemnity Company |
63.20 |
3.39% |
22.49 |
2.81 |
2.21 |
3.50% |
79% |
| WGL |
WGL Holdings, Inc. |
39.09 |
3.82% |
19.84 |
1.97 |
1.60 |
4.09% |
81% |
| JW-A |
John Wiley & Sons Inc. CL 'A' |
45.06 |
4.21% |
13.86 |
3.25 |
0.80 |
1.78% |
25% |
| MATW |
Matthews International Corp. |
29.13 |
4.48% |
13.12 |
2.22 |
0.36 |
1.24% |
16% |
| ETP |
Energy Transfer Partners L P |
42.61 |
3.85% |
9.05 |
4.71 |
3.58 |
8.40% |
76% |
| CRR |
Carbo Ceramics, Inc. |
64.49 |
5.14% |
11.29 |
5.71 |
1.08 |
1.67% |
19% |
| HRL |
Hormel Foods Corp. |
28.83 |
5.68% |
16.02 |
1.80 |
0.60 |
2.08% |
33% |
| PBI |
Pitney Bowes Inc |
13.36 |
5.70% |
3.91 |
3.42 |
1.50 |
11.23% |
44% |
| CAT |
Caterpillar Inc. |
82.82 |
5.84% |
9.26 |
8.94 |
2.08 |
2.51% |
23% |
| OMI |
Owens & Minor, Inc. |
29.06 |
6.17% |
15.79 |
1.84 |
0.88 |
3.03% |
48% |
| VVC |
Vectren Corp. |
28.78 |
6.55% |
14.84 |
1.94 |
1.40 |
4.86% |
72% |
| ED |
Consolidated Edison, Inc. |
59.83 |
6.71% |
16.53 |
3.62 |
2.42 |
4.04% |
67% |
| SON |
Sonoco Products Co. |
30.59 |
6.92% |
15.53 |
1.97 |
1.20 |
3.92% |
61% |
| STBA |
S&T BanCorp., Inc. |
16.85 |
7.46% |
14.28 |
1.18 |
0.60 |
3.56% |
51% |
| SRCE |
1st Source Corp. |
22.06 |
7.56% |
11.55 |
1.91 |
0.68 |
3.08% |
36% |
| MCD |
McDonald's Corp. |
92.51 |
7.67% |
17.39 |
5.32 |
3.08 |
3.33% |
58% |
| BUSE |
First Busey Corp. |
4.76 |
7.69% |
19.04 |
0.25 |
0.16 |
3.36% |
64% |
| APD |
Air Products & Chemicals, Inc. |
82.00 |
7.74% |
13.00 |
6.31 |
2.56 |
3.12% |
41% |
| UTX |
United Technologies Corp. |
75.96 |
7.88% |
15.92 |
4.77 |
2.14 |
2.82% |
45% |
| UNM |
Unum Group |
19.75 |
8.04% |
26.69 |
0.74 |
0.52 |
2.63% |
70% |
| ANAT |
American National Insurance |
72.01 |
8.16% |
10.65 |
6.76 |
3.08 |
4.28% |
46% |
| PNY |
Piedmont Natural Gas Co., Inc. |
31.28 |
8.24% |
20.05 |
1.56 |
1.20 |
3.84% |
77% |
| VLY |
Valley National BanCorp. |
9.85 |
8.24% |
14.49 |
0.68 |
0.65 |
6.60% |
96% |
| CWT |
California Water Service |
18.58 |
8.40% |
21.11 |
0.88 |
0.63 |
3.39% |
72% |
| SJW |
SJW Corp. |
24.59 |
8.90% |
21.76 |
1.13 |
0.71 |
2.89% |
63% |
| LM |
Legg Mason, Inc. |
24.39 |
9.08% |
22.58 |
1.08 |
0.44 |
1.80% |
41% |
| FDS |
FactSet Research Systems Inc. |
93.28 |
9.25% |
22.64 |
4.12 |
1.24 |
1.33% |
30% |
| MDU |
MDU Resources Group Inc. |
21.48 |
9.31% |
19.01 |
1.13 |
0.67 |
3.12% |
59% |
| AMAT |
Applied Materials Inc. |
10.90 |
9.33% |
13.13 |
0.83 |
0.36 |
3.30% |
43% |
| BDX |
Becton, Dickinson and Co. |
76.62 |
9.38% |
13.88 |
5.52 |
1.80 |
2.35% |
33% |
| GD |
General Dynamics Corp. |
66.10 |
9.53% |
9.69 |
6.82 |
2.04 |
3.09% |
30% |
| RBCAA |
Republic BanCorp., Inc. |
20.49 |
9.87% |
4.06 |
5.05 |
0.66 |
3.22% |
13% |
| RLI |
RLI Corp. |
68.06 |
10.02% |
13.24 |
5.14 |
1.28 |
1.88% |
25% |
| SFNC |
Simmons First National Corp. |
24.83 |
10.11% |
16.12 |
1.54 |
0.80 |
3.22% |
52% |
| NJR |
New Jersey Resources Corp. |
45.27 |
10.12% |
20.03 |
2.26 |
1.60 |
3.53% |
71% |
| RAVN |
Raven Industries, Inc. |
27.68 |
10.32% |
18.96 |
1.46 |
0.42 |
1.52% |
29% |
| PPL |
PP&L Corporation |
29.44 |
10.34% |
10.01 |
2.94 |
1.44 |
4.89% |
49% |
| DOV |
Dover Corp. |
55.33 |
10.35% |
12.03 |
4.60 |
1.40 |
2.53% |
30% |
| SJI |
South Jersey Industries, Inc. |
51.49 |
10.68% |
16.19 |
3.18 |
1.61 |
3.13% |
51% |
| JCI |
Johnson Controls Inc |
25.87 |
10.70% |
10.31 |
2.51 |
0.72 |
2.78% |
29% |
| MSEX |
Middlesex Water Company |
19.23 |
10.71% |
24.04 |
0.80 |
0.74 |
3.85% |
93% |
| CAH |
Cardinal Health, Inc. |
40.89 |
10.78% |
13.11 |
3.12 |
0.95 |
2.32% |
30% |
| STR |
Questar Corp. |
20.20 |
10.81% |
17.12 |
1.18 |
0.68 |
3.37% |
58% |
| EMR |
Emerson Electric Co. |
48.35 |
10.92% |
14.65 |
3.30 |
1.60 |
3.31% |
48% |
| COP |
ConocoPhillips |
56.17 |
10.96% |
6.56 |
8.56 |
2.64 |
4.70% |
31% |
| 50 Companies |
|
|
|
|
|
|
|
Watch List Review
Topping out list this week is Intel (INTC). The stock continues to be under pressure especially after Advance Micro Devices (AMD) issued a profit warning. Speculation about job cuts, as much as 2,340 jobs (20% of the work force), is also circulating. AMD shares were down -14% on Friday. Despite that, Intel share were down just less than -1%. At the current price, INTC is yielding 4.19% with a conservative payout ratio of 38%. While the short-term picture seems grim, with the PC market slowing to a halt, we still believe the that there is significant value built into INTC and it shouldn’t be ignored. Again, we took a position in Intel about a week ago and would be very excited to see it trade down to $16.
ABM Industries (ABM) has been trading in a "line" formation (between $18-$20) for nearly three months. The stock appears to be retesting the $18 level we saw in mid-July. The company announced a definitive agreement to purchase Air Serv which provides facility management services to airlines and airports. ABM expects to add $650 million to their top line through this acquisition. Based on that, we assume a Price-to-Sales ratio of 0.24 which is a decent figure. Our valuation model shows a possible downside to $15 and upside to $24, a –19%/+34% risk/reward.
Top Five Performance Review
In our ongoing review of the NLO Dividend Watch List, we have taken the top five stocks on our list from October 14, 2011 and have check their performance one year later. The top five companies on that list can be seen in the table below.
| Symbol |
Name |
2011 Price |
2012 Price |
% change |
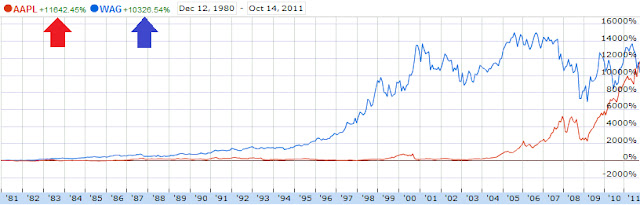
| WAG |
Walgreen Co. |
32.90 |
35.94 |
9.24% |
| PEP |
PepsiCo Inc. |
62.09 |
70.05 |
12.82% |
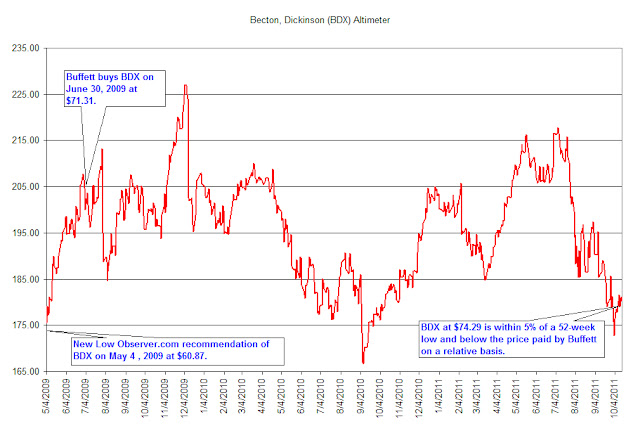
| BDX |
Becton, Dickinson and Co. |
73.85 |
76.62 |
3.75% |
| AROW |
Arrow Financial Corp. |
22.73 |
24.74 |
8.84% |
| FRS |
Frisch's Restaurants, Inc |
19.52 |
17.13 |
-12.24% |
|
|
|
Average |
4.48% |
|
|
|
|
|
| DJI |
Dow Jones Industrial |
11,644.49 |
13,328.85 |
14.46% |
| SPX |
S&P 500 |
1,224.58 |
1,428.59 |
16.66% |

Our top five underperformed the market by nearly 10% partly due to the loss from Frisch (FRS). All of the stocks on our watch list achieved a +10% gain within a year. In fact, 4 of 5 stocks achieved 15% gains within the year.
Despite the year end losses in FRS, it should be noted that in the process to FRS having a losing year, it also had the largest increase in the year. FRS gained as much as +67% before collapsing within the last two months. The performance of FRS is among the primary reasons why we choose to consider selling if the gain exceeds the historical average.