Category Archives: SVU

Odds and Ends

Question:
Do you think Richard Russell has been overrated regarding his abilities to forecast the directions of the markets? It seems like one good call (1975) allows one in his position to reap benefits for years despite demonstrating no skill when one goes back and, with the benefit of hindsight, takes a critical look at the entire record.
Our Thoughts:
Anyone, including NLO team, who attempts to predict the stock market is under extraordinary pressure. The challenge that Russell presents is that he often ignores that he has a bias towards the market falling rather than rising. This becomes a problem when, against his experience and better judgment, Dow Theory might be indicating that the direction is up despite all the negative market fundamentals.
Again, Dow Theory is supposed to include all the current and foreseeable hopes and fears as it relates money. I think that if Russell would follow Dow Theory or even his PTI indicator more often he would get a more accurate readings on the market.
It should be noted that within the content of his Dow Theory Letters from 1958 to the present, there are many great calls.  As I post more reviews of Russell’s letters, I will be able to point out too many instances of where Russell was spot on.
Unfortunately, Russell often didn’t stick to his guns or he forgot his earlier good advice or information. As an example, Russell talks about the importance of compounding. This cannot be accomplished if you’re buying and selling based on Dow Theory. Another example is Russell’s commentary on values. You can’t speak of values if you’re primarily focused on ETFs, index funds or stocks that don’t increase their dividends when plenty of them exist.
The pace and excitement of the markets become challenging for anyone to remain focused on the fundamentals. Russell has fallen astray of the basic principals of Dow Theory and value investing. Although the two seem mutually incompatible, there is a middle ground which Russell hasn’t attempted to address in all the years of his work.
Question:
I'm curious that you write "In my observations, market volume has increasingly become an addendum to Dow Theory." Meaning, only as a sidelight, or as an increasingly important variable? It does seem harder to judge given increased manipulation on light volume. Looks like lots of stick saves last week.
Answer:
It may be a function of the markets being driven by various large institutions (mutual funds, hedge funds, index funds, ETFs etc...) but volume seems to be less reliable when trying to determine sentiment and trends on the NYSE. I suspect that the diminished impact of smaller participants and derivative markets have had a lot to do with my concerns about volume not being a strong indicator. However, I will continue track volume just in case.
Question:
What did you do with the proceeds from the sale of WTR?
Answer:
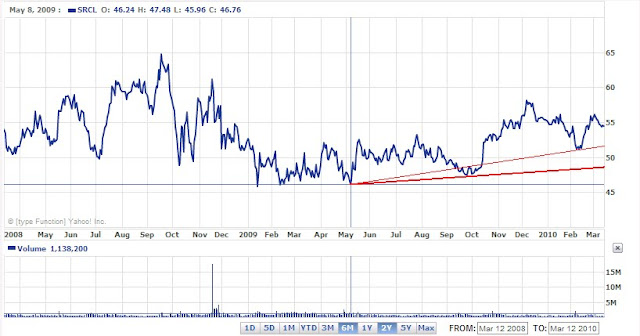
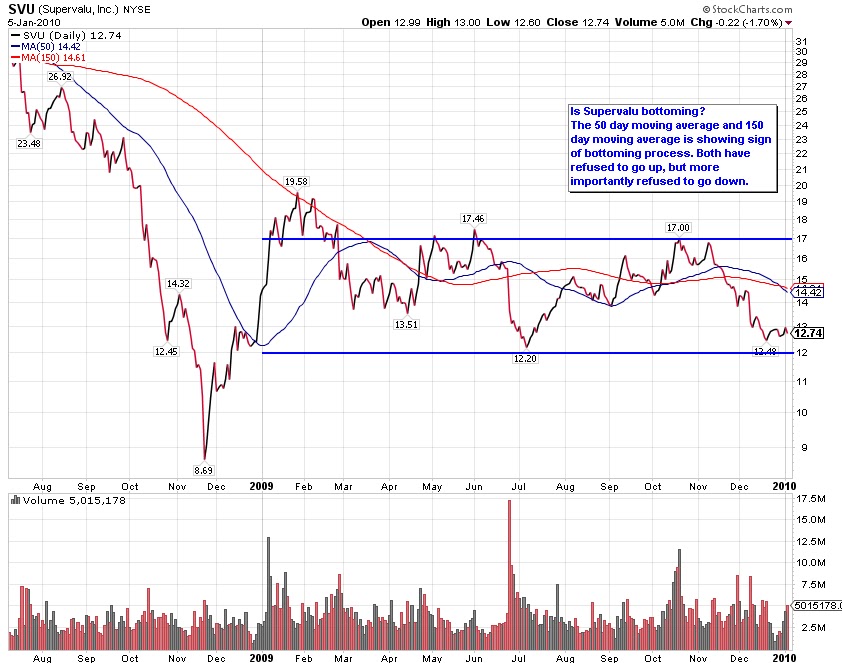
After investing in WTR we recommended CEPH and SVU which generated 13% and 11% gains respectively. Both stocks were on our Watch Lists and in each case we accomplished our targets and made subsequent sell recommendations. In addition to our posted recommendations, we also participated in CWT and GENZ. Both positions accomplished our short-term after tax goals which allowed for the purchases of new stocks on our dividend Watch List.
Our article titled “Meridian Biosciences and Other Profitable Market Lessons” provides a framework for the strategy we’d like to employ when investing in Dividend Achievers. Another article that weighs heavily on our investment decisions is titled “It Isn’t Easy Being Green.” That article outlined Hetty Green’s approach to handling her funds when not invested in stocks. We’ve simply applied a similar strategy to Dividend Achievers and Nasdaq 100 stocks at a new low (after careful analysis).
Question:
Would you venture to provide a top pick from your current dividend achievers list?
Answer:
As you can tell, the current list has too many companies that are candidates for investment. Without providing any detailed analysis,  I would say that my top four choices for additional research would be Ritchie Bros Auctioneers (RBA), Northern Trust (NTRS), Dentsply (XRAY), and Meridian Biosciences (VIVO).  We expect, and hope, that the price of these stocks will fall further while we get more research in.  We're using the March 2009 low as our benchmark for all investment analysis going forward and we hope that you do the same.
Russell Blurb:
For what it is worth Richard Russell’s commentary today (July 12, 2010) seems to fly in the face of the commentary that he gave on Friday July 9, 2010. Go figure:

“The recent non-confirmation by the Transports may have served as an entry spot for bold speculators, but I doubt if the 2007 highs in the Averages will be approached or bettered. Nevertheless, we may see a brief period of better markets, a "breather" in the long life of the bear. I believe this primary bear market will extend into 2016.

A near-term marker or target is to see whether the Dow and the Transports can better their recent June highs. Those highs were 10450.64 for Industrials and 4467.25 for Transports. Write those figures down. I'm betting that the two D-J Averages will not be able to better the June highs. Let's wait and see.”

All I can say is, at least he indicated an upside target that matches the one we came up with yesterday.  Can't understand how he was so bullish on Friday and is now sounding so skeptical today.

Email our team here.

Gaining More by Limiting Our Gains

One of the biggest challenges to buying and holding a stock for the long term is the wait through thick and thin for the expectations of a particular stock to materialize. In a process of elimination, the New Low Observer team has narrowed down the steps to determining quality stocks by relegating it to those that have increased their dividend every year for at least 10 years in a row. Furthermore, we only seek out those high quality dividend paying stocks, as well as Nasdaq 100 index constituents, when the companies are within 20% of the 1-year low. Having these requirements allows us to select quality companies at (potentially) ideal times to invest.
However, once we have decided on the company that we're interested in investing and we've committed money to, we are still at the whims of "Mr. Market." Although it might seem surprising to some, we are incredibly risk averse and always try to avoid losses whenever we can. We are so risk averse that we have a general rule that if the investment in a particular stock exceeds the gains of the market over the last 100, 50, 25, or 10 years on an annual basis (after expenses) then we tend to sell that stock to seek alternative investment opportunities. If nothing else, we secure the exceptional gains and bide our time until the next "undervalued" opportunity arrives.While the buy-and-hold crowd cries foul at the thought that we're speculating rather than investing when buying and selling high quality stocks at arguably undervalued prices, we have noticed a pattern that keeps emerging from our strategy that sets apart our approach from merely speculating. One of the best recent examples of the value in our investment philosophy is the case of Meridian Biosciences (VIVO).
On March 17, 2010, as the Dow Industrials and Dow Transportation Average were confirming the Dow Theory trend to the upside, Meridian Biosciences (VIVO) was dropping like a rock on news that the future earnings would have to be revised lower. In one fell swoop, Meridian Biosciences (VIVO) erased 9 months of hard earned gains in the stock price. I say 9 months because after our recommendation to sell VIVO, the stock increased in value an additional 27% in 3 months at the peak in September 2009.
At the time of our sell recommendation, Meridian Biosciences had risen 11.75% from our Research Recommendation on March 26, 2009. We were content in our gains and smug at being so smart at selling while the going was good. However, we watched, in almost horror, as the stock continued to climb higher going from our sell point of $20.35 all the way up to $26. We began to wonder if selling a company that we were convinced was of the highest quality was the best choice. After all, Meridian Biosciences (VIVO) is one of the only Dividend Achievers to match the gains of Google (GOOG) on a percentage basis from the date of Google's (GOOG) IPO to the peak in late 2007/early 2008.
With a tinge of regret we moved on hoping that our next investment would make up for our blunder of selling VIVO at such a cheap price. In the nine months since our sell recommendation of Meridian Biosciences (VIVO) we've made eight Investment Observations that were followed by Sell Recommendations. Below are the stocks we mentioned and the percentage gains that were secured since our sell recommendation of VIVO on June 12, 2009:
  • Cardinal Health (CAH) +23%
  • Abbott Labs (ABT) +16.80%
  • SuperValu (SVU) +11.87%
  • Nor'wst Nat (NWN) +10.53%
  • AquaAmer. (WTR) +10%
  • Cephalon (CEPH) +13.41%
  • Mattson (MTSN) +24%
  • Monsanto (MON) +22%
With the reduction of earnings estimates and the subsequent collapse of Meridian Biosciences (VIVO), the stock has fallen below the level of the original sell recommendation that was given on June 12, 2009. In addition, we've highlighted eight companies that have provided double digit returns in a complete buy and sell cycle all within a nine month period. The chart below illustrates the recommendation dates in green and the sell dates in red with the post-collapse price in yellow.
Today the New Low Observer team breathes a sigh of relief, not in the lose that has afflicted current Meridian Biosciences shareholders but based on the fact that we stayed the course with our investment philosophy which provided gains that, to this point, have gone beyond our expectations by actually limiting how much we are willing to accept on the upside.The lesson that should be learned about Meridian Biosciences is that although the price is nearly the same as a year ago doesn't mean that there was no movement or activity. In fact, the stock went up as much as 44% in 5 months. This is the hard lesson that most buy-and-hold investors should have learned about where the major indexes have gone over the last 10 years. Within all the drama that occured since 2000, many opportunies presented themselves but may have never been realized if holding for the long-term was the only investment strategy. For most investors, the real challenge becomes whether or not to sell a stock after exceptional gains.
Our Current Take on Meridian Biosciences
In our sell recommendation of Meridian Biosciences at the $20.35 level, we said that VIVO would easily go to the $23.33. Since the peak in the price at $26.20 in September 2009 and the recent decline to $19.60, Dow Theory indicates that for this stock, the upside move should take the price at least to the $23 level before going back to the old high of $26.20 or back down to the $19 range. Our expectation that a reaction of 11% to 13% upside move would not be unusual.For those who are interested in justifications of Meridian Biosciences (VIVO) as an investment candidate (since the negative news is already out), there are several compelling factors to watch for.
First and foremost is the recent confirmation of the bullish move of the stock market according to Dow’s Theory. This gives the investor that chance to make mistakes without paying a hefty price. More specific to Meridian Biosciences (VIVO) is the fact that the company is selling 16% below the 8-year average price-to-earnings ratio according to Morningstar.com. VIVO is also selling 3% below the average price-to-cash flow ratio over the last 10 years. Bolstering the case for VIVO is the fact that the company carries little or no debt. We will be watching Meridian Biosciences (VIVO) closely for any indication that the stock will decline from the current level. Our hope, as it always is, is to buy the stock at a much lower price and take reasonable gains in the shortest period of time possible. It is our hope that others can see the value of our approach of taking gains that exceed the historical average annual return and seeking alternative investment opportunities whether it is in cash or another quality stock that is at or near a new low.
  • Don't know the historical average annual gains for 100, 50 or 10 years. Go to Moneychimp.com's CAGR of the Stock Market Calculator. Pick just about any time frame and see what you've been missing (even on an inflation adjusted basis).
  • Want more info about the strategy mentioned above, then go to our article title "When Timing Meets Opportunity" on SeekingAlpha.com. The article was posted in July of 2009 and has more relevancy than ever before.
  • Our article titled "Seeking Fair Profits" outlines Charles H. Dow's philosophy of fair expectations when investing in the stock market. Charles Dow was the co-founder of the Wall Street Journal and the Dow Jones Indexes.
Tell a friend about us. Thank you.

Nasdaq 100 Watch List

Symbol Name Trade P/E EPS Yield P/B Pct from Yr Low
QCOM QUALCOMM 38.95 31.3 1.25 1.70% 3.1 9.84%
ERTS Electronic Arts Inc. 17.77 N/A -2.3 N/A 2.3 13.18%
GILD Gilead Sciences, Inc. 47.42 16.8 2.82 N/A 6.7 14.79%
FSLR First Solar, Inc. 115.5 15.4 7.53 N/A 3.6 17.04%
SRCL Stericycle, Inc. 54.49 26.9 2.03 N/A 5.5 18.56%
APOL Apollo Group, Inc. 63.02 15.2 4.16 N/A 6.8 19.38%
GENZ Genzyme 56.91 36.9 1.54 N/A 2 20.85%

Watch List Summary

This week on the Nasdaq 100 Watch List there were several notable changes. We had Stericycle (SRCL) decline -1.55% for the week. Stericycle (SRCL) had the largest decline of stocks that were on our watch list from the prior week. It appears that SRCL is on its way to declining to the previous low of $50.62. Since May 2009, SRCL has managed to trace out higher lows. SRCL is currently selling 29% below the 10-year average P/E ratio and 24% below the 10-year average price to cash flow ratio. Counteracting those positive features is that the company is selling almost 7% above the 10-year average price to book ratio. According to Morningstar, SRCL is a wide moat company or a company that a significant advantage that is challenging for new competitors to enter the industry (SRCL chart below).

The leading stock on the Nasdaq 100 in the past week has been First Solar (FSLR), which gained 6.37%. FSLR is selling at least 60% below the 3-year average price to book, price to cash, price to earnings, and price to sales. Lacking any 10-year data on First Solar (FSLR) my intuition tells me to consider this stock only in a small portion of the portfolio and that I’m willing to lose 100% of invested funds. FSLR seems like the Whole Foods (WFMI) of the energy sector, great concept but little in the way of sustainability.
Finally, the sector that appears to be on the move is the video game group. Both Electronic Arts (ERTS) and Activision Blizzard (ATVI) gained 3.80% and 3.99% respectively. The move higher was also confirmed by Gamestop Corp (GME), which rose just over 6% for the week.
In a footnote to our Dividend Achiever Watch List, we wish to bring to your attention the recent rumors that SuperValu (SVU) is being considered as a takeover candidate. Since our Investment Observation on January 6, 2010, the stock has run up 33.72%. SuperValu (SVU) sports a price to earnings ratio of 38 and a price to sales ratio that is half of its 5-year average. The price to book ratio is currently at the 5-year average. SVU seems a bit rich for me at this time however the performance of the stock since our January 6th article does not surprise our team.
The Nasdaq 100 Watch List is strictly for the purpose of researching whether or not the companies have viable business models or are about to go out of business. These companies are deemed highly speculative unless otherwise noted.
 -Touc

Email our team here.

Upcoming Ex-Dividend Dates for Dividend Achiever Watch List

Below are the approximate ex-dividend dates for companies that appeared on our Dividend Achiever watchlist dated January 15, 2010. If you happen to be researching these companies for potential investment it would be advisable to consider the ex-dividend date prior to possible purchases. Owning the shares of the company that you're interested in before the ex-dividend date entitles you to the upcoming dividend payment. Owning the shares after the ex-dividend date means that you would have to wait at least three months before receipt of the next payment.
Please verify the ex-dividend date and payout ratio before committing funds to these stocks. Additionally, do not base your next long or short term purchase on the dividend payment or yield. Instead, get as much research in as you possibly can before the ex-dividend date "just in case." Be advised that our Investment Observation of SVU has run up 18.81% in 15 days and will not appear on our watch list until it falls within 20% of the most recent 52-week low. -Touc
Name Symbol % from Yr Low Approx. Ex-Dividend Date
1st Source Corporation
10.19%
2010-01-30
EXXON MOBIL CP
7.82%
2010-02-06
CALIFORNIA WATER SVC
9.53%
2010-01-31
Weyco Group, Inc.
10.99%
2010-02-13
AQUA AMERICA INC
12.80%
2010-02-10
AMER ST WATER
13.17%
2010-02-05
NORTHWEST NAT GAS
16.73%
2010-01-27
SUPERVALU INC
25.47%
2010-02-26
THE HERSHEY COMPANY
19.56%
2010-02-20

Sell SuperValu (SVU) at the Market

It is now time to recommend that SuperValu (SVU) be sold at the market. The stock has performed well since the investment observation was issued on January 6, 2010. It is highly recommended that anyone who bought the stock based on Art's insight should re-read the posting. Unfortunately, it was not possible to buy this stock at any price lower than on the recommended date.

SVU's stock price has gone nothing but up since the recommendation. However, in the pursuit of "seeking fair profits" the returns that this stock has provided within the last 9 days say that it is necessary to consider alternative opportunities. The key to investment success and a key principle of economics is to seek the best alternatives.

SVU was recommended when it was trading at $12.81. As of January 14, 2010, SVU was quoted at $14.33. In after-hour trading, SVU was up $0.05 to $14.38. Based on the closing price of $14.33, SVU has gained 11.87%. The annualized return on this position would be 481%. Selling this stock now generates a return of 4.75x greater than the amount of the dividend yield if held for a full year. Additionally, the 11.87% gain exceeds the return on a 30-year treasury purchased on January 6, 2010 by 2.53x (if held to maturity.)

Those not interested in following through with our sell recommendation can feel comfortable knowing that SVU is a great long-term holding with an 11.87% downside cushion since our investment observation.

As we have indicated in the purposes and function of this site, our goal is to:

  • maximize the annual yield of each trade.
  • reduce time between buying and selling of each stock.
  • exceed the annual yield of government guaranteed alternatives in each trade.
Investment observations are intended to be a starting point for investigating a quality company at a reasonable price. It is hoped that after doing the background research you can buy the stock at a lower price. Ideally the stock should be held in a tax deferred account and should not consist of less than 20% of your holdings. Personally, we prefer holding only 2-3 stocks at a time.

Sell recommendations are intended to deal with the short term reality of the market. The tracking of the Sell recommendations are the worst case scenario if you happen to have bought a stock at the time the Investment Observation was made (please avoid making this mistake.) We aim for mediocrity in our returns, therefore we are happy with 9-12% annual gains. However, since codifying this approach to investing in 2005, we have had annual returns of 20% and above every year since.

It is always recommended that when selling a stock, one should not place stop orders, limit orders or orders after hours. This leaves the seller in the position of being vulnerable to the whims of the market makers. Instead, place your sell orders only as a market order during market hours. Some would complain that a market order during market hours might leave some profits on the table. However, we would rather leave some money on the table rather than have it taken away from us by the trades that are placed by institutions and market makers. -Touc.

Investment Observation: Supervalu (SVU) at $12.81

Supervalu (SVU) has been on our watch list since December 2009. After considerable analysis, I decided to pull the trigger today at $12.81, less than 5% within the 52-week low. My model showed the price of $12 to be the buy range and $15 to be the fair value. The negative earnings on the surface is a concern. However, a deeper investigation shows that the company was forced to take an impairment charge of $3,250 back in January of 2009 because of the Statement of Financial Accounting Standards (SFAS) No. 142 accounting rule. This resulted in a negative earning of $13.95 per share. The quote below was taken from the SEC filing.

For the third quarter of fiscal 2009 the Company’s stock price had a significant and sustained decline and book value per share substantially exceeded the stock price. Consistent with SFAS No. 142, the Company performed an interim impairment test of goodwill and indefinite-lived intangible assets at the end of the third quarter of fiscal 2009. Although this analysis has not been completed due to its complexity, based on the work performed to date the Company has recorded a preliminary estimate of impairment charges of $3,250, comprised of $3,000 of goodwill and $250 of indefinite-lived intangibles.

I recalled that SVU was trading at a 70% discount to book during the March low. After an adjustment, it has a book value of $12.79. I purchased the shares at book value.
Despite the consideration of these adjustments, not all is bright for SVU. The company's operating margin is 3.09%, very low compared to its competitors. A large amount of long-term debt ($8 billion) is a dark cloud that hangs over the company. Large capital expenditure will deplete their cash flow if the economy doesn't pick up. After 35 years of consecutive dividend increases, the company reduced their distribution by 50% and now pays out $0.35 or 2.8% annually. All of these factors contributed to SVU trading at such discounted level.

Forward P/E is at 6.64 times. The price-to-sales ratio is at a low of 0.06. Price-to-book value is at 1. Current dividend yield of 2.8% which exceeds the five year average yield of 2.5%. The current ratio of 1 means that the company can turn over their current assets at the same rate as their current liabilities. This is important for short-term viability concerns.

Fundamental aside, it was the technicals of SVU that prompted me to buy. From the chart below, you can see that for most of 2009 the stock trade within the $17 and $12 range. As business conditions improved and the company returned to profitability in the second half of the year, shares remained unchanged. The stock appears to be "bottoming" as it remains range bound. The moving averages are doing the same as well. A break below $12 would spell trouble and I would get out while a breakout above $17 will signal better times for SVU.
I bought the stock at $12.81 and will sell if it break below $12 (-7%). Profit will be taken around $15 (+17%).
The purpose of our investment observations is to point out quality Dividend Achievers and formers that are near a 52-week low. From this point begins the fundamental research to verify the quality of the stock for both short and long-term investing. These recommendations are within the context of the 3rd year of an 18-year secular bear market. A bear market that we expect could trade in a range between 16,000 and 5,000. The secular bear market will be considered over when the Dow Transports and Dow Industrials exceed their respective peaks on high volume or the dividend yield on the Dow exceeds 6% or higher. -Art