Below is a chart of how our investment portfolio performed against the S&P 500 index and the 30-year Treasury based on the January 2, 2014 rate (found here).


Below is a chart of how our investment portfolio performed against the S&P 500 index and the 30-year Treasury based on the January 2, 2014 rate (found here).
Below is the one year performance of our March Dividend Watch Lists for 2010, 2011, 2012 and 2013. While the Wall Street adage says “Sell in May and Go Away,” we’d like to know what the market would look like if an investor bought our “Top Five” stocks before May and held for the following year.
First up is the March 26, 2010 watch list (found here). The chart is organized based on the stocks nearest the new low on the left. For the year, our Top Five stocks (XOM, FPL, MON, TMP, BRO) gained an average of +20.86% as compared to the Dow Jones Industrial Average gains of +12.63%. In this example, the Top Five stocks provided above average gains. Within the context of the gains that were made one year later, the Dow Jones Industrial Average experienced a decline of –14.60% from the April 2010 high to the July 2010 low. As a note, FPL bought PGN and trades under a new symbol NEE.

Next up is the 2011 watch list (found here). For the year, our Top Five stocks (SJW, SYY, WABC, PPL, TGT) gained an average of +8% as compared to the Dow Jones Industrial Average gains of +7.04%. In this example, the Top Five stocks provided moderate gains. Within the context of the gains that were made one year later, the Dow Jones Industrial Average experienced a decline of –19.19% from the May 2011 high to the October 2011 low. As a note, HGIC and TRH were both acquired.

The Dividend Watch list below is from March 23, 2012 (found here). For the year, our Top Five stocks (TR, CHRW, CLX, ATO, CWT) gained an average of +18.32% as compared to the Dow Jones Industrial Average gains of +10.94%. In this example, the Top Five stocks provided exceptional gains. Within the context of the gains that were made one year later, the Dow Jones Industrial Average experienced a decline of –10.70% from the May 2012 high to the June 2012 low. Additionally, the Dow Jones Industrial Average declined –8.71% from October 2012 to mid-November 2012.

The next Watch List is from March 22, 2013 (found here). The Top Five stocks (CATO, FDS, CTWS, EXPD, BCR) gained an average of +20.78% which was below the +23.12% gained by the entire list. During the same period of time, the Dow Jones Industrial Average gained +12.53%.

Even with the view of “Sell in May and Go Away,” the Top Five stocks on our U.S. Dividend Watch List have performed quite well. The average gain over the four periods reviewed was +16.99% compared to average gain of the Dow Industrials at +10.78%.
All good things must come to an end. We do not expect that the stock market will be as forgiving in the next four years as it has in the last four years. However, we recommend considering our Top Five stocks from the latest dividend watch list for potential short and long-term investment opportunities, even if the mantra is “Sell in May.”
Posted in Dividend Watch List, Performance Review
Below is a chart of how our investment portfolio performed against the S&P 500 index and the 30-year Treasury based on the January 3, 2013 rate (found here).

Our portfolio exceeded the guaranteed rate (30-yr treasury) by almost six times. However, the S&P 500 exceeded our 2013 return by nearly double.
Below is the cumulative performance of our investment strategy since 2006 when we codified our investment approach in the last quarter of 2005. We have compared our performance to the indexes indicated, based on $10,000 invested over the subsequent period of time.
|
Year
|
Dow Indu. | $10,000.00 | S&P 500 | $10,000.00 | Nasdaq | $10,000.00 | NLO | $10,000.00 |
| 2006 | 16.29% | $11,629.00 | 15.74% | $11,574.00 | 9.52% | $10,952.00 | 18.30% | $11,830.00 |
| 2007 | 6.43% | $12,376.74 | 5.46% | $12,205.94 | 9.81% | $12,026.39 | 19.80% | $14,172.34 |
| 2008 | -33.84% | $8,188.45 | -37.22% | $7,662.89 | -40.54% | $7,150.89 | 14.35% | $16,206.07 |
| 2009 | 18.82% | $9,729.52 | 27.11% | 9,740.30 | 43.89% | $10,289.42 | 36.65% | $22,145.60 |
| 2010 | 11.02% | $10,801.71 | 14.32% | $11,135.11 | 16.91% | $12,029.36 | 7.14% | $23,726.79 |
| 2011 | 5.53% | $11,399.05 | 0.00% | $11,135.11 | -1.80% | $11,812.83 | 6.20% | $25,197.85 |
| 2012 | 7.26% | $12,226.62 | 16.20% | $12,939.00 | 15.91% | $13,692.25 | 7.80% | $27,163.28 |
| 2013 | 26.50% | $15,466.67 | 31.90% | $17,066.54 | 38.30% | $18,936.38 | 19.00% | $32,324.30 |
Posted in Performance Review
On March 29, 2013, we published a review of the one-year performance of our March Dividend Watch Lists for the prior 3 years to see if the old adage of “Sell in May and Go Away” had any merit. Our conclusion was as follows:
“Even with the view of ‘Sell in May and Go Away,’ the top five stocks on our U.S. Dividend Watch List have performed quite well. The average gain over the three periods [2010, 2011 & 2012] reviewed was +15.72% compared to average gain of the Dow Industrials at +10.20%.”
In closing our piece on the topic of the one year performance of our U.S. Dividend Watch List, we said the following:
“…we recommend considering the top five stocks from our latest dividend watch list for potential investment, even if the mantra is ‘Sell in May.’”
The latest watch list was our March 22, 2013 posting (found here) and had the following companies and the subsequent performance:

It is not every day that you could expect dividend increasing stocks to perform better than the leading high tech stock index in the form of the Nasdaq 100 (NDX). However, that is exactly what happened with 61% of the listed stocks. In addition, 72% of the stocks listed managed to exceed our preferred benchmark, the Dow Jones Industrial Average.
Among the three stocks of particular interest to us (CATO, FDS, MYE), Myers Industries has been the top performer with a gain of +42% in the last six months. The average gain for the entire watch list was +16.47% as compared to the Nasdaq 100 index gain of +14.63%. The average gain for the top five stocks on our watch list (CATO, FDS, CTWS, EXPD & BCR) was +17.06%.
Is the six month period since our March 22, 2013 watch list a meaningful measure of performance? For investors with an understanding of Charles H. Dow’s goal of “seeking fair profits” (more here), within a tax-deferred or tax-free retirement account, it is everything. Gains of +10% or more in a six month period require careful consideration of selling the principal. Additionally, gains in stocks that have exceeded the performance of the Nasdaq 100 (NDX) index in the same period of time should be sold (principal only for the purposes of compounding) as exceptional gains of this kind are proven not to be sustainable over extended periods of time.
The concept of selling in May could be correct, for those seeking average performance of their portfolio. However, since 2010, our late March U.S. Dividend Watch Lists have provided above average returns one year later. Because it is our nature to take these gains with a grain of salt, we’re expecting that the one-year performance has to be far less than the six-month above average performance so far. We will reassess the actual one-year performance to see if, in fact, the March 22, 2013 list can retain such a “wide” margin of performance against the Dow Jones Industrial Average.
Comments Off on Sell in May? No Way!
Posted in NLO Dividend Watch List, Performance Review
We’ve come to the time when we need to determine the upside targets for gold stocks. There are a few assumption that we’re making in this assessment. First, we believe that our Gold Stock Indicator is right about the direction of gold stocks, in general. Second, we’re assuming that from the current levels there is more downside risk. Third, we have excluded fundamental analysis (government printing, future earnings capacity, gold as money, etc.) from our assessment of the upside potential for individual gold stocks.
Posted in Edson Gould, gold, gold bugs, Gold Stock Indicator, HUI, Performance Review, speed resistance line, SRL, upside target, XAU
Tagged members
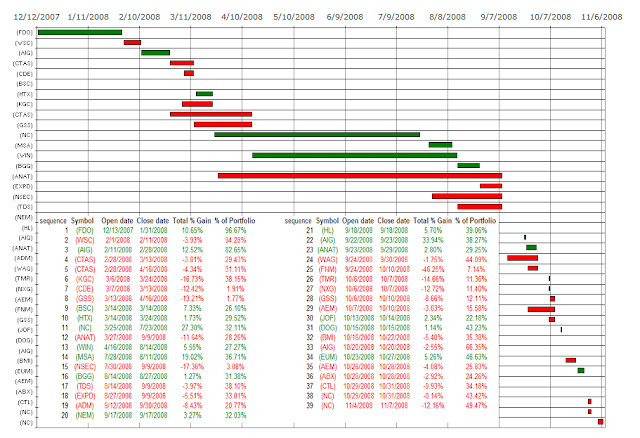
In our last review of our Watch List stocks, we tried to see if “sell in May” had any merit. Our conclusion was that within a rising market, in spite of short-term declines, the U.S. Dividend Watch List (USDWL) of stocks provided reasonable performance over a one-year period. It is our firm belief that a rising stock market makes everyone seem “smart,” so it is necessary for us to examine the performance of U.S. Dividend Watch List (USDWL) stocks during a stock market decline. Will stocks that are already beaten down underperform the Dow Jones Industrials Average?
Below is the one year performance of our March Dividend Watch Lists for 2010, 2011 and 2012. While the Wall Street adage says “Sell in May and Go Away,” we’d like to know what the market would look like if bought one month before May and held for the following year.
First up is the March 26, 2010 watch list (found here). The chart is organized based on the stocks nearest the new low are on the left. For the year, our top five stocks (XOM, FPL, MON, TMP, BRO) gained an average of +20.86% as compared to the Dow Jones Industrial Average gains of +12.63%. In this example, the top five stocks provided above average gains. Within the context of the gains that were made one year later, the Dow Jones Industrial Average experienced a decline of –14.60% from the April 2010 high to the July 2010 low. As a note, FPL bought PGN and trades under a new symbol NEE.
Next up is the 2011 watch list (found here). The chart is organized based on the stocks nearest the new low on the left. For the year, our top five stocks (SJW, SYY, WABC, PPL, TGT) gained an average of +8% as compared to the Dow Jones Industrial Average gains of +7.04%. In this example, the top five stocks provided moderate gains. Within the context of the gains that were made one year later, the Dow Jones Industrial Average experienced a decline of –19.19% from the May 2011 high to the October 2011 low. As a note, HGIC and TRH were both acquired.
The last Dividend Watch list is from March 23, 2012 (found here). The chart is organized based on the stocks nearest the new low on the left. For the year, our top five stocks (TR, CHRW, CLX, ATO, CWT) gained an average of +18.32% as compared to the Dow Jones Industrial Average gains of +10.94%. In this example, the top five stocks provided exceptional gains. Within the context of the gains that were made one year later, the Dow Jones Industrial Average experienced a decline of –10.70% from the May 2012 high to the June 2012 low. Additionally, the Dow Jones Industrial Average declined –8.71% from October 2012 to mid-November 2012.
Even with the view of “Sell in May and Go Away,” the top five stocks on our U.S. Dividend Watch List have performed quite well. The average gain over the three periods reviewed was +15.72% compared to average gain of the Dow Industrials at +10.20%.
All good things must come to an end. We do not expect that the stock market will be as forgiving in the next three years as it has in the last three years. However, we recommend considering the top five stocks from our latest dividend watch list for potential investment, even if the mantra is “Sell in May.”
Comments Off on End of March Dividend Watch List Performance
Posted in Dividend Watch List, Performance Review
Below is a chart of how our investment portfolio performed against the S&P 500 index and the 30-year Treasury based on the January 3, 2012 rate (found here).

Our portfolio exceeded the guaranteed rate (30-yr treasury) by almost double. However, the S&P 500 exceeded our 2012 return by more than double.
Below is the cumulative performance of our investment strategy since 2006 when we codified our investment approach in the last quarter of 2005. We have compared our performance to the indexes indicated, based on $10,000 invested over the subsequent period of time.
| Year | Dow Indu. | $ 10,000.00 | S&P 500 | $ 10,000.00 | Nasdaq | $ 10,000.00 | NLO Portfolio | $ 10,000.00 |
| 2006 | 16.29% | $ 11,629.00 | 15.74% | $ 11,574.00 | 9.52% | $ 10,952.00 | 18.30% | $ 11,830.00 |
| 2007 | 6.43% | $ 12,376.74 | 5.46% | $ 12,205.94 | 9.81% | $ 12,026.39 | 19.80% | $ 14,172.34 |
| 2008 | -33.84% | $ 8,188.45 | -37.22% | $ 7,662.89 | -40.54% | $ 7,150.89 | 14.35% | $ 16,206.07 |
| 2009 | 18.82% | $ 9,729.52 | 27.11% | $ 9,740.30 | 43.89% | $ 10,289.42 | 36.65% | $ 22,145.60 |
| 2010 | 11.02% | $ 10,801.71 | 14.32% | $ 11,135.11 | 16.91% | $ 12,029.36 | 7.14% | $ 23,726.79 |
| 2011 | 5.53% | $ 11,399.05 | 0.00% | $ 11,135.11 | -1.80% | $ 11,812.83 | 6.20% | $ 25,197.85 |
| 2012 | 7.26% | $ 12,226.62 | 16.20% | $ 12,939.00 | 15.91% | $ 13,692.25 | 7.80% | $ 27,163.28 |
Posted in Performance Review
Posted in 2008 Transactions, Performance Review