Category Archives: NFLX

Netflix $NFLX Price Momentum

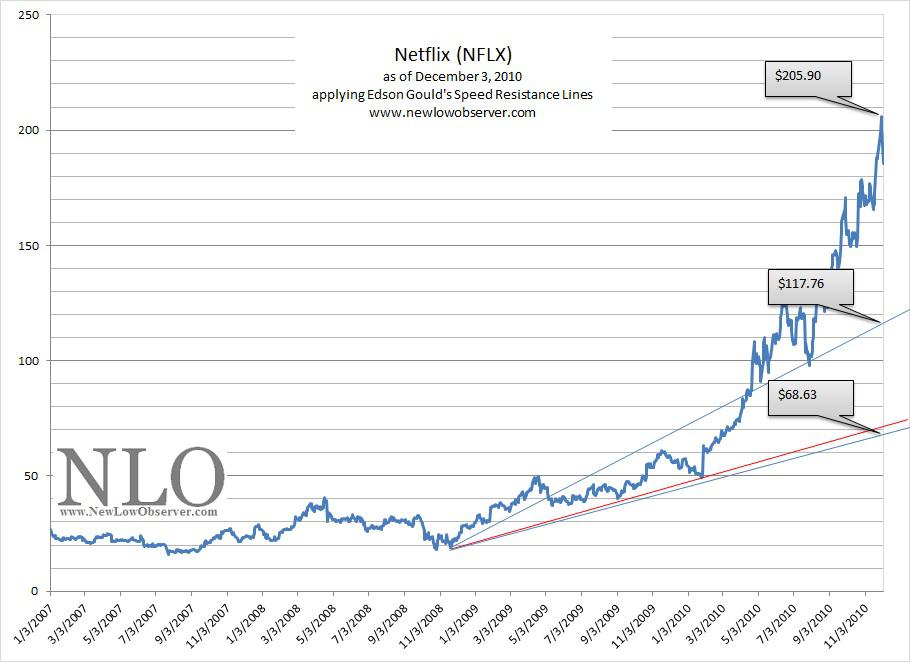
Below is a chart of the Netflix (NFLX) from 2010 to 2022, reflecting Price Momentum data. Continue reading

Netflix Downside Targets

Below are the downside targets for Netflix (NFLX).

YoY: Netflix

Below is a chart of Netflix (NFLX) from 2003 to 2019 reflecting the year-over-year (YoY) percentage change.

Continue reading

The Power and Lessons of Speed Resistance Lines

We are not big fans of charting as a means to make decisions about where the price of a stock or index will go. However, when a charting strategy has a high level of consistency while taking away our own person bias, we have to dig a little deeper.  This is a general overview of the incredible forecasting power and the practical investment lessons that we’ve experienced while employing Speed Resistance Lines.

Speed Resistance Lines, as demonstrated by the writing of Edson Gould, have been of significant aid in tempering our enthusiasm for a stock or index, especially when applied to targeting downside levels.  Within the context of the current bull market since 2009, we’ve seen a large majority of the stocks achieve the conservative downside target (more SRLs we’ve run here).  This means that even when we thought we selected the right stocks to apply to the SRL, we have been wrong.

Below are the earliest three examples of Speed Resistance Lines (SRL) that we introduced with the focus on downside targets.  The first SRL we will review is the Dow Jones Industrial Average from 1949 to 1975. The second SRL is for the Philadelphia Gold and Silver Stock Index (XAU) from 1998 to 2016.  The last one is Netflix (NFLX) from 2007 to 2013.

sources:

  • Scheinman, William X. “1966 and All That: One Stock Market Analyst Sees Some Ominous Parallels Today”. Barron's. March 17, 1969. pg. 5.
  • Scheinman, William X. “600 on the Dow?” Barron's. February 9, 1970. pg. 5.
  • Scheinman, William X. “May to December: The Bear Market, Says One Analyst, Will Hit Bottom This Winter”. Barron's. August 24, 1970. pg. 5.

Netflix: Investors Applaud Inefficient and Disorderly Market

The “Setup”

On October 17, 2016, in after hours trading, Netflix (NFLX) stock increased by as much as +19% on news that the company “…beat analyst expectations…”  More than a dozen analysts raised their price targets on the stock based on the upbeat news.  In one odd case, an analyst who issued a “sell” rating on Netflix also increased the price target, presumably being right about the price increase AND the forthcoming decline (always right, these guys).

image 

Underneath all the excitement, Barron’s cited Citigroup’s Mark May and Kenneth Dorell as saying the results were actually “better than feared” as it was highlighted that:

“Following a disappointing 2Q report (including 3Q guidance below forecasts), Netflix reported 3Q16 results and issued 4Q16 guidance above these lowered expectations. While subscriber net adds remain below year-ago levels and cash burn (including content spend) remains high, revenue growth accelerated to 32% (vs. 28% in 2Q) on subscriber growth of 25% (vs. 27% in 2Q) as the recent price increases benefited growth. We believe the stock’s reaction in the aftermarket may be due to a combination of 1) the set-up and negative sentiment heading into the quarter; and, 2) investors rewarding Netflix’s pricing power, as price increases proved not to have an outsized impact on churn.”

That’s a lot of negatives to reward a company with an increase in the stock price by nearly +20%.

The Problem

There is more to this picture than the apparent good news reported after-hours on October 17, 2016.  Regulators, exchanges, institutions and investors are sitting by idly while the credibility of the markets is slowly eroded.  I know you’re thinking, “who said the markets had any credibility”.  While there is always a question of integrity of the financial markets in general, active participants should question the rhyme and reason for after-hours market activity.  Chief among those questions should be, “is it still considered an orderly market if statically insignificant volume can garner outsized gains?”

For example, in the three months prior to October 17, 2016, average daily trading volume for Netflix was 10,204,329.  In the period from the close in regular trading on October 17, 2016 to the open of regular trading on October 18, 2016, the after hours and pre-market trading volume for Netflix equaled 10,138,767.  Additionally, the change in the stock price was +17.97% from the close on the 17th to the open on the 18th.  Finally, the total trading volume on October 18, 2016, excluding the pre-market trading, was 39,968,284 while the actual price change in Netflix stock during regular hours was +1.85%.

image

So the question remains, is it considered an orderly market when after-hours trading volume does not exceed average daily volume for the last three months but that same volume affects the price so disproportionately? Are investors negatively affected when trading volume is four times the three month average daily volume but the stock only trades up +1.85%?  The answer to both questions is no and yes, respectively.

Orderly markets cannot exist when stock exchanges open in after-hours to some investors (those playing the news release in after-hours) and is effectively closed to those who attempt to live outside of the gyrations of the market.  What everyone hears is the good news about the stock price going up.  However, what is not acknowledged is that short-sellers and good-til-cancel [GTC] orders to buy at a specific price were punished.

The Consequence 

Institutional short-sellers (and individuals) with large holdings were hit hard by being squeezed out of the market at any available price while individual investors who had an order to buy at a set price, say at or above $106 (a technical confirmation of the rising trend), had their orders executed at the opening price of $116 and above, shaving off nearly 10% that could have been realized if the stock replicated the same moves as what the after-hours generated.  However, this would have been unlikely as trading volume on the 18th would have only moved the price from the October 17, 2016 closing price of $98.77 to $100.59.

Many non-market participants and long-only investors would say, “if short sellers are hurt then that is their fault for playing a risky game.”  This seems reasonable until those same investors are on the receiving end of watching their stock get decimated to the downside in the same after-hour market when an otherwise highly liquid stock “gaps down”-5%, –10% or –20%.  This was the case with Intel (INTC) on after-hour trading which saw the stock drop more than -5%, on the same low volume that afflicted NFLX the previous after-hour session.

Financial markets have come a long way since the Nipper Panic of 1901 when short sellers in Union Pacific Railroad were squeezed out of the stock as the price increased from as low a $160 up to $1,000 and closed at $325 all in a single trading day.  However, when investors, regulators, institutions and exchanges ignore glaring issues such as the impact of after-hour trading, we begin to revert to the market we have attempted to avoid.

A Simple Solution

What is the answer to this problem?  Either companies are required to release news during regular trading hours or after-hour activity should be eliminated.  The best option is keep the after-hour trading and require all market relevant news to be done at the middle of each trading day.  This would promote a more orderly and efficient market without the chaos.

Alternatively, a steep price will be paid (by even those who are not participants) for ignoring a basic issue of market credibility, further undermining an already damaged reputation.

Netflix Inc.

image

Netflix Downside Targets

It’s that time again.  We’re going to see what the effectiveness of Gould’s Speed Resistance Lines (SRL) is in predicting the downside for Netflix (NFLX).  But first we’re going to review the last time that we ran an SRL on Netflix.  The very first time we ran numbers on NFLX was on December 3, 2010 when the stock was trading at the pre-split price of $185.45. 

image

At the time, we were testing out the quality of Gould’s work.  We came up with a conservative downside target of $117.76 and an extreme downside target of $68.63.  The most challenging part of the assessment was the fact that Netflix increased +50% before achieving the first downside target.

A follow-up review of the SRL on Netflix was done on September 22, 2011 where we had the following to say:

“…in reviewing the chart pattern of Netflix (NFLX), we have the peak of NFLX at $298.73. The conservative estimate for the stock is that it would fall to $148 which has already taken place. The extreme downside target would be $99.58. Because of the nature of the rise, we believe that Netflix (NFLX) is slated to fall at least to the $99.58 level.”

At the time, we proposed that NFLX would decline at least -66% from the peak of $298.73.  The actual decline was -79.89%.  Will it happen again? We don’t know.  However, if it does, there will be good buying opportunities ahead.

Netflix: Downside Targets

Review

On December 3, 2010, we ran the numbers for Netflix,based on the work of Edson Gould’s Speed Resistance Lines, to determine what the downside risk might be for the stock.  The projected downside targets are illustrated below:

Not long afterwards, Netflix stock price soared from $185.45 to $300.  However, the goal of our site is to determine downside risk and the rise in the stock price of was of little interest.  Our view is that if we missed an investment opportunity then we will consider investing only if the stock declines to any of the anticipated downside targets.

image 

Naturally, there was considerable opportunity that we missed on the way from $185 to $300.  However, our rule is to seek values and from our experience all quality companies become undervalued at some point. Finally and for numerous reasons, Netflix declined from the peak of $300 to as low as $53.80.  Naturally, we were able to pick up shares of Netflix at $62, a price we felt was reasonable at the time.  Our critical review of the downside targets allows us to accept our purchases for the long-term in case we happen to be wrong about the short-term upside prospects.

October 15, 2014: Netflix Downside Targets

Tesla Motors Added to Nasdaq 100, The Countdown Begins

On July 8, 2013, it was announced that Tesla Motors (TSLA) would join the Nasdaq 100 starting on July 15, 2013 (PR here).  Our analysis of Tesla will follow the review and performance of additions and deletions to the NASDAQ 100 Index.

As has been well documented on our site, the Nasdaq OMX has a history of adding and deleting companies on the Nasdaq 100 Index in a manner that is consistent with a money losing speculator.  The most recent example of the NASDAQ OMX follies, prior to TSLA, was when Netflix (NFLX) was added to the index after the stock price rose +141.32%…after being dropped from the index on December 24, 2012 (PR here).  Not to be outdone by itself, the NASDAQ OMX team previously added NFLX to the Nasdaq 100 on December 20, 2010 (PR here).

Our NASDAQ OMX debrief on NFLX additions and deletion:

  • Added to Nasdaq 100 on 12/20/2010: stock declines –49.32%
  • Dropped from Nasdaq 100 on 12/24/2012: stock gains +141.32%
  • Added to Nasdaq 100 on 6/6/2013: to be determined; up +11.98% so far

In our annual Nasdaq 100 Re-Rank Review in December 2012 (found here; includes 2010 and 2011 reviews), we pointed out that the stocks being dropped from the index typically outperform the stocks that are added to the index within the first year (our minimum benchmark).  Below is the performance of the stocks that were added or dropped since the Nasdaq 100 changes on December 24, 2012:

Symbol
Name 12/24/2012 7/10/2013 % change
ADI Analog Devices, Inc. 41.35 46.73 13.01% added
CTRX Catamaran Corporation 49.2 47.31 -3.84% added
DISCA Discovery Comm. 60.82 82.86 36.24% added
EQIX Equinix, Inc. 198.56 190.84 -3.89% added
LBTYA Liberty Global Inc. 60.31 77.42 28.37% added
LMCA Liberty Media Corporation 110.5 135.06 22.23% added
REGN Regeneron Pharmaceuticals 179.71 236.7 31.71% added
SBAC SBA Communications Corp. 69.62 75.94 9.08% added
VRSK Verisk Analytics, Inc. 48.84 61.67 26.27% added
WDC Western Digital Corporation 37.78 67.23 77.95% added
Average +23.71%
Symbol
Name 12/24/2012 7/10/2013 % change
APOL Apollo Group Inc. 21.02 17.89 -14.89% dropped
EA Electronic Arts Inc. 15.3 23.9 56.21% dropped
FLEX Flextronics International 6.09 7.86 29.06% dropped
GMCR Green Mountain Coffee 40.32 70.09 73.83% dropped
LRCX Lam Research Corporation 36.37 49.52 36.16% dropped
MRVL Marvell Technology Group 8.21 11.71 42.63% dropped
NFLX Netflix, Inc. 93.3 243.82 161.33% dropped
RIMM Research In Motion Limited 14.04 9.28 -33.90% dropped
VRSN VeriSign, Inc. 35.9 45.66 27.19% dropped
WCRX Warner Chilcott plc 11.7 19.53 66.92% dropped
Average +44.45%

As can be seen in the table above, on average, the stocks that were “added” underperformed the stocks that were “dropped” by 87%.  To be fair, if we exclude the gains of Netflix (NFLX), then the gains of the stocks “dropped” from the index would fall to +31.47%.  However, this is still nearly 33% greater than the gains achieved by the stocks that were “added” to the Nasdaq 100 Index.  Alternatively, if the highest performing stocks were deleted from each group, then the gains would be +17.69% for “added” versus +31.47% for “dropped”.

We understand that the parameters for addition and deletion of companies to the Nasdaq 100 are mechanical and therefore cannot discern qualitative aspects of the stocks being included in the index.  However, individual investors should strategize around some of the demonstrated weakness and strengths of companies added to and dropped from the Nasdaq 100 Index.

Tesla Downside Targets

With Tesla being added to the Nasdaq 100 after the stock has climbed a parabolic wall of worry, it seems fitting that we are now able to project downside targets for the stock applying Edson Gould’s Speed Resistance Lines (SRL).  Below is the SRL for Tesla Motors as of July 10, 2013:

image

Few stocks that we have run the SRL on had such an extraordinary climb in price.  Even our Netflix SRL (found here) from December 3, 2010 had a more gradual rate of increase.  Based on Edson Gould’s SRL, TSLA has a conservative downside target of $64.56 while the extreme downside target is set at $41.77.  There is the off-chance that TSLA could go as low as $30.  However, this interpretation cannot be taken into consideration until TSLA reaches the $41 level.

Keep in mind that falling by half is not an easy task.  As was the case with our Netflix SRL from December 3, 2010, NFLX climbed +61.08% before falling below both our conservative and extreme downside targets.  We don’t short stocks based on SRL.  Instead, we consider buying stocks once they achieve our downside targets.

With Tesla Motors being added to the Nasdaq 100 Index after having an increase in price by +264% in the last six months, there will be plenty of action for this stock in the short and long-term.

Netflix Added to the Nasdaq 100…Again

We have always maintained that those who administer the composition of stock indexes such as the S&P 500, Dow Jones Industrial Average, Nasdaq Composite do so in the fashion of rank speculators. As further proof, it was announced that Netflix will be re-introduced to the Nasdaq 100 Index (found here).  Below is the charting of Netflix being added and dropped from the Nasdaq 100 Index:

image

In our article titled “Virgin Media Gets and Offer and Other Important Lessons” we said:

“Look for Netflix (NFLX) to be one of the two stocks added to the Nasdaq 100 index as the stock is twice the price that it was when it was booted from the Nasdaq 100 Index in December 2012, less than two months ago.”

In our article titled “Nasdaq 100: 2012 Re-Rank Review”, regarding the 2011 changes to the index, we said:

“As was the case in previous changes to the Nasdaq 100, the stocks that were added could not exceed the returns of the stocks that were dropped from the index.”

Also regarding the 2010 changes, we said:

“In the middle of a bull market run, the stocks that were added to the Nasdaq 100 Index on December 20, 2010 (found here) have underperformed by a wide margin when compared to the Nasdaq 100 over the last 2 years.”

Finally adding:

“However, as we've indicated with the Dow Industrials in the past (found here and here), being added to an index usually occurs when a stock has already seen its best performance and is far likelier to decline than rise over the medium term (1-3 year period).”

The Nasdaq 100 and the Nasdaq Composite Index are not below their respective 1999 peaks because the companies in the index haven’t rebounded.  Instead, as we’ve demonstrated regarding the Dow Industrials from 1929 to 1954, the indexes are below the 1999 peak because the selection of stocks to be added to the index at their high price and popularity instead of near their low price and solid valuations.

image

Virgin Media Gets An Offer and Other Important Lessons

On February 5, 2013, Virgin Media (VMED) was given a buyout offer at $47.87 per share by Liberty Global (LBTYA).  Virgin Media is already a member of the Nasdaq 100 Index while Liberty Global was recently added  to the same index on December 14, 2012 (see Nasdaq 100 re-rank here).

Virgin Media was featured in our Nasdaq 100 Watch List Summary section on December 16, 2011 (found here).  Our worst case scenario for the stock was that it might trade as low as $13.28, it never came to be.  In fact, VMED never traded lower and has subsequently gained as much as +117%.

image

There are a couple of important observations about fundamentals that need to be addressed.  First, there weren’t any offers for VMED at the December 2011 low. This suggests that many corporations either cannot identify values at the low or that they are willing to pay nearly twice the price in the name of a “good values.”

According to Liberty Global’s President and CEO, “adding Virgin Media to our large and growing European operations is a natural extension of the value creation strategy we've been successfully using for over seven years.”  As much as the CEO of LBTYA talks of the value that VMED will provide, the chart below suggests that this was an ill-timed purchase or could have taken place at a better point in time.

 image

The chart above shows a time range from December 16, 2010 to the present.  What the chart indicates is that the best time to buy out Virgin Media was on May 15, 2012. At that time, LBTYA shares were at their height compared to VMED, as LBTYA was trading at more than 2 times the price of VMED. Alternatively, LBTYA could have made a similar deal at multiple points before December 2011.

Today, Liberty Global is only buying VMED at 1 ½ times the February 5, 2013 closing price, which is no bargain.  Making an offer for VMED on May 15, 2012 could have saved current shareholders of LBTYA a significant amount of dilution in the stock, as Liberty is going to issue at least 151 million shares to acquire Virgin Media.

Another issue that is worth pointing out is the all too popular valuation metric known as price-to-earnings ratio (definition here). When Virgin Media was on our Nasdaq 100 Watch List on December 16, 2011, the stock was trading at $20.95 with a P/E ratio of 67.58.  Today, Virgin Media trades at a P/E ratio of 33, or exactly half of what the stock traded at when the stock was within 1% of the 1-year low.  This epitomizes the mixed signal that P/E ratios generate for fundamental investors seeking to identify quality companies as indicated in our article titled “P-E Ratios: Lesson From Conflicting Indications”.

In light of the offer made by Liberty, we’d like to remind you to get your scorecards out because there are going to be at least two new additions to the Nasdaq 100 with the possible departure of Dell (DELL) and Virgin Media (VMED). Look for Netflix (NFLX) to be one of the two stocks added to the Nasdaq 100 index as the stock is twice the price that it was when it was booted from the Nasdaq 100 Index in December 2012, less than two months ago.

Review: Netflix and Herbalife

Netflix (NFLX) is the first stock under review.  Our prior work on this stock can be found here (September 22, 2011).

Continue reading

Edson Gould’s SRL: Chipotle Mexican Grill Downside Target Update

In a series of articles examining Edson Gould’s Speed Resistance Lines (SRL), we put some big name stocks to the test.  The test was to see if Gould’s SRL had any reasonable predictive ability to determine the downside targets for the stocks in question.  The results have been astounding and are well worth your careful consideration.

First, we will review the SRLs for Netflix (NFLX) and Green Mountain Coffee Roasters (GMCR) and the outcome of the analysis related to Gould’s indicator.  Next, we will review the updated Chipotle Mexican Grill (CMG) downside target.

The first stock that we applied the SRLs to was Netflix (NFLX) on December 3, 2010.  At that time, NFLX was trading at $205.90.  When the stock rose to the eventual peak of $298.73, we thought that maybe the SRL was a waste of effort.

However, almost one year to the day after we ran the SRL on Netflix, the stock had broke through our conservative downside target of $117.76.  Even more amazing, NFLX later declined below the extreme downside target that we set at $68.63.  Today Netflix trades at $66.56.  Because we’re not short-sellers, we did not take any position on the decline of the stock.  However, we were able to buy the stock at $62 and sell the stock at $100 in the subsequent rebound from the initial low.

The next stock that we applied the SRL to was Green Mountain Coffee Roasters (GMCR) in our October 25, 2011 review of Edson Gould’s formula.  At the time, GMCR was trading at $64.75 after declining –42% from the peak in the stock price on September 19, 2011.  There were some who said that the stock was a bargain and should be bought.  However, Gould’s SRL indicated that at minimum, GMCR was to decline to $59.93 and possibly decline to the $37.21 level.

In a May 2, 2012 revision of Gould’s SRL for Green Mountain Coffee Roasters (GMCR), when the stock was trading at $28.50, we suggested that the stock could trade down to $22.53 with and additional downside target of $8.30.  Today GMCR trades at $22.13 (see chart above).

In the same October 25, 2011 review of Green Mountain Coffee Roasters, we covered Chipotle Mexican Grill (CMG).  At that time, Gould’s indicator suggested that CMG had a conservative downside target of $200.59 and an extreme downside target of $114.16.  As we’ve indicated in the past, SRLs are based based on the highest price the stock attains. In this case, CMG rose as much as +45.70% since our October 25, 2011 article.  Below is the revised SRL for CMG.

image

Based on the high of $440.40, Chipotle Mexican Grill has a conservative downside target of $233.23 and an extreme downside target of $146.80.  We’re cautious about anyone who suggests that CMG is a “good buy” or “undervalued” at the current price. Already, we’re within striking distance of the $233.23 conservative downside target as CMG trades at $280.93 after hedge fund manager David Einhorn recently recommended selling the stock short (article found here).  If past use of SRL is any indication, when CMG declines below the upward trending conservative downside line, you can be assured that the stock will hit $233.

Again, our purpose of using SRLs to determine the downside risk of a stock that we’d like to buy but don’t want to chase.  We’re willing to wait for the eventual decline or admit that we missed the boat on a great investment opportunity.  Again, we don’t sell stocks short because we’re interested in acquiring great companies at the best price possible.

Disclaimer: This piece is a continuation of the examination of Edson Gould's speed resistance line as explained in prior articles. This is not an endorsement to sell short at the current levels nor buy these stocks once falling below the extreme downside targets since the stocks have been randomly selected, at best.

Diamond Foods and Speed Resistance Lines

In retrospect, everything appears “oh so clear.”  We love history and attempt to interpret events from the past as a means to project into the future, assuming everything remains the same. Which is why the chart below seems so stunning to us.

The above chart of Diamond Foods (DMND), which has recently been blown out the water due to some accounting “irregularities” and the dismissal of the CEO and CFO, demonstrates the seeming power of Edson Gould’s speed resistance lines (SRL).  First, notice that the high of DMND was at$96.13, the starting point for all analysis of SRLs.  Based on the high of $96.13, the conservative downside target would have been the $48.47 level.  At the same time, the extreme downside target would have been the $21.00 level with an intermediate downside target of $32.04.

Amazingly, every downside target has been met with DMND reaching as low as $21.44 , on an intraday low.  By the way, little mention has been made of the accounting firm that signed off on Diamond Foods spurious books.

Already, in our prior work, we've seen a Netflix (NFLX) SRL, done in December 2010, give us an extreme downside target of $66.  Almost a year later, NFLX declined through the $66 level to fall to as low as $62.37 on November 30, 2011.  Another SRL that we ran before it came to fruition was Green Mountain Coffee Roasters(GMCR) on October25, 2011.  At the time, GMCR was trading at $64.75.  We estimated, using the SRL, that GMCR had an extreme downside target of $37.21.  The stock recently fell as low as $39.42 as reviewed in our February2, 2012 posting.

Below is the latest speed resistance lines for a stock that we've been curious about for some time, Clean Harbors (CLH).

Some could reasonably argue that we’re allowing correlation to equal causation, which we’d gladly confess to.  However, this explains why we a reactively seeking companies which we can run Edson Gould’s SRLs beforehand to ensure some semblance of integrity in the concept.  We want to run this examination through as many companies as we can before the actual decline.

A word of warning, the fact that a stock reaches the extreme downside target does not necessarily mean that the stock or index is considered to be a “buy.” Nor does it suggest that the stock or index cannot fall further.  Instead, it only reflects what potentially could happen on the downside.  Additionally, SRLs do not suggest a time frame that a decline is expected to occur.

For the NLO team, speed resistance lines appeal to our sense of considering the worst case scenario, which has saved us a lot of money simply by avoiding situations that would create significant loss.  Using history to assist us in projecting the downside risk is the primary reason we started examining speed resistance lines.

More about SRLs here

Apple (AAPL) and Speed Resistance Lines

As describedin our article on speed resistance lines (SRL) dated September 22, 2011 (found here), Netflix (NFLX) fell below our projecteddownside target of $99.58. Although we thought that the stock would be worthconsidering below such a level, we had to concede that, “...the difficulty may be that thesentiment that pushed the stock price to $298.73 would likely be just theopposite to push the price down.” Assuming the purchase of thestock at $99.58, an investor would have gained 21.10% based on the currentprice of $120.59.
Naturally, wewondered what Edson Gould’s speed resistance lines would say about AppleComputer (AAPL). The very first thing that we look for, to determine speedresistance lines, is the most recent peak in the price.  Because AAPL is continually making new highs,we only need to use the latest price of $455.68 as our starting point.

Based onGould’s work, Apple (AAPL) has a conservative downside target of $230.09 and theextreme downside target is $151.89.  Whenwe ran the same calculations on Netflix (NFLX) in September 2011, we made aseemingly innocuous error.  We overlookedthe fact that NFLX had a lower support line (red line) at the price level of $85.  In this case, we have denoted AAPL’s supportline (also in red line), at $117.05, as a potential downside target for thestock.
As the priceof Apple increases, so too does the SRL lines based on the work ofEdson Gould.  The rampant enthusiasm for AAPLsuggests that the stock isn’t likely to decline to the indicated levels anytime soon.  However, when and if you seeAAPL start to make a swan dive, the levels indicated are reasonable downside targets.