Category Archives: NEM

Dividend Cuts

On February 22, 2024, we saw the following posting that reminded us of the information that dividends convey:

Continue reading

Newmont Mining Price Momentum Indicator

Below we review the Price Momentum for Newmont Mining from 1982 to 2024 under various scenarios.

Continue reading

Newmont Mining Price Momentum Indicator

Below is Newmont Mining (NEM) from 1984 to 2023 applying the Price Momentum Indicator.

Continue reading

Newmont Mining Price Momentum $NEM

Below is a chart of Newmont Mining Corp. from 1982 to 2022, reflecting Price Momentum data.

Continue reading

Gold Stocks Near New Low

This is the list of gold related equities that we track within 10% of the one year low.  We strongly recommend that you do your own research on these companies and assume that the downside risk is half of the current price, at minimum.

Continue reading

Our Strategy on Gold Stocks

Continue reading

Gold Stock Investors: To Beat Inflation Look to Food Processors, Producers and Distributors

We’ve long maintained the view that in order for long-term investors to beat inflation, the conventional wisdom of investing in gold and silver stocks is not the most advantageous way to benefit from what almost everyone believes is coming as a consequence of QE4ever.  While we favor the physical metals (especially silver) and their paper derivatives like (GLD) and (SLV), we’ve also claimed that a specific strategy is needed in order to get the most mileage out of gold and silver stock investing.  However, in order to really beat inflation, forget gold and silver stocks and instead consider companies involved in food processing, producing and distribution industries.

Before we can tackle our food processors, producers and distributors, we need to examine the well documented wealth destruction that has occurred in the gold stock sector in the last year despite the relatively slight decline in the price of gold. Below is a table reflecting the percentage range that many gold and silver stocks have experienced between their one year high and low.

Symbol Name 1-yr % range
NG NovaGold Resources Inc. -69.33%
MUX McEwen Mining Inc. -68.23%
SSRI Silver Standard Resources Inc. -57.35%
PAAS Pan American Silver Corp. -56.19%
KGC Kinross Gold Corporation -55.98%
BAA Banro Corporation -53.55%
AUQ AuRico Gold Inc. -53.13%
AEM Agnico-Eagle Mines Ltd. -51.78%
HMY Harmony Gold Mining Co. Ltd. -44.81%
ABX Barrick Gold Corporation -41.79%
GG Goldcorp Inc. -41.74%
NEM Newmont Mining Corp. -40.69%
AU AngloGold Ashanti Ltd. -37.81%
GFI Gold Fields Ltd. -36.32%
BVN Compania de Minas Buenaventura SA -34.03%
SLV iShares Silver Trust -30.46%
GLD SPDR Gold Shares -15.50%

In all instances, those who had invested in these stocks did not expect that they’d face the prospect of –30% declines in value before they’d realize a gain. In fact, many of these stocks are not at a break-even point if purchased a year ago. Naturally, this should lead inflationistas and gold bugs to feeling a high level of frustration with the belief that gold stocks are a true inflation hedge.

Some perpetual gold bull analysts/marketers argue that gold junior and exploration companies provide better investment opportunities as compared to the many large cap gold stocks like Barrick Gold (ABX), Agnico-Eagle (AEM), and Newmont Mining (NEM). However, the last year has been unforgiving to the larger junior and exploration companies as represented by the Market Vectors Junior Gold Miners (GDXJ) in the chart below:

image

As early as 2008, in an article titled “Why Gold Will Decline More than the Markets,” we’ve cautioned gold stock investors to be prepared for gold stocks to decline by a greater percentage whenever the general stock market, as represented by the Dow Jones Industrial Average (DIA) or S&P 500 Index (SPY), declines -10% or more.

Within the last year, the closest the Dow Industrials and S&P 500 came to a -10% decline was from April 2nd to June 1st when the indexes fell –8.63% and –9.93%, respectively.  Unfortunately, the Philadelphia Gold and Silver Stock Index (XAU) was already in a declining trend after having lost -22.85% from the April 8, 2011 high until April 2, 2012.  Despite this fact, the XAU Index managed to lose an additional –20.87% from April 2, 2012 to the May 15, 2012 low.

As an alternative to the “mines” of precious metal stock investing, we’ve recommended investing in food processors, producers and distributors that have a history prudent of dividend increasing policies to take advantage of the expectations of high inflation down the road.  Among the many companies that we’re currently following closely  in this sector are Hershey (HSY), ConAgra (CAG), and Sysco Foods (SYY).

With all the unexplained pain in the precious metal sector in the last year, companies like ConAgra (CAG), Hershey (HSY) and Sysco Foods (SYY) have continued to increase shareholder value, dividend payments and see steady gains in their stock price.  Although the last two years hasn’t been as favorable for Sysco Foods, HSY and CAG have managed to keep pace with the overall market.

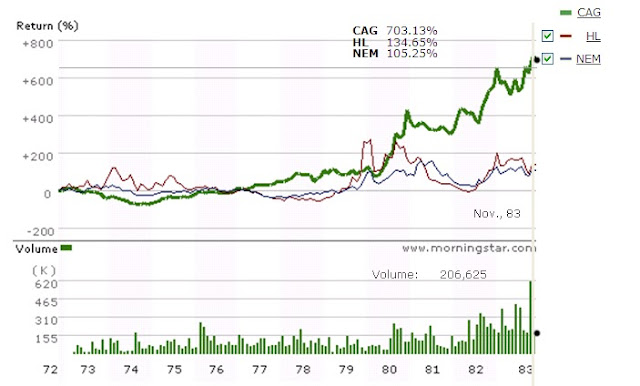
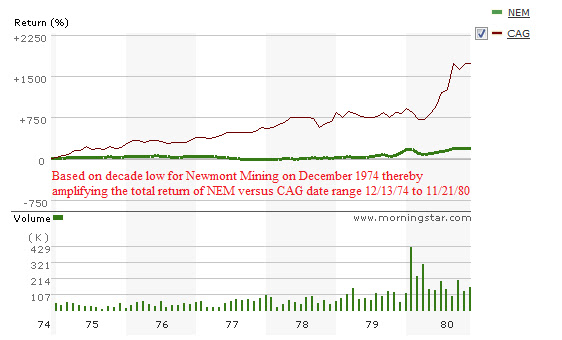
Our belief in the processors, producers and distributors is rooted in the performance of these stocks during the last precious metal bull market from 1970 to 1980 and beyond. In a piece titled “ConAgra: A History of Beating Precious Metals During a Commodity Bull Market,” we compared the performance of ConAgra to Newmont Mining (NEM) and Hecla Mining (HL) at the peak in the market in 1972, before the –42% decline in the Dow Industrials, and the subsequent peak in the commodity bull market in 1980.

What we found was that CAG matched the performance of NEM and HL by the end of the gold bull market in 1980 and went on to out-distance both stocks after the commodity bull market ended, by nearly seven time in 1983.  As a follow-up to our initial ConAgra observation in November 21, 2010, we can see the performance of the same three stock in the chart below:

image

The performance of ConAgra over the last 2 years has been exceptional in comparison to Newmont Mining and Hecla Mining. Today, ConAgra reported that first quarter net doubled and raised their full year expected earnings. CAG’s stock was up +6.20% on the news.  The news out of ConAgra suggests that processors, producers and distributors have much to gain from the coming inflation.

Precious metal enthusiasts will likely argue that the less than redeeming attributes of the companies selected (Newmont Mining and Hecla Mining) such as bad management, unprofitable properties, etc. contributed to the poor performance.  Another common refrain is, “look how my gold stocks have done in the last 3 or 4 months.” We believe such arguments are the equivalent of whistling past the graveyard.

Consider the following data points, since June 30, 1972 CAG, HL and NEM have generated the following returns, according to Morningstar.com:

  • CAG: +9,021.62%
  • HL:  -42.76%
  • NEM: +392.29%

When viewed from the perspective of trying to beat inflation, during the only proven gold bull market in recent history, gold and silver stocks don’t have the durability to truly beat inflation. For those that are ardent long-term value investors, you don’t really need to wade into the dark pools of precious metal stock investing where a mine can flood, a strike will break out, management can be slightly off with their estimates or the cost of production increases causing a stock to collapse in the middle of widely recognized gold bull market.  Instead, focus your research and due diligence in the food processors, producers and distributors that are trading near their respective new lows. You will be rewarded far beyond the high inflation period to come.

Barrick Gold or Newmont Mining?: Edson Gould’s Altimeter Makes the Call

There are few times that we’ll actually recommend individual gold stocks because much of the available statistical data supports the view that gold stocks are inferior investments when compared to products like SPDR Gold Trust (GLD) or the iShares Silver Trust (SLV), let alone the peace of mind with ownership of the physical metals. The following are the three most prominent examples of when gold stocks didn’t make the grade.

First,  in the period from 1925 to 1932, a basket of gold stocks declined as much as  -64.81% when Homestake Mining is included in the index.  In a article titled “The Lessons of Homestake Mining in Gold Bull and Bear Markets,” we’ve outlined a majority of the reasons why Homestake did so well when other gold stocks didn’t. If we exclude Homestake Mining from the 1925-1932 period, gold stocks declined –76.47% in an equal-weighted gold stock index as reflected below.

image

Second, in the period from 1940 to 1960, although interest rates on the 10-year Treasury bond doubled from 2% to 4% and the 3-month Treasury bill increased nearly 800%, Barron’s Gold Stock Index was virtually unchanged in the same period of time.  Additionally, investors who feared “the coming inflation” and stayed out of general equities missed an inflation adjusted gain of  nearly 400% in the Dow Jones Industrial Average (DIA).

Third, in the middle of the raging gold bull market from 1971 to 1980, gold stocks routinely underperformed the price of gold.  In our articles on Seeking Alpha titled “A Strategy Is Needed for Lagging Gold Stocks” and “Why Gold Will Decline More Than the Markets,” we reviewed the instances where gold stocks routinely underperformed the price of gold or the stock market in general.  Worse still, Barron’s Gold Stock Index peaked in 1974 and declined -66% only to return to breakeven five years later, just before the blow-off stage in the gold bull market.  We can now add the selloff from July 2011 to April 2012 to the long list of severe underperformance of gold stocks, during a bull market in gold.

image

With the above facts in mind, it isn’t taken lightly that we would recommend gold stocks at this point.  However, a strategy is needed in order to outmaneuver the gold stock gremlins. In a recent Seeking Alpha instablog, we outlined the short and long-term gold stock price activity using our Gold Stock Indicator (found here) which is nearing a dual “buy” indication.

In our last article on gold stocks to consider, we used Edson Gould’s Altimeter highlighting Agnico-Eagle (AEM) and Gold Fields (GFI).  In this article we’re going to apply Gould’s Altimeter to Newmont Mining (NEM) and Barrick Gold Corp. (ABX). Gould’s Altimeter reflects the relative value of a stock based on the current dividend that is being paid.  Although Newmont Mining and Barrick Gold Corp. are near one year lows and have consistent dividend policies, Gould’s Altimeter sheds a completely different light on matters, leaving only one company a compelling investment opportunity after additional due diligence.

According to Yahoo!Finance, Newmont Mining engages “in the acquisition, exploration, and production of gold and copper properties. The company’s assets or operations are located in the United States, Australia, Peru, Indonesia, Ghana, New Zealand, and Mexico.”  There are a couple of fundamental attributes that are less than redeeming for Newmont Mining.  First, Newmont has a price to earnings ratio of 67.  This exceeds the norm for anyone who would buy a stock only if it had a p/e ratio of 20 or less.  The next issue is Newmont’s dividend which exceeds the trailing twelve months earnings by 91%.  This could be an issue down the road if earnings and the price of gold do not increase fast enough.

Considering these issues, Edson Gould’s Altimeter below suggests that, although the price of Newmont Mining (NEM) could decline from the current level, a purchase of the stock at or below $55 is considered a reasonable value.

image

The most impressive aspect of Edson Gould’s Altimeter for Newmont Mining is the period from 1996 to 2000 when the stock was in a clear downtrend during the entire time.  Despite this fact, the Altimeter gave clear indications of when Newmont was relatively “undervalued” (lowest trend line) and also overvalued (highest trend line).

The next stock is Barrick Gold Corp. (ABX).  According to Yahoo!Finance, Barrick Gold is involved in “…the production and sale of gold and copper. The company has a portfolio of 26 operating mines, and exploration and development projects located in North America, South America, the Australia Pacific region, and Africa.”  With Barrick’s earnings at $4.48 and a dividend of $0.60, the dividend payout ratio sits at a paltry 13.39% of earnings.

image 

However, the reduction of the dividend near the middle of 2010 has had a major impact on how the Altimeter reflects Barrick’s relative value, which has played out in the movement in the stock price.  Had the dividend not been cut, Barrick would be characterized as though it were undervalued at the current price.  However, based on the Altimeter, Barrick is considered to be on a declining trend until the Altimeter falls below the 119 level.

In this instance, Newmont has the redeeming attributes that should carry the price much further than Barrick Gold Corp. based on the Altimeters above.

Note: As a word of warning, anyone compelled to invest in Newmont Mining should be mindful of the periods when the Altimeter declines by a wide margin from the lowest trend line (green).  This suggest that, in the short term, there is considerable downside risk.  However, the data in the chart for each period assumes that an investor were to buy at the moment the Altimeter first crosses below the lowest declining trend line.

The Coming Precious Metals Dividend War

On September 9, 2009 we wrote an article titled “Silver Should be the Focus.” In that article, we cautioned readers to “be mindful of the coming competitive dividend war between precious metal companies. I remember one, now defunct, gold company that paid out their dividend in actual gold. These are all gimmicks to lure investors in at a time when the rule of the day should be ‘head to the exits.’
The first salvos of the coming war to attract investors to precious metal stocks have be initiated.In April 2011, Newmont Mining (NEM) started what they deemed … the industry's first and only dividend policy linked directly to the realized gold price…"Naturally, this isn’t the first time that gold linked dividends has taken place, but it sells really well to those unfamiliar with gold stocks and their dividend policies.On September 19, 2011, Newmont Mining (NEM) announced a further enhancement of their “first ever” gold linked dividend policy with the following changes:


The enhanced policy will continue to link the quarterly dividend rate to changes in the gold price but will also provide an additional step up of 7.5 cents per share when the Company's realized gold price for a quarter exceeds $1,700 per ounce and a further step up of 2.5 cents per share (10 cents in total compared to the existing policy) when the Company's realized gold price for a quarter exceeds $2,000. At average realized gold prices below $1,700 per ounce, the current dividend policy remains unchanged. Newmont's quarterly gold price-linked dividend payments are based on the Company's average realized gold price for the preceding quarter.”
Not to be outdone, Hecla Mining (HL) announced on September 20, 2011 that they would have a dividend that is linked to the price of silver.Hecla’s silver-linked dividend policy is as follows:


The initial quarterly dividend under the policy is expected to be $0.03 per share of common stock ($0.12 per year), if Hecla's average realized silver price for the third quarter is $40.00 per ounce. All dividends, including those in the third quarter, would increase or decrease by $0.01 per share ($0.04 annually) for each $5.00 per ounce incremental increase or decrease in the average realized silver price in the preceding quarter.”
Newmont Mining (NEM) and Hecla Mining (HL) are soon to be joined by a crowded field of precious metal companies that are going to progressively up the ante.It will soon be indistinguishable as to who has the most sensible dividend policy and who has a compounding “money” losing machine.The race to offer attractive dividend payments has help from an unexpected source.
Unlike past precious metal bull markets, gold and silver stocks have stiff competition for investment capital in the form of gold and silver ETFs.In fact, more money is being plowed into the combined gold and silver ETFs than the stocks that have actual claims on getting the metal out of the ground.This presents a challenge for precious metal stocks that would normally issue shares in acquisition of other gold companies or expand their operations.In order to get the share price up, a competitive environment of dividend increases will lead many companies to ruin in an effort to attract new investors.
As described in our 2009 recommendation silver, one gold or silver company is going to “jump the shark” and make their dividend payments in the actual metal.When that time comes, it will be fair warning to protect your positions, though this may be indistinguishable to ebullient gold bugs at the time.
The single best dividend policy that we’ve seen among gold stocks, was held by Homestake Mining [HM] as describe in our October 31, 2010 profile of Homestake (found here).By 1933, Homestake had a 53-year history of continuous dividend payments.Not surprisingly, Homestake was among the 2% of gold stocks that rose in value from 1924 to 1932 due, in part, to their amazing dividend policy.
Because we’re in the early stages of a gold bull market, there is little attention being paid to the quality of the dividend policy.Gold and silver linked dividend policies appear advantageous when the price of the commodity is going up.However, such a policy can imperil a poorly managed company as the average price declines.
The most effective antidote to becoming collateral damage in the coming dividend war will be to buy the gold and silver stocks that are members of the Philadelphia Gold and Silver Stock Index or the Amex Gold Bug Index.Ironically, institutional support, by being the member of an index, will allow gold and silver stocks to survive hard times where others will unnecessarily falter.
Please consider subscribing to the New Low Observer. Thank you.

Watch List Double Take

After highlighting the performance of Sysco (SYY) during the commodity bull market from 1970 to 1983 on our recent NLO Dividend Watch List, we decided to see how another food distributor/producer stacked up against precious metal stocks.
The total return chart of ConAgra (CAG) below (courtesy of Morningstar.com) should be all you need to know about alternative investment opportunities to gold and silver stocks.  Like Sysco (SYY), ConAgra (CAG) has had incredible performance against precious metal stocks during a period when there is a lot of hype about the benefits of investing in stocks like Newmont (NEM) and Hecla Mining (HL).  If you believe that record high inflation is coming down the road and you're a long-term investor and don't mind a 4.28% dividend yield, research in ConAgra (CAG) just might be for you.
Source: Morningstar.com, date range: 11/20/1972 to 11/19/1983


Below is a chart of CAG compared only to Newmont Mining (NEM) at the very lowest price of NEM on December 13, 1974 to the high of NEM at or near the peak of gold stocks.  In this case, NEM has the bold green line while CAG has the thin red line.  Note that CAG has a total return almost 17 times that of NEM.


Please revisit New Low Observer for edits and revisions to this post. Email us.

2008 Transaction Overview

Below are all of my closed transactions for 2008 with the percentage realized gain or loss along with the percentage of the portfolio of each position. Closed positions are those that were done after the purchase of the stock took place. Therefore, purchases that took place in 2007 may have been close in 2008 while purchases in late 2008 may not have reflected a gain or loss until 2009. As an example, FDO was purchased in late December 2007 and sold late January 2008.
After transaction costs, the total return in the portfolio for 2008 was 14.35%. The dividend yield received on the account was 2.53%, with the dividend accounting for 17.62% of the total change in the account value. I am open to questions about the rational for selecting a particular stock at a given time during 2008. One thing that will be noticed about the differences between 2008 and 2009 is that 2009 has far fewer transactions.
Because this portfolio actually made money when the major indices lost close to 40% in 2008, I'm hoping to replicated this approach (mainly to avoid losing money in a market downturn.) I would appreciate any constructive insights or thoughts by you the reader. I'm hoping this will be an instructive moment for everyone involved. If you don't wish to post in the comment section then send me an email.I will be posting my transaction history for 2009 here shortly.

-Touc
Symbol
Close date
Total % Gain % of Portfolio
(FDO)
 
1/31/2008
 
10.65%
 
96.67%
(WSC)
 
2/11/2008
 
-3.93%
 
94.28%
(AIG)
 
2/28/2008
 
12.52%
 
82.65%
(CTAS)
 
3/13/2008
 
-3.81%
 
29.43%
(CDE)
 
3/13/2008
 
-12.42%
 
1.91%
(BSC)
 
3/14/2008
 
7.33%
 
26.10%
(HTX)
 
3/24/2008
 
1.73%
 
29.52%
(KGC)
 
3/24/2008
 
-16.73%
 
38.15%
(CTAS)
 
4/16/2008
 
-4.34%
 
31.11%
(GSS)
 
4/16/2008
 
-13.21%
 
1.77%
(NC)
 
7/23/2008
 
27.30%
 
32.11%
(MSA)
 
8/11/2008
 
19.02%
 
36.71%
(WIN)
 
8/14/2008
 
5.55%
 
27.27%
(BGG)
 
8/27/2008
 
1.27%
 
31.38%
(ANAT)
 
9/9/2008
 
-11.64%
 
28.26%
(EXPD)
 
9/9/2008
 
-5.51%
 
33.01%
(HPQ)
 
9/9/2008
 
115.03%
 
0.07%
(NSEC)
 
9/9/2008
 
-17.36%
 
3.08%
(TDS)
 
9/9/2008
 
-3.97%
 
38.10%
(NEM)
 
9/17/2008
 
3.27%
 
32.03%
(HL)
 
9/18/2008
 
5.70%
 
39.06%
(AIG)
 
9/23/2008
 
33.94%
 
38.27%
(ANAT)
 
9/29/2008
 
2.80%
 
29.25%
(ADM)
 
9/30/2008
 
-8.43%
 
20.77%
(WAG)
 
9/30/2008
 
-1.75%
 
44.09%
(TMR)
 
10/7/2008
 
-14.66%
 
11.36%
(NXG)
 
10/7/2008
 
-12.72%
 
11.40%
(AEM)
 
10/10/2008
 
-3.03%
 
15.58%
(FNM)
 
10/10/2008
 
-46.25%
 
7.14%
(GSS)
 
10/10/2008
 
-8.66%
 
12.11%
(JOF)
 
10/14/2008
 
2.34%
 
22.18%
(DOG)
 
10/15/2008
 
1.14%
 
43.23%
(AIG)
 
10/20/2008
 
-2.55%
 
66.35%
(BMI)
 
10/22/2008
 
-5.40%
 
35.38%
(EUM)
 
10/27/2008
 
5.26%
 
46.63%
(AEM)
 
10/28/2008
 
-4.08%
 
25.83%
(ABX)
 
10/28/2008
 
-2.92%
 
24.26%
(CTL)
 
10/31/2008
 
-9.93%
 
34.18%
(NC)
 
10/31/2008
 
-0.14%
 
43.42%
(NC)
 
11/7/2008
 
-12.16%
 
49.47%