On December 14, 2012, the Nasdaq OMX Group announced the names of the companies that would be added and dropped from the Nasdaq 100 Index (found here). This year there were ten companies added and dropped.
The ten companies added in 2012 were:
| Symbol |
Name |
Price |
P/E |
EPS |
Yield |
P/B |
% from low |
| ADI |
Analog Devices, Inc. |
41.35 |
19.41 |
2.13 |
2.9 |
3 |
23.88% |
| CTRX |
Catamaran Corporation |
49.2 |
72.04 |
0.68 |
- |
2.21 |
77.23% |
| DISCA |
Discovery Communications, Inc. |
60.82 |
22.23 |
2.74 |
- |
3.54 |
54.64% |
| EQIX |
Equinix, Inc. |
198.56 |
81.21 |
2.44 |
- |
4.28 |
102.01% |
| LBTYA |
Liberty Global Inc. |
60.31 |
74.64 |
0.81 |
- |
5.58 |
55.84% |
| LMCA |
Liberty Media Corporation |
110.5 |
7.65 |
14.45 |
- |
2.03 |
49.14% |
| REGN |
Regeneron Pharmaceuticals, Inc. |
179.71 |
83.39 |
2.16 |
- |
21.11 |
242.63% |
| SBAC |
SBA Communications Corp. |
69.62 |
- |
-1.36 |
- |
19.09 |
76.79% |
| VRSK |
Verisk Analytics, Inc. |
48.84 |
26.97 |
1.81 |
- |
57.62 |
27.06% |
| WDC |
Western Digital Corporation |
37.78 |
4.97 |
7.6 |
2.6 |
1.14 |
33.45% |
Another company that was added to the Nasdaq 100 Index was Facebook (FB). FB is acting as a replacement to the departure of Infosys (INFY) (WSJ article here) which is jumping ship from being a Nasdaq-listed company to a New York Stock Exchange-listed company.
The ten companies dropped in 2012 were:
| Symbol |
Name |
Price |
P/E |
EPS |
Yield |
P/B |
% from low |
| APOL |
Apollo Group Inc. |
21.02 |
6.05 |
3.48 |
- |
2.59 |
14.49% |
| EA |
Electronic Arts Inc. |
15.3 |
332.61 |
0.05 |
- |
2.21 |
42.06% |
| FLEX |
Flextronics International Ltd. |
6.09 |
8.3 |
0.73 |
- |
1.65 |
11.33% |
| GMCR |
Green Mountain Coffee Roasters Inc. |
40.32 |
17.68 |
2.28 |
- |
2.7 |
135.65% |
| LRCX |
Lam Research Corporation |
36.37 |
50.51 |
0.72 |
- |
1.27 |
16.68% |
| MRVL |
Marvell Technology Group Ltd. |
8.21 |
14.06 |
0.58 |
2.9 |
0.95 |
16.45% |
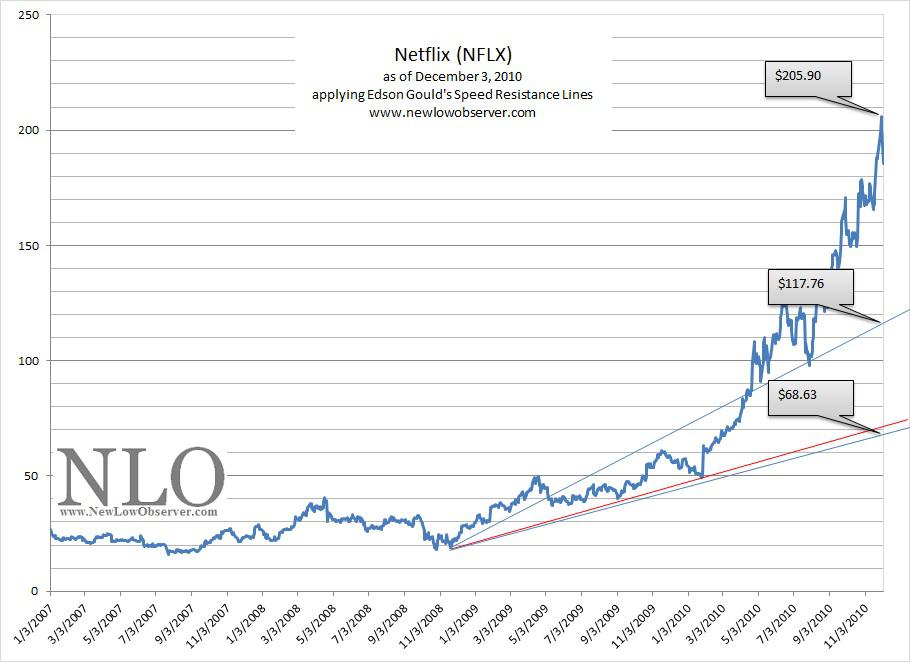
| NFLX |
Netflix, Inc. |
93.3 |
120.39 |
0.78 |
- |
7.17 |
76.67% |
| RIMM |
Research In Motion Limited |
14.04 |
0 |
-1.17 |
- |
0.76 |
125.72% |
| VRSN |
VeriSign, Inc. |
35.9 |
21.92 |
1.64 |
0 |
-209.82 |
9.42% |
| WCRX |
Warner Chilcott plc |
11.7 |
8.01 |
1.46 |
4.6 |
-4.14 |
7.83% |
Apollo Group (APOL) is finally be dropped after we were certain that it would be eliminated in the 2010 re-ranking (November 26, 2010 article here). Not being booted from the index meant an increase in price of over +60% from Dec. 2010 to Jan. 2012. Unfortunately, because the stock was in a rising trend for all of 2011, probably due to not getting dropped in late 2010, the stock has decline –39% from the Nov. 26, 2010 article and –63% from the Jan. 2012 high.
There are many analysts that think the Nasdaq Composite and Nasdaq 100 have a lot of upside potential since the previous highs were 4,900 and 4,600, respectively. Unfortunately, with the constant addition and subtraction of companies in the index, the Nasdaq Composite and top 100 may be mired at the current levels for some time to come.
We have outlined our thesis on the negative impact of adding and deleting companies to an index in our article titled “Dow Jones' Decline Largely Impacted by Index Changes.” We believe that this explains why the decline from 1929-32 was so deep and the subsequent rise to break even from 1932-54 took so long (article here). This was followed up with our article that highlighted the fact that recovery from the 1932 low was much quicker than the Dow Jones Industrial Index reflected in an article titled “Recovery From 1929 Crash Was Quicker Than Most People Think” (found here). A similar phenomenon of underperformance due to frequent changes with overvalued stocks is being experienced in the Nasdaq Composite and Nasdaq 100 index.
2011 Additions and Deletions Performance Review
In 2011, there were five companies added and five companies dropped (found here) to/from the Nasdaq 100 Index. The following is the 1-year performance of those companies.
| Symbol |
Name of companies added |
2011 |
2012 |
% change |
| AVGO |
Avago Technologies |
30.61 |
31.14 |
1.73% |
| FOSL |
Fossil, Inc. |
86.36 |
90.67 |
4.99% |
| GOLD |
Randgold Resources |
108.51 |
99.65 |
-8.17% |
| MNST |
Monster Bev. (prev. Hansen Nat.) |
48.57 |
53.38 |
9.90% |
| NUAN |
Nuance Communications |
24.74 |
22.01 |
-11.03% |
| Average change for companies added to Nasdaq 100 index: |
|
-0.51% |
| |
|
|
|
|
| |
|
|
|
|
| Symbol |
Name of companies dropped |
2011 |
2012 |
% change |
| FLIR |
FLIR Systems, Inc. |
25.67 |
20.36 |
-20.69% |
| ILMN |
Illumina Inc. |
28.37 |
51.22 |
80.54% |
| NIHD |
NII Holdings Inc. |
20.23 |
6.32 |
-68.76% |
| QGEN |
Qiagen NV |
14.34 |
17.6 |
22.73% |
| URBN |
Urban Outfitters Inc. |
26.34 |
38.6 |
46.55% |
| Average change for companies dropped from Nasdaq 100 index: |
|
12.08% |
As was the case in last year’s changes to the 2010 Nasdaq 100, the stocks that were added could not exceed the returns of the stocks that were dropped from the index. In the period from 2010 to 2011, the companies that were added lost –15.58% while the companies that were dropped lost “only” –3.45%. Among the companies added to the index last year, based on our analysis of previous trends, we had said the following of Monster Beverage (formerly Hansen Natural):
“We believe that the recent re-introduction of Hansen Natural (HANS) will be among the top performing stocks at the time of the next re-ranking of the Nasdaq 100.”
One year later, Monster Beverage provided the top gain of all the stocks that were added last year.

Another observation made of the 2011 Nasdaq re-ranking was the following:
“Of the stocks that were added to the index (2010 re-ranking), the non-tech related companies, Dollar Tree (DLTR) and Whole Foods (WFM), outperformed with gains of 48% and 40%, respectively. This suggests that the “basics” will outperform in the coming year…”
Monster Beverage (MNST) and Fossil Inc. (FOSL), both not technology-related, provided the largest intra-year moves by rising as much as +60% before coming back to earth. It should be noted that non-technology stocks performed the best over the last year. While Randgold (GOLD) is not a technology stock, it was added to the index based on the hype surrounding the rise in the price of gold and was a more reactionary inclusion suggesting that underperformance was likely.
2010 Additions and Deletions Performance Review
The distinction of being added to the Nasdaq 100 should be considered an achievement. However, the path usually isn’t so easy after being added to the index.
In the middle of a bull market run, the stocks that were added to the Nasdaq 100 Index on December 20, 2010 (found here) have underperformed by a wide margin when compared to the Nasdaq 100 over the same period. Of the seven companies that were added at the time, only two stocks (both non-technology companies) have gains.

Most investors would associate being added to the technology heavy Nasdaq 100 as an achievement. However, as we’ve indicated with the Dow Industrials in the past (found here and here), being added to an index usually occurs when a stock has already seen its best performance and is far likelier to decline than rise over the medium term (1-3 year period).
| Symbol |
Company |
2010 |
2012 |
% change |
| AKAM |
Akami |
50.39 |
39.2 |
-22.21% |
| CTRP |
Ctrip.com |
40.96 |
18.43 |
-55.00% |
| DLTR |
Dollar Tree |
28.12 |
39.44 |
40.26% |
| FFIV |
F5 Networks |
136.64 |
93.77 |
-31.37% |
| MU |
Micron Tech |
8.14 |
6.67 |
-18.06% |
| NFLX |
Netflix |
186.24 |
84.8 |
-54.47% |
| WFM |
Whole Foods |
51.35 |
90.66 |
76.55% |
| |
|
|
Average |
-9.19% |
| |
|
|
|
|
| NDX |
Nasdaq 100 |
2223.04 |
2647.57 |
19.10% |
All of the companies listed above are great for their own reasons, however, as a group the average return was –9.19% while the Nasdaq 100 Index managed to increase over +19% in the same 2-year period.
Nasdaq 100 Summary
-
The Nasdaq 100 cannot exceed the highs of 1999-2000 if the index is constantly adding high priced and overvalued stocks while at the same time taking out fairly valued and underpriced stocks.
-
Although more popularly known as a technology index, the Nasdaq 100 addition of companies that are not in the technology sector are expected to perform better than those associated with technology over the next 2-3 year periods.
-
Former Nasdaq 100 stocks that are being dropped from the index should be considered as potential investment opportunities based on their fundamental attributes.


