Category Archives: market share

Chart of the Day: Nyrstar NV

According to Yahoo!Finance, “Nyrstar NV engages in mining, smelting, and producing zinc, lead, and other base and precious metals primarily in Europe, Australia, Canada, the United States, and Latin America.”

image

The Study of Failure

“The basic lesson from their failure has been that what worked for the Japanese in cars and semiconductors - a headlong rush to seize market share - turned out to be far more expensive, and ultimately futile, in the securities industry (Sterngold, James. "Japan's Washout on Wall Street." New York Times, 11 June 1989. Infotrac Newsstand. Accessed 17 Dec. 2018.).”

See Also: Market Share and Market Price, And Never the Twain Shall Meet

Crypto Bubble? What Makes You Say That?

In a graphic provided by the cost information website HowMuch.net, there is a eye opening review of crypto currencies compared to well known companies like Facebook,PayPal, and others. 

image

On one side are companies providing services that seems to be increasing in demand. PayPal is an online payment system, Expedia is an online travel agency, Zillow is an online real estate resource, Brighthouse Financial is an insurance company, Groupon is an e-commerce marketing company.  On the other side, there are five different crypto currencies.

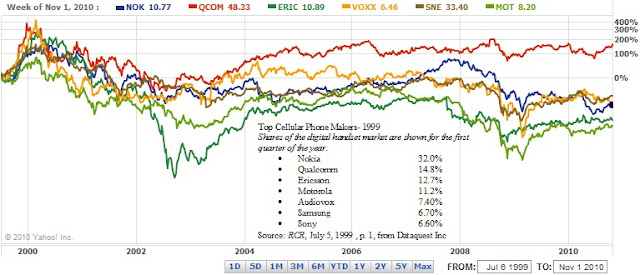
There is no way that so many cryptocurrencies can exist, simply to do the same thing.  There will have to be winners and losers.  This reminds us about the market share of cell/smart phones and the change that occurred over time.  In our November 7, 2010 article titled “Market Price and Market Share” we highlighted how much the cell phone market change from the the peak of the dot-com bubble to 2010.  In that time, the top cell phone makers (now called “smart” phones) changed in unexpected ways.

Top Mobile Phone Vendors 1999
Vendor market share
Nokia 32.00%
Qualcomm 14.80%
Ericsson 12.70%
Motorola 11.20%
Audiovox 7.40%
Samsung 6.70%
Sony 6.60%
source: RCR. July 5, 1999. Dataquest Inc. page 1. 
Top Mobile Phone Vendors 2010
Vendor 3Q market share
Nokia 32.40%
Samsung 21.00%
LG Electronics 8.30%
Apple 4.10%
R.I.M. 3.60%
Others 30.50%
Total 99.90%
Source: IDC Worldwide Quarterly Mobile Phone Tracker, October 28, 2010
Top Mobile Phone Vendors 2016
Vendor 3Q market share
Samsung 20.00%
Apple 12.50%
Huawei 9.30%
OPPO 7.00%
Vivo 5.80%
Others 45.40%
Total 100.00%
Source: IDC Worldwide Quarterly Mobile Phone Tracker, October 26, 2016

What we always like to point out is that Nokia was the biggest by market share in 1999 and 2010 and yet it wasn’t the most innovative.  Also, in 1999, Apple was nowhere to be found on the list of top five mobile phone vendors and yet it is among the top two today.  Samsung has managed to stay among the top 6 in spite of not having the cache of Apple or (dare we say it) Rimm.

Which brings us back to the cryptocurrencies.  Whoever is on top today is likely to not be a contender down the road.  In fact, we believe that a yet-to-be-determined entrant will likely supplant Bitcoin as the “it” cryptocurrency.  How are we going to find out the latest and greatest cryptocurrency?  It will take a deflation and inflation cycle to get us there. 

For now, keep in mind that there were hundreds of manufacturers of planes, trains, automobiles and mobiles phones before there were the big three.  Deflation of the boom in cryptocurrencies will go a long way towards separating the wheat from the chaff.

Market Price and Market Share, And Never The Twain Shall Meet

Many companies strive to obtain dominance in market share.  Market share is thought to be the critical element that will propel a company's stock price higher and dominance in an industry.  Unfortunately, that usually isn't the case.  As time moves on, a new company takes a commanding role in a market that they were never thought to be a part of.  Companies that are market leaders today are likely to become failed behemoths in a few years from now.  This is especially true in the technology industry where each new invention is meant to replace all prior technologies by combining all aspects of the old technologies into the new iteration (all things to all people).
In the example below, we show the chart and table of the leaders of the top cellular phone makers in 1999.  While we understand that the industry was in its infancy, it is interesting to see the performance of the respective companies in comparison to their leadership roles in the industry.  In the nearly 11 years since being on the list, none of the original companies have managed to increase their share price beyond their year 2000 highs. Only one company, Qualcomm (QCOM), has managed to increase its share price above the 1999 level.
Below we show the current mobile phone leaders with Nokia (NOK) still in the number one position while Samsung has gone from number 6th ranked in 1999 to number 2 ranked behind Nokia in 2010.


Top Five Mobile Phone Vendors, Shipments, and Market Share, Q3 2010
Vendor 3Q10 Unit Shipments 3Q10 Market Share 3Q10/3Q09 Change
1. Nokia
110.4
32.40%
1.80%
2. Samsung
71.4
21.00%
18.60%
3. LG Electronics
28.4
8.30%
-10.10%
4. Apple
14.1
4.10%
90.50%
5. R.I.M.
12.4
3.60%
45.90%
Others
103.8
30.50%
28.30%
Total
340.5
100.00%
14.60%
Source: IDC Worldwide Quarterly Mobile Phone Tracker, October 28, 2010
New entrants like LG, Apple (AAPL) and RIM (RIMM) are now vying for whatever portion of market share that they can. However, the focus on market share may not be so good in either the short and long run for their stock prices as represented in the chart above. With this in mind, those investment analysts who make the case that increased market share is justification for why a stock price should be increased or at a premium should review the same claims of similar companies in periods past.
  • Updated mobile data for 1999, 2010, and 2016 available here.

Please revisit New Low Observer for edits and revisions to this post. Email us.