Category Archives: Letter

On This Date: Richard Russell

On this date in 1980, Richard Russell said:

If You Leap, You Will Fall

“Let’s trot out an old but very useful market adage. It is that a trend is taken to continue in force until proved otherwise. We can be suspicious, we can hate the market, we can be out of the market, we can talk the market down to our friends and neighbors, but brother, we better not put out shorts until we have hard evidence that the bull trend is over and the bear is firmly in command-that is if we want to stay solvent (Russell, Richard. Dow Theory Letters. Letter 777. February 27, 1980. page 1.).”

Another way of saying the above is as follows:

“The wish must never be allowed to father the thought (Rhea, Robert. The Dow Theory. 1932. Barron’s Publishing. page 26.).”

Obviously staying solvent should be the primary goal.  However, you need not invest to “stay solvent.”  For all intents and purposes, even a person who “saves” in the traditional sense loses money by way of inflation and taxes. However, the fact that someone would chose to invest requires accepting that some or all money invested can be lost.

Most investors seem to get into the stock market or a specific stock because they think their investment will do well.  Seldom does an investor buy a stock hoping that it will lose money or languish.  Warren Buffett is among that rare group of (successful) investors who could make that claim.  In his annual report to shareholders, Buffett said the following:

“Our quiz for the day: What should a long-term shareholder, such as Berkshire, cheer for during that period? I won’t keep you in suspense. We should wish for IBM’s stock price to languish throughout the five years (source: 2011 Berkshire Hathaway Annual Report. page 6).”

Maybe Buffett can “afford” to have such a cavalier attitude about a technology stock like IBM after not buying any tech stocks which has cemented him as the world’s premier investor.  However, we believe that having Buffett’s thought process could help in dealing with not allowing the wish to father the thought. Otherwise, the concept of investing and hoping becomes a feedback loop that ends with inaccurate conclusions such as, “I’m never investing in stocks again, it is a scam run by manipulators and thieves.  I’m going to put my money with an advisor and let her deal with the headache when I start ‘losing’ money.”

Continue reading

Richard Russell Review: Letter 1248

On this date in 1998, Richard Russell published Issue 1248 of the Dow Theory Letter.  At the time, the Dow Jones Industrial Average was at the 8,872.79 level and the Transportation Average was at 3,517.52.

image

Russell opens his newsletter by pointing out the distinction between what the market “should be doing” versus what was actually happening.  What was happening?  The market was defying all long-term conventional norms.  In Russell’s word’s, “The conclusion -- always -- is exhaustion.”  Russell felt that the market’s rise was at a mania level and that investing in such a market was clearly a personal choice but that “values will out.”

Continue reading

Richard Russell Review: Letter 449

Bear Market Declines

“Historically, bear markets tend to last 1/3 to ½ as long as the preceding bull markets. Since this bear market is in the process of correcting the 17-year bull market of 1949 to 1966, a rough rule-of-thumb would be that the bear market could last five to eight years (and I will be optimistic in that I hope it lasts nearer to five than eight). However, the interesting part of the picture is that with four years out of the way, the worst the Dow Industrials have done is to decline from their 1966 peak of 995.15 to their 1966 low of 744.32, a total drop of 251 points (Russell, Richard. Dow Theory Letters. January 7, 1970. Letter 449. Page 1.).”

As a “rule-of-thumb”, the 1/3 to ½ (in terms of duration) extent of a bear market decline is pretty good and very consistent. The examples are many and the data is clear. First, let’s take the 1966 peak as the beginning of the bear market. From that time, the ultimate low in the stock market was December 1974. This was eight years from the 1966 peak. True stock market enthusiasts would argue that the bear market for stocks did not end until 1982, when the Dow Jones Industrial Average “permanently” broke above the mythical 1000 level and never looked back. Die hard market historians make a credible claim that the bear market did not end until the inflation-adjusted low achieved in 1978 or 1982.

However, based on the work of Jeremy Siegel (“The Nifty-Fifty Revisited: Do Growth Stocks Ultimately Justify Their Price?” [PDF download]), even if a person had bought the “Go-Go” or “Nifty Fifty” stocks at the 1966 or 1971 peak, investors would have achieved exceptional gains in spite of the high inflation rates until 1982 (by the end of 1995, in support of the “buy-and-hold” strategy).

image

The amount of time that passed from the 2007 peak to the 2009 low was 18 months. This was 38% of the bull market that preceded it from 2003 to 2007. The decline was severe and few would be in the position to stomach the extent of the decline, however, the rebound was inevitable and equally as vicious.

Our default view generally gravitates towards the stock market crash of 1929 to 1932. Even our cautiously optimistic analysis should be thwarted by one of the worst bear markets in history. However, taking note of the fact that the bull market “officially” began in 1921 and unofficially in 1907 or 1915, it is clear that the rule-of-thumb holds up.

Market enthusiasts will often retort that the bear market ends when the market recovers beyond the previous peak as the majority of investors buy near the last market peak. This is a valid point and yet, investing is made better by understanding that the majority is usually wrong and therefore should fight the urge to commit 100% of their investment capital as the market climbs higher and ensure that saved funds are 100% invested as the market falls. There are many benchmarks for determining how low is low enough before 100% of funds are committed so being close enough is better than succumbing to the fear of a falling market.

Continue reading

Richard Russell Review: Letter 854

Richard Russell’s Dow Theory Letter Issue 854 was published on February 9, 1983.  At the time, the Dow Jones Industrial Average was at the 1,067.42 level.

image

Economic events never occur in a vacuum.  Usually there is a string of events that leads from one event to another. One big event can lead to an even bigger event that overshadows the prior calamities that triggered the “big” event.  This issue of Richard Russell’s Dow Theory Letters covers  one market event that led to major crises that happened at different periods in time.  The two events are joined at the hip based on the decline of oil prices.  This led two separate major bailouts that resulted in structural shift in the way our brand of capitalism works.

Also, this Russell review will cover the topic of cycles in corporate cash and corporate indebtedness. We'll discuss, in brief, where we might be in this cycle.

The first event resulted in the Savings and Loan Crisis and is thought to have begun in 1986 due to the Tax Reform Act of 1986 culminating in the bailout of many banks and the eventual bankruptcy of the Federal Savings and Loan Insurance Corporation (FSLIC).

The second event resulted in the Mexican Peso Crisis with the outcome that major banking institutions like Citibank and Goldman Sachs needed to be bailed out.  It is important to note that the Peso Crisis is considered to be as a result of the peso devaluation in 1994.

The true roots of both the S&L Crisis and the Peso Crisis is the decline of oil prices after the inflationary peak in 1980-1981.  Richard Russell’s Dow Theory Letter Issue 854 highlights the seeds of destruction that were going to be much larger than even Russell could have imagined. However, if anyone wishes to understand how the snowball got rolling then this issue highlights the beginning.

The very first quote is an amazing insight of the American dependence of the high price of oil, Richard Russell says the following:

“We’re facing a situation (ironically) where the US is all for holding oil prices at a high level. The banks have lent huge sums of money both to private corporations and to oil producing nations-loans based on rising oil prices. If the oil price cracks badly,  the banks are going to have major problems. On top of that, the US depends on oil taxes (so called “excess profits” tax) for huge chunks of tax income. If oil prices crack then the profits for the oil companies will dive (which they are already doing) and the tax short-fall will be horrendous. (page 1)”

This commentary is staggering in the fact that it was so prescient.  The cracks in the armor of the American oil industry began in Texas when the easy money stopped raining down on oil dependent cities like Houston and Dallas.  In a 1988 issue of Dow Theory Letters, Russell had the following to say:

“With oil prices caving in, Texas now has more people leaving the state than coming in.( Dow Theory Letters. March 9, 1988. page 6.)”

The decline in oil prices led to a decline of jobs for that industry which resulted in a decline in real estate prices as people left the state of Texas.  Loans made by savings and loan institutions in the southwest U.S., to businesses and real estate investors, all went bad at the same time leading to the Savings and Loan Crisis (S&L Crisis).  The S&L Crisis cost several hundreds of billions of dollars and still exist as an off-budget item as part of our national debt.

The decline in the price of oil also crushed foreign economies dependent on the commodity.  The Mexican Peso Crisis, although officially listed as beginning in 1994, had its roots in the early 1980’s.  The natural outcome of this crisis was the bailout of large banking institutions like Citibank and Goldman Sachs when the government stepped in and bought the bad debt held by the bank’s all in gamble.

Likewise, the current boom in commodity rich countries (although somewhat cooler at present) like Australia, Brazil, Russia, China and India could experience significant shocks to their system depending on the level of loans made as “investments” by foreign banking institutions based on the potential of future growth.

Few understood or believed the impact and importance of high oil prices to the American economy at the time.  Even fewer understood the direct reliance of the U.S. government to high oil prices.  Then as now, the elevated level of the price of gold is being wagered on by the U.S. government in a similar way that it was done when we had high prices in oil.  The excessive printing of money through quantitative easing and other accommodative policies by the Federal Reserve is based on the elevated level in gold prices.

If the price of gold were to collapse then all bets are off.  Unfortunately, many believe that a collapse in gold couldn’t happen while the government is bent on printing money out of thin air.  However, the problem is that commodities like gold are prone to dramatic declines, especially when all bets are that it can’t or won’t happen.

Many die-hard gold investors/speculators are not making the connection between the government’s reliance and expectation of higher prices in gold.  Worse still, gold investors mistakenly believe that the U.S. government wants to see a lower price in gold and that the only direction is up due to accommodative policies.  This is far from the reality, as found out the hard way by the likes of billionaire money manager John Paulson.  Waiting in the wings are other big-time money managers who will likely get bailed out of their money losing bets on gold’s elevated levels.  Those that have leveraged their bets on gold and other commodities will be bailed out using taxpayers money and hidden as an off-budget items as part of the national debt.  Suffice to say, despite all the carnage in the period from 1980 to 2007, the stock market managed to climb over 12 times.

Next up is a comment on how U.S. corporations were strapped with debt. Russell says the following:

“In the shorter term, the argument for holding stocks is that a low rate of inflation will be bullish for stocks. But that argument was never used in a situation like the current one - a situation in which corporations are loaded with debt.  Whether these corporations can survive with debt ridden structure during a period of deflation remains to be seen. (page 3)”

This commentary is interesting because it was at the early stages of a secular bull market when the Dow Jones Industrial Average went from 1,000 to the peak of 14,164, an increase of over 12 times in 24 years (and this was just the “average”).  Now, we seem to be in the early stages of a secular bear market with just the opposite scenario.  Today, we’re being told of the immense cash hoard that corporations happen to be sitting on (WSJ article here).  Furthermore, interest rates are at or near zero and likely to rise as opposed to rates falling from double digit heights in 1980.

We’re not impressed with the claims of corporate strength based on off-shore cash hoards. We believe that what we’re witness to is the corporate equivalent of high tide which is inevitably going to be followed by low tide.  It is only a matter of time that it will be revealed that the idle cash of today will be the debt-laden corporation of tomorrow.  Those that are clamoring (in some cases suing) for companies to disgorge their coffers of excess cash in the form of “special” dividends will not think twice, twenty years from now, that they had unwittingly contributed to the decline of the company that they’ve targeted.

Richard Russell Review: Letter 554

Dow Theory Letters Issue 554 was written on February 7, 1973. At the time, the Dow Jones Industrial Average was indicated to be at the 968.32 level.  This was at a point prior to the Dow Industrials declining –40% while the Dow Transports declined –37% to the late 1974 lows.

Continue reading

Richard Russell Review: Letter 713

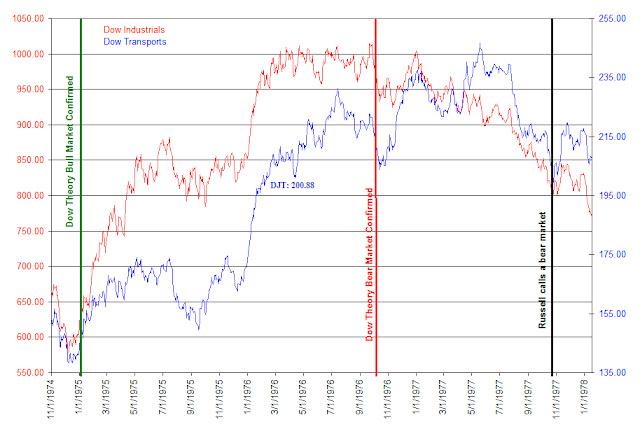
This review of Richard Russell’s Dow Theory Letters is dated November 9, 1977 when the Dow Jones Industrial Average was at 818.43 and the Dow Jones Transportation average was at 206.56.
  
Dow Theory
The first topic addressed by Richard Russell is Dow Theory.  On this topic, Russell says the following:
THE PICTURE: As far as I’m concerned, as far as my studies of the Dow Theory are concerned, a valid primary bear market signal was given when, on October 24 [1977], the Transportation Average confirmed the prior bearish indications of the Industrials. There are always those who cry, ‘The signal was late, it was too late!’ But no competent Dow Theorist in history ever waited for an actual bull or bear signal before taking action! For instance, we bought stocks in December, 1974 before the 1975 bull market signal, and we sold our stocks in March and April of this year well ahead of the October, 1977 bear market signal. We bought and sold on many clear indications, and the final Dow Theory signal merely confirmed what we had suspected and had acted upon.”
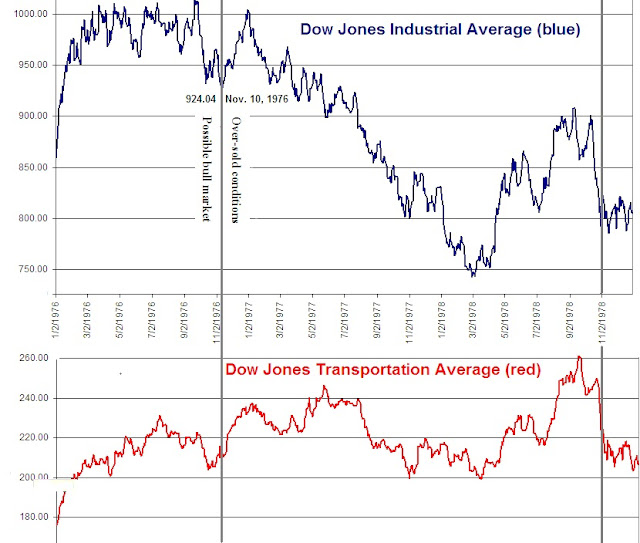
First, we’d like to address when a bear market signal is most likely to have occurred after the bull market signal that was confirmed in January 1975. From our perspective, the bear market was signaled on October 5, 1976 for the Transports and October 8, 1976 for the Industials when both indexes fell below the late August 1976 lows.
For whatever reason, Russell acknowledges that the call was late but doesn’t confirm how late he was.  Looking back at the October 16, 1976 issue of Dow Theory Letters  (Letter 678), in the first issue after we believe the bear market began, Russell makes no reference to the dual violation to the downside by both indexes.  Russell does allude to the Transportation Average level of 200.88 which he believed the market to be “weak” if the index fell below such a point.  On October 16, 1976, Russell said the following:
On the other hand, if the 200.88 level is broken, I would take this as a sign of unusual weakness, and I would take an even more cautious stance towards the market (which means selling more stocks and upping the bond portion of your portfolio even further.”
Naturally, there is a high level of inconsistency in suggesting that he would lighten up on his stock holdings if the Transportation Average fell below 200.88.  In the November 9, 1977 issue, Russell claimed that at the time the Transports fell below the indicated level he “sold our stocks in March and April of this year well ahead of the October, 1977 bear market signal.”
Although done in hindsight, our interpretation, almost a full year ahead of Russell’s call of a bear market, would have sheltered the investor from 3 times the loss.  This is consistent with our Dow Theory bull market indication in July 2009 and our more recent bear market call on August 2, 2011 (all NLO Dow Theory Bull Market articles) contrasted with Russell’s many bull and bear misinterpretations from March 9, 2011 (as partially outlined here).
The difference in Dow Theory Bear Market interpretations to the March 6, 1978 low:
Date
Transports decline
Industrials decline
Russell:
10/24/1977
-1.20%
-7.43%
NLO:
10/8/1976
-4.89%
-22%
Ironically, Russell says the following of those skeptical of the Dow Theory bear signal on October 24, 1977:
…others said that if it was indeed a bear signal, then probably the greatest portion of the market slide was over anyway. Two days after the bear signal, the market rallied sharply, as if in disbelief.
Since Russell’s call of a bear market was in fact long after the majority of losses were incurred, he only furthered the skepticism and misinformation of a useful tool for investors and businesses alike.  From the March 6, 1978 low to the April 27, 1981 high, the Dow Industrials increased by 37.87% while the Transportation Average increased 119.71%.  Alternatively, the Dow Industrials increased 23.17% and the Transports increased 117.55% after Russell’s indication that a bear market began on October 24, 1977.
Steps to a Dow Theory Bear Market signal:
  • July 14, 1976 Transports hit new high 231.27 but unconfirmed by Industrials
  • Sept. 21, 1976 Industrials hit new high at 1014.79 but unconfirmed by Transports
  • Oct. 8, 1976 both indexes fall below the late August lows-Bear Market begins
On page 3 of the DTL, Russell starts a Q&A with a question that has a very interesting answer:
Question: Suppose we get a rally that turns out to be a huge advance? Then what, Russell?
“Answer: We have a number of ‘fail-safes’ that work on either the bull side or the bear side of the market. The one I’m thinking about in particular is my study of the three moving averages of the Dow. At this juncture, the 13-week MA is a whopping 71 points below the 50-week MA, and we would need a crossing to get a major bull signal. Furthermore, the 4-week MA (short-term MA) is at 814, 29 points below the 13-week MA (intermediate-term) which is at 843. We need a crossing of the 4-week MA above the 13-week MA merely to get a ‘buy-alert.’ That would take time. So in the absence of a full over-sold bottom, I would say, ‘Skip any rally that may be forthcoming, or wait for the Dow’s moving averages to cross.’
There is a concern that we have regarding this section of Russell’s letter.  First, a “fail-safe” provision should address what actions to take if investments don’t work out.  Being out of stocks altogether isn’t investing nor is it working towards compounding, an overarching, albeit conflicting, theme in Russell’s work.  Therefore, Russell’s “fail-safe” observations based on a moving average requires reacting to a lagging indicator which compounds the delay in taking advantage of investment opportunities.  In fact, using such an approach causes investment activity, or lack thereof, to be made at the worst possible time.
In general, the use of moving averages for buy indications seems to be in contradiction to Dow Theory.  As pointed out earlier, moving averages are lagging indicators whereas the use of Dow Theory is supposed to act as a leading indicator.  Although Dow Theory provides bull or bear market indications not buy and sell recommendations, it can be effectively used to navigate market gyrations.  Based on the performance of the markets after Russell’s call of a bear market, it is clear that the mixing of moving averages and Dow Theory led to conflicting ideas of market direction that allowed Russell’s “Great” Depression bias to become the default reaction.
Treasuries
On page 4, Russell gives a quick blurb that had been overlooked for a long time in the mainstream media until recently.  Russell says the following:
I might also mention that if the public became wary of the banking system, there could be a major move out of bank deposits and into Treasury bills.
This has been the story of our experience in the market since 2008.  Furthermore, as the European Union struggles with their less than integrated banking system, demand for Treasuries grows.  This is in stark contrast to the belief that gold is king when there is a banking crisis.  We believe such a view is a holdover from when countries propped the price of gold with a gold standard.  The decline of gold and gold stocks in 2008 shows that there is another horse in the race for financial “safety.”
Gold & Swiss Franc
Russell points out something which seems extremely relevant to any investor in gold and that is the relationship between gold, gold stocks and the Swiss franc.  Russell says the following:
Now here’s what nobody (or let’s say very few people) know.  If I asked you “How’d you like to own Swiss francs at the early-1974 price?”  you’d probably jump at the chance.  Why would you jump?  Because the Swiss franc has been a hot item, a glamour currency.  Look at my next chart (bottom of p.5).  Note that the Swiss franc was about 31 cents in early-1974.  Gold at that time was $166 per ounce.  All right, the franc is now 45 cents or about 45% above its early-1974 price, in terms of dollars.  But gold is roughly the same price as it was in early-1974!  Now what the hell makes the Swiss franc better than gold?  The irony is that the Swiss franc is highly valued because it has such a high level of gold backing.
Nothing could be more instructive than the review of the price of gold, gold stocks and Swiss francs during what was perceived to be a gold bull market. Few gold bugs will acknowledge the amazing decline in the price of gold from early 1975 to the low of 1976.  The decline was nearly 50% of the peak price and lasted nearly two full years.  Likewise, the Barron’s Gold Average lost nearly 66% from the high achieved in 1974 to the low near mid-1976.  The Swiss franc, on the other hand, remained in the a narrow trading range or moved higher.
Russell was correct to question “…what the hell makes the Swiss franc better than gold?  Although Russell never mentions it, by pointing out the “uncharacteristic” rise of the Swiss franc at the time, we gathered that the activity of the Swiss franc implies that it is an indicator for the longer-term price of gold.  Because we’ve pointed out in many previous articles the fact that gold isn’t always the safe haven that it is fabled to be, when the next big decline in the price of gold occurs we will be watching closely the action of the Swiss franc for any indications of investment opportunities in gold stocks.  We have constructed what we believe to be a reliable indicator for the best time to buy gold stocks that are constituents of the Philadelphia Gold and Silver Stocks Index.  The action of the Swiss franc will act as a confirming indicator when the index is near a new low.
More Russell Reviews:

Richard Russell Review: Letter 762

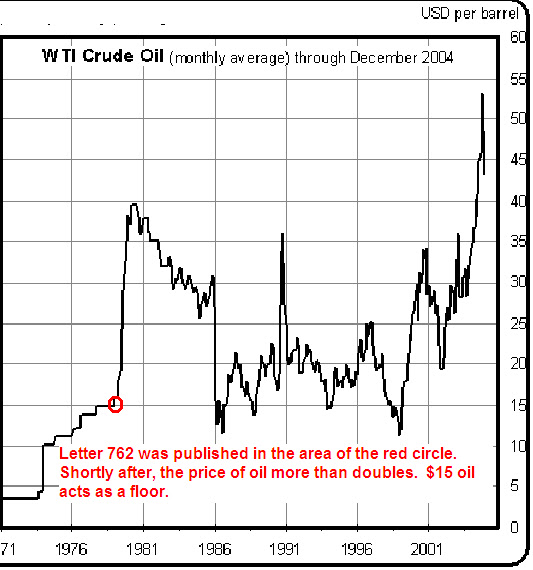
Letter 762 was published on August 1, 1979. At the time, the Dow Jones Industrial Average was indicated at 839.76. There were a couple of items that stood out as I read this newsletter.
Richard Russell said:
“As a matter of fact with Libya’s recent 10% cut in oil shipments and Algeria’s just announced 20% cut, I suspect that there’s an oil (and gas) glut building up now! The world is learning to cut back on fuel use—and fast, and this could turn out to be the shocker of 1979-1980.” Page 2.
In fact, it wasn’t long before oil prices reflected the glut that Richard Russell spoke of. Under normal circumstances, it would be difficult to see beyond the present crisis and think that it will end at some point. It seems that Russell was cognizant of the prospect, as remote as it seemed at the time. Unfortunately, as indicated in the chart below, $15 oil would become a base, or floor, instead of a ceiling.
One item that has been a longstanding issue with Richard Russell is reflected in the next quote.
Russell said:
“Last week I was asked this question: ‘Russell, if you could change any part of your stock approach over the past year, what would have done?’ My answer was, ‘There are many subscribers who are willing to speculate, and I think I have been too conservative and too stubborn on this issue. The change I would have made is that I would have offered speculative choices for those willing to assume the risk of buying in a market that is not over-sold and not in an ideal buying area.’” Page 2.
In addition to the previous remark by Richard Russell, he also said:

“I want to add that I personally am buying no shares here. I prefer to wait for the ‘ideal buying situation.’” Page 2.

The two remarks above have been the biggest challenge to Russell’s ability to adhere to Dow Theory or even his Primary Trend Index which was created to avoid potential market manipulation. Russell is infinitely waiting for the “ideal buying situation” while ignore individual values along the way.
Russell points out a fact that every investor should have ingrained in their mind before committing a single dollar to the stock market or any other potential investment opportunity. Russell said:
“Every investment must ultimately be valued on its return. In the stock market that means dividends. Ultimately, dividends must be paid if a stock is to be worth anything.” Page 4.
I thought that the following remark was profound.
“Now here’s an interesting aside on inflation. One of the reasons it’s so insidious is that as soon as a man starts protecting himself against it, as soon as he buys a house or a load of gold coins or a painting or a stamp collection-that man wants his inflation hedge to go up. He becomes (deep in his heart) an inflationist. Take housing: the value of total housing in this nation is $2.2 trillion (two thirds of these houses have mortgages). The last thing these home-owners want is a declining market. They are secretly in favor of rising prices and inflation.” Page 4.
Russell’s comment is right on target when it comes to the attitude of most people. It seems that everybody is an inflationist. There are few market participants or commentators who express the view that they hope their long position will decline in value. The NLO team happens to be among the few who, after going long a stock, are eagerly anticipating a decline in price. Shameless self-promotion aside, Russell’s commentary on the closet inflationists is truly profound.
Russell points out that if you’re in commodities but not in precious metal then you could be losing your shirt. Russell says:
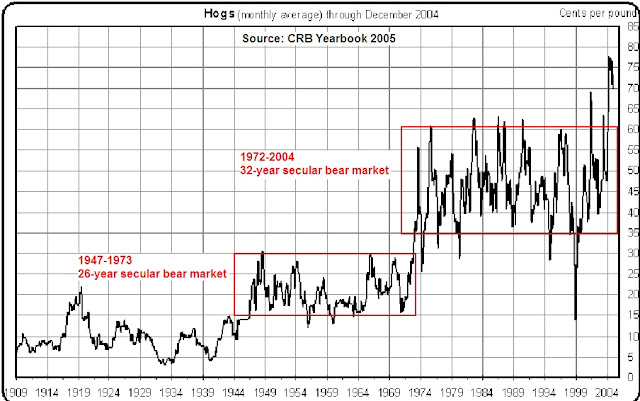
“Commodity traders have had one of their roughest seasons in years. If you weren’t in the metals, you probably ‘got killed.’ For instance, the October cattle contract is now down from 74.45 to 61, a drop of almost 18%. One trader told me that ‘it looks like the country is vegetarian.’ Live hogs are much worse, with the October contract dropping from 51 to 32 a drop of 37%. On piggies I was told that they act like ‘the whole world is going Jewish!’” Page 5.
This counters the belief that during inflationary periods, all commodities do well or go up in value. It should be noted that the declines that were mentioned by Russell could have been the equivalent of a temporary pullback or secondary reaction. Interestingly, monthly hog prices traded in a wide range from 1972 to 2004 as indicated in the chart below. Suffice to say, anyone involved in commodity trading should be willing to accept even greater losses than the 50% that we expect for long positions in stocks before seeing any gains.
On the topic of interest rates Russell says the following:

“To the casual observer, it looked like a world embroiled in an interest rate war. And the fact is that rising inflation is being fought all over Europe and Japan- via an interest rate squeeze. The US is a frightened and reluctant follower.

“A few weeks ago Germany raised her bank rate. At the same time Britain boosted her borrowing rate a whopping 2%. Last week the US raised its discount rate an insufficient .5% to a record 10%. Canada immediately followed with a boost to 11.75% in her bank discount rate. The Japan jumped her lending fee to institutions a full 1%.” Page 5.
My thoughts on this passage are that it seems fascinating that the US wasn’t taking the lead in interest rate policy. Especially in comparison to the countries that were mention. It may have been a purposeful attempt to adjust rates when it was absolutely necessary. Could you imagine interest rates jumping 2% at a time?
Russell indicated that as the world’s leading power, the U.S. with its excessive printing of dollars cannot continue unabated. Russell said that foreign holders of dollars would become anxious and “move towards the exits.”
Russell mentions the Gold/Stock ratio; which divides the price of gold by the value of the NYSE Composite. Of the rising trend of the ratio, indicating strength in the price of gold, Russell says:

“Day after day the ratio climbs higher, and it is clear to me that shortly, SOMETHING IS GOING TO GIVE.” Page 5.

With hindsight being 20/20, my thought is that what “gives” in this situation is high inflation unless Russell was proposing that all governments are going the way of hyperinflation. My observation is that what tends to break, when two normally divergent indicators are going in the same direction, is the one that appears to be the “strongest.” In this case the stronger component of the Gold/Stock ratio was gold which had been in a multi-year rising trend while the NYSE had been in a wide trading range for an extended period of time.
I do have concerns about the sensibility of a gold/stock indicator since I have presented the view that gold and stocks usually follow each other rather than move counter to each other. For the most part, we have seen gold lag on declines and lead on rises in the stock market. One thing I’m certain of, if the price of gold rises then the stock market isn’t far behind. There may be an occasional divergence but the overall picture is that gold and stocks generally move in unison.
More:

Richard Russell Review: Letter 742

Dow Theory Letters issue 742 was published on November 1, 1978. At the time, the Dow Jones Industrial Average indicated was at the 806.05 level. In this issue, Richard Russell discusses several topics that are very important to every Dow Theorist.
First, Russell states that:
…history shows that when bull (or bear) markets really begin, Dow Theory signals are generally greeted with derision, skepticism, and scorn-rather than wholesale agreement!” page 1
This comment is in response to the Dow Theory bull market signal that was given on August 2, 1978. In this case, Russell felt there wasn’t enough skepticism by market participants to warrant a need to trust the signal. I’m guessing that after 12 years of a secular bear market any good news about the market would appeal to the glass half-full crowd.
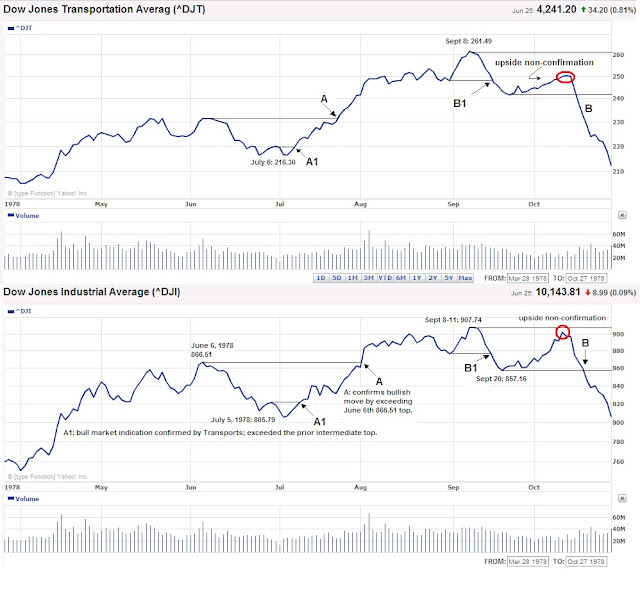
Letter 742 also has a chart (located here) of the Dow Jones Industrials, Transports, Utility Averages and NYSE volume. Upon closer inspection of the chart below, ranging from March 28, 1978 to October 27, 1978, you can find two confirmations of a bull market and one confirmed bear market indication as part of Dow Theory.

According to Russell, point A (August 2nd), on the Dow Industrials, was a false secondary peak or bull market indication. However, it should be noted that when the Industrials went above the June 29th peak of 821.64 (point A1) on July 21st it was a clear indication that the index was going to retest the previous high at point A.

After the bull market move upward a bear market indication was given when the Industrials and Transports fell below point B1 that corresponded to the August 31st low of 876.82 and 248.78 respectively. A bull market non-confirmation was indicated (red circles) in the fact that neither index could exceed the high of September 8, 1978.
Let’s do the math for a moment, point A1 gave a buy signal plus point A’s confirmation of the buy signal equaled a 9.62% rise by the time the market gave the bull market non-confirmation at Dow Industrials 900. The same timing applied to the Dow Transports would have equaled a gain of 13.64%. To my mind, this was in line with our view that any return close to 10% in less than a year is an acceptable amount to trigger a sell of any stock.
Russell also repeats a common attribute that he seeks in the market before considering going “all in.” Russell says:

I noted that every bull market in history had started from an over-sold base, but that this market had not seen a over-sold condition since late-1976.” Page 1.

In this remark, I have two thoughts that immediately come to mind which is reflected in the chart below. The first is that even after the 1974 bottom there was another time (1976) that was “most ideal” to buy stocks at over-sold levels, according to Russell. However, even though late-1976 was experiencing oversold conditions, it certainly didn’t mean that further declines were out of the question. After the ’76 bottom, the Dow Industrials had a short rally and then fell as low as 742.12, a decline of 19.69% from the 1976 lows, by February 28, 1978. Finally, the view that an over-sold base is a condition necessary for a bull market may not be accurate.

On page 2 Russell said:

Right now, I want all my subscribers to stay out as per my instructions in Letter after Letter.”

This suggests that after the January 1975 buy signal given by Russell, it was very difficult to keep a long-term position even though it was the absolute best time to “buy and hold” stocks.

The violence and rapidity of this smash has few precedents in stock market history.” Page 2.

When calculated to the November 14, 1978 low, the decline from September 8, 1978 equaled a drop of 13.5%. To me this doesn’t seem like all the much of a decline.

Somewhere in the period ahead, we are going to see the real ‘third phase bear market action’ in the Dow and most other stocks. True, during 1973-1974 the majority of stocks were pulverized in a slide that was comparable to 1929-32 in many ways. But the Dow lost less than 50% of its value at that time. My guess is that before the third or final phase of this bear market is over, we are going to see the Dow at drastic new lows, we’re going to see dividends cut across the board, we’re going to see very high interest rates, and we’re going to see something that this generation has never seen before-wholesale liquidation of debt in all sections of the economy, private, corporate and perhaps even government.” Page 2

“Each time it looks as if the ‘plug is going to be pulled,’ the bear market (with the help of huge infusions of monetary inflation from the Fed) pulls itself out of the hole.” Page 2

Russell was waiting for the third phase of the bear market. According to Russell, the Fed was holding the market up with the trade-off being higher inflation. My thinking is that a crash didn’t occur simply because the Fed was willing to accept higher inflation as a substitute for a crash. In addition, if the markets were to get a crash and record inflation at the same time it would be exceptional situation. The third phase decline that Russell expected never seemed to materialize on the scale of 1973-74 or greater.
Other Notes in Letter 742:
  • E. George Schaefer’s investment performance from 1949 to 1966.
  • James Dines book the “Invisible Crash
  • MC Horsey’s chart of an inflation adjusted Dow since 1960
  • Benjamin and Herbert Stein’s book “On the Brink” with reference to, of all things, the Chinese cornering the gold market
More:

Richard Russell Review: Letter 745

Dow Theory Letters Issue 745 was written on December 6, 1978.  At the time, the Dow Jones Industrial Average was indicated to be at the 811.42 level.  What stood out the most to me was the fact that Richard Russell made very clear commentary on the price of gold and the direction of stocks.  Russell made the following commentary:

"It [gold/stock ratio] is telling us that for the foreseeable future (until the next signal), if we do anything we should do it in stocks." page 3.

Anyone familiar with the stock market in 1978 would know that if you had bought a handful of stocks and didn't sell them until 10 years later you would have had a compounded annual growth rate of 8.73% (this takes into consideration the crash of 1987).  Russell's comments on being in stocks would have seemed to be very much on target.  However, it is his aversion to gold at this time that seems to contradict his earlier comments on gold.
In Letter 742 dated November 1, 1978, Richard Russell said the following about gold:
"Slowly, very slowly, it's dawning on the world that we're witnessing one hell of a bull market-in gold. I've been writing pages and pages about gold in each Letter, trying to get new subscribers in the metal (or the coins), trying to get older subscribers to STAY in gold.  Happily, a large percentage of my subscribers are now sitting with large gold positions.  And the paper profits (in terms of dollars) are mounting." page 5.

This commentary seems odd because in Letter 745, Russell goes on to say:

"At any rate, it is a bearish omen when the [gold] open interest stays high in the face of a persistent decline, and that is what has occurred." page 6

Russell called himself to task by asking the following question:

"Question: Russell, you were so hot on gold a few months ago.  Gold was 'real money,' you said.  Gold 'would save the system,' you said.  How can you just "turn off" on gold?
"Answer: I haven't turned off on gold, I've turned off on gold at this time.  The market isn't like your wife or your daughter who you love through thick and thin.  We're dealing here with correct procedure and purchasing power.  The fact that I advocate gold-backed currency has nothing to do with the fact that I think gold is in a bear trend over the coming months.  In this business, you had better learn that the trend makes you the money, not the item.  I'd rather buy Cesspools, Inc. if that stock was going up than IBM if IBM is heading down." Page 7
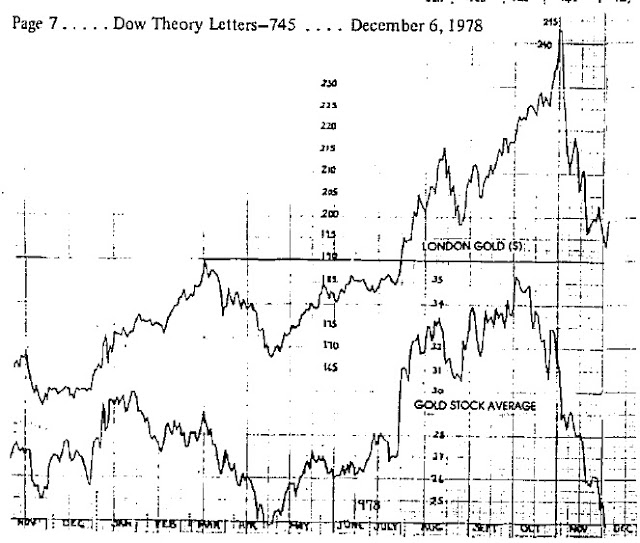
In retrospect, we know that gold went as high as $850 an ounce in January 1980.  However, it is interesting to me that Russell said that a bear trend was approaching "...over the coming months."  In Letter 745, Russell included a chart that compared the London Gold to the Gold Stock Average.


Russell's favorable comments of gold on November 1, 1978 were well off of the highs from the prior month.  However, since Russell was a practioner of Dow Theory and was using the London price of gold along with the equivalent of the XAU gold index to act as a confirming mechanism for the future price of gold, it should have been considered that because the London price didn't fall to the corresponding low set in April of 1978 that there must have been a non-confirmation of the downside trend.  Instead, Russell said the following:
"The GSA [Gold Stock Average] has collapsed, and is now down to its previous low for the year recorded last April.  Bullion has obviously held up better than the gold shares, but so far the downside non-confirmations by bullion have failed to halt the decline.  This kind of action is always indicative of a weak market, and it just seems that there are still too many optimistic gold-holders around." Page 6.
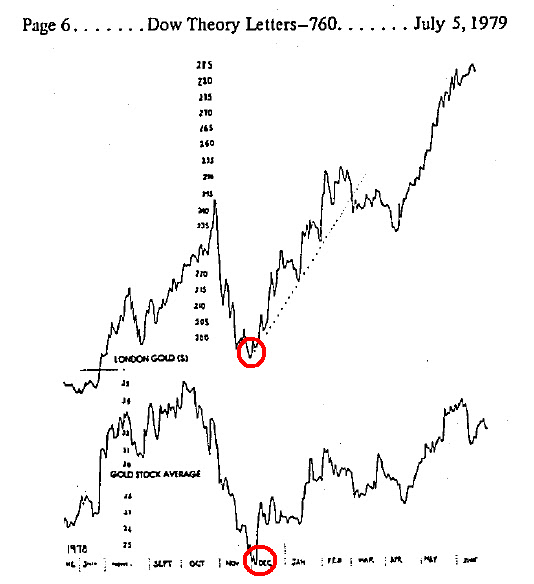
Is it possible that the gold shares are held by the public and speculators (weak hands) and the bullion is held by investors and "institutions" (strong hands)?    Somehow I think this relationship has some value.  I'm just not sure if Russell called this intermediate move correctly.  So I decided to search for an updated version of the London Gold and GSA comparison.  Below is what I found in the July 5, 1979 issue:


It should be noted that the exact bottom in the price of gold and gold stocks (red circles) coincided with the publishing of the December 6, 1978 Letter 745.
Also Worth Mentioning:
  • Russell said that "Greed and options don't mix."  My impression on this remark is that I always thought that the purpose of options is to get exaggerated gains with the trade-off being no equity.  Seems to me that greed and options go hand in hand.
  • Dow Theory Letters are available at http://www.dowtheoryletters.com/
More: