Category Archives: Industrial Production Index

Consumer Sentiment: June 2020

We keep going back to our August 4, 2019 posting where we said the following of consumer sentiment:

“A trend doesn’t define the future prospects.  However, we believe that the [consumer sentiment] declining trend has not completely played out.  This means that we expect that the economy and stock market will languish, in the best case scenario.”

The Economy

image

The Stock Market

image

With the stock market at a zero percentage change from the August 5, 2019 level and the Industrial Production Index at crash worthy lows similar to 2008/2009, we think that our targets have been achieved.  However, we’re still very concerned about the risks going forward. Continue reading

Inventory-Sales Ratio

Richard Russell’s Dow Theory Letters dated March 20, 1970:

“Sales and Inventories: The accompany chart from the Journal of Commerce (thanks to Humphrey Neill) shows an interesting picture, the critical sales to inventory ratio. When business is expanding, and we note on the chart that the long upward rise in the FRB production index [Industrial Production Index] signifies that it has been expanding, manufacturers tend to become increasingly bullish. Consequently, they also seek to build up their inventories in anticipation of increasing business (and as a hedge against inflation.)

image

“Then, as a slowdown in sales appears, it usually catches manufacturers either unaware or unable to adjust their inventories fast enough. Those who see the slowdown coming may cut back their inventory building in anticipations. This is termed to voluntary inventory cutting. But in most cases a belated recognition of a sales slowdown hits manufacturers. Then they are faced with a problem; sales are declining, and they have far too many goods coming in on order. The next step is canceling unwanted orders and cutting back on future orders. This is the process known as in voluntary inventory cutting, and it is undoubtedly happening now (page 5).” Continue reading

Industrial Production: March 2019

On October 30, 2017, we said the following of the Industrial Production Index:

“As each peak is exceeded, we’d expect that the prospects for a recession will be pushed out longer in time (though not necessarily a good thing for the economy, it gives time to prepare for the next recession).

“On the whole, we expect that the trend is in fact our friend and therefore believe that the February 2018 date would be a reasonable expected date for a recession, until proven otherwise.”

Any half decent analysis suggests that we change our tune with the actual conditions of the market.  After all, we were wrong about the first two of four expected dates for a recession.  In this case, the February 2018 and May 2019 expected recession dates have come and gone.  This leave the last two of four (“average” and “longest”) expected dates for recession remaining, based on the historical data from 1920 to the present. Continue reading

Industrial Production Index In Decline

As of November 2014, the Industrial Production Index* has been in a declining trend.

image

The beginning of the rising trend was established in June 2009.  When looked at from the percentage change over the previous year, there has been been only six out of 17 times when the Industrial Production Index had a negative declining trend AND a recession was not called by the National Bureau of Economic Research (NBER).

Continue reading

Our Call on the 7-Year Recovery

On August 21, 2009, we said the following:

“Based on the combination of the Dow Theory confirmation of July 23, 2009 and the IPI turning up from the June low, I will have to guess that the National Bureau of Economic Research (NBER) is going to proclaim June 2009 as the official end to the recession. The end to this recession will be lackluster and questioned from all corners.

“Additionally, the stock market will only follow the pattern of a cyclical bull market (bear market rally) within a secular (long term) bear market. I doubt that the general public will agree that the recession is over since jobs will not be as plentiful as the past.”

Below is the September 20, 2010 announcement from the National Bureau of Economic Research that the recession had officially ended in June 2009:

image

In addition, the jobs data has been lackluster as is par for the course but was anticipated in our August 2009 review.

image

Many claim that the employment data is rigged to reflect favorably for whichever politician that is in power at the time, so we have included the U-6 TOTAL unemployment data to verify if the economic environment really did turn around at or near the same period in time.

image

From all appearances, the turn in the economy did arrive at the time that we thought that it should.  There are critics who say that the U-6 TOTAL unemployment data isn’t as low as it was at the 2007 period and therefore we aren’t in a recovery.  However, to achieve a low in the U-6 TOTAL unemployment you would need the clearly obvious bubble economy that we experienced at the peak of 2007.  Anyone who wants the same U-6 TOTAL unemployment as the 2007 period also wants the subsequent bust that is required of such a period.

We haven’t had as much luck calling a top in the economy as we had in calling the bottom.  On two occasions we had Dow Theory bear market indications which turned out to be false and in one instance, we’ve had the Industrial Production Index in decline.  However, we haven’t had both occur at the same time allowing us to make the call that the economy was entering a recession.

What are the odds that such a coincidence (saying that the recession was over a year before the NBER, that no one would believe it, that unemployment would be lackluster and that a bull market was in effect) could occur?  Got lucky is all we can say.

Dow Theory: Are We There Yet?

In our last Dow Theory assessment dated May 17, 2015, we said the following:

“We’re looking for a bear market indication with a declining of the Industrials, Transports and Russell 2000 below their respective February 2015 lows followed by a decline below the October 2014 lows. In addition, we’re looking for the revised data in the Industrial Production Index to continue in the current declining trend.”

Since May 2015, there has been a lot of action but not a lot of substance.  Below is our Dow Theory update explaining why a bear market was not signaled in August of 2015 and what to watch for going forward.

Continue reading

Industrial Production Index

Below is a table with the number of instances when the Industrial Production Index declined at least five months in a row.  We have also noted whether or not there was a coincidence with the period of decline in the Industrial Production Index with the National Bureau of Economic Research (NBER) definition of a recession.

Dow Theory: Industrial Production Index Points to Recession

The Industrial Production Index (IPI) is an important lagging indicator that is part of Dow Theory as suggested in Robert Rhea’s book Dow Theory Applied to Business and Banking.  Although seldom mentioned by modern Dow Theorists, the IPI is useful in confirming the validity of Dow Theory indications.  This explains why a Dow Theory primary bull market was not announced by Robert Rhea in the period from November 1929 to April 1930.  Although the stock market was rebounding from the “Great” Crash of 1929, the IPI was still in a declining trend,  highlighted in the red bar as shown in the chart below.

image

In our last review of the Industrial Production Index on April 20, 2012, we had indicated that we’d need to see two consecutive months of decline in order for a confirmation of a recession while in a Dow Theory bear market.    Since that piece, we have not seen two consecutive months of declines.  However, as the data for the Industrial Production Index is continually updated, as much as six months into the past, we begin to see an emerging pattern. 

image

Since January 2012, the Industrial Production Index has traded in a narrow range, based on the revised data.  Already the Industrial Production Index is below the July 2012 high and approaching the April 2012 low of 96.4705.  Falling below the April low could indicate that the recession had begun as early as January 2012.  The Industrial Production Index has not been mired in such a range since the end if the recession was called in June of 2009.  Additionally, the preliminary data suggests that the economic recovery has hit a snag and may be on the cusp of a full blown recession (as defined by the National Bureau of Economic Research).

image

As can be seen in the chart above, the Dow Jones Transportation Average and the Industrial Production Index seem to have experiences similar troubles at around the same point in time.  True to form, the Dow Jones Transportation Index has gyrated widely to the downside with little ability to exceed the 2007 and 2011 highs.

From a historical standpoint, whenever the Industrial Production Index has peaked, 13 out of 17 times since 1920 (76.47%), the result was a recession call by the NBER.  All that is left at this point is for the Industrial Production Index to rise, fall or get revised significantly outside of the established range.  Rising or falling by a wide margin could definitively answer the question about whether we’re in a recession.  The range could be revised out of existence through the process of updating the figures. 

Our take is that there has to be a significant amount of economic growth through economic stimulus that dwarfs all prior efforts since 2007.  Outside of such efforts by monetary and fiscal actions, we believe that a recession could be considered in effect from either January 2012 or July 2012.

Is a Recession Coming?

Review

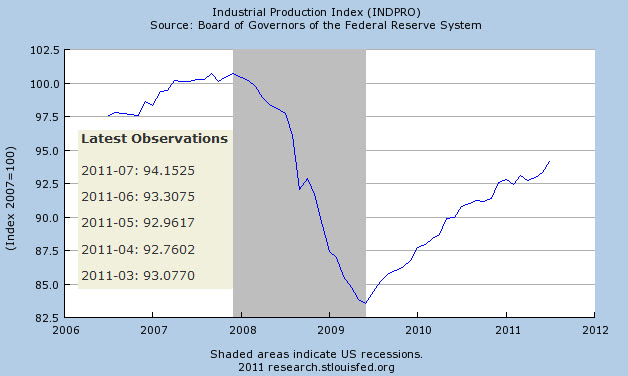
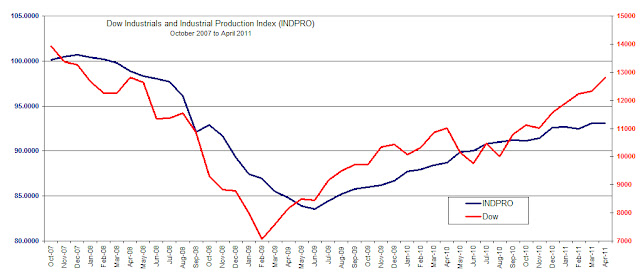
On August 23, 2009, using Dow Theory and the Industrial Production Index [IPI], we predicted that the National Bureau of Economic Research (NBER) was going to say that the recession ended in June 2009 (article here).  We specifically said the following:

“Implicit in my discussion of the IPI [Industrial Production Index] is that we are at a turning point for the economy. Based on the combination of the Dow Theory confirmation of July 23, 2009 and the IPI turning up from the June low, I will have to guess that the National Bureau of Economic Research (NBER) is going to proclaim June 2009 as the official end to the recession. The end to this recession will be lackluster and questioned from all corners.”

As has been the case historically, the announcement that the recession had ended came 1-year and 3 months after the fact (NBER announcement found here.)  Additionally, few have been satisfied with the definition of a recovery especially if it means that job growth and income increases have not been exceptional.

Now we are faced with what we believe could be the defining moment for a sustained stock market and economic decline worthy of being deemed (by NBER) a recession.  The factors that go into this assessment are based on our interpretation of Dow Theory and the vacillations of the Industrial Production Index.

Dow Theory

Starting with Dow Theory, we have the following established indications:

  • On August 2, 2011, Dow Theory indicated that we were in the initial stages of a cyclical bear market (article here).  At the time, the Dow Jones Industrial Average (DIA) and the Dow Jones Transportation Average (IYT) fell below their respective June and March 2011 lows.
  • On August 9, 2011, we indicated that a bottom had been reached and that a bear market rally to prior highs was due, within the context of a cyclical bear market (article here).
  • On March 16, 2012, we demonstrated that the divergence between the Dow Jones Industrial Average and the Dow Jones Transportation Average was confirmation that we’re in a Dow Theory bear market rather than a renewed bull market (article here).

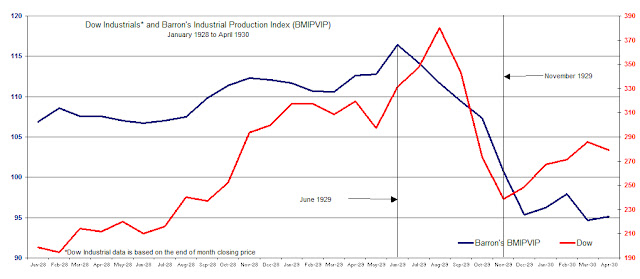
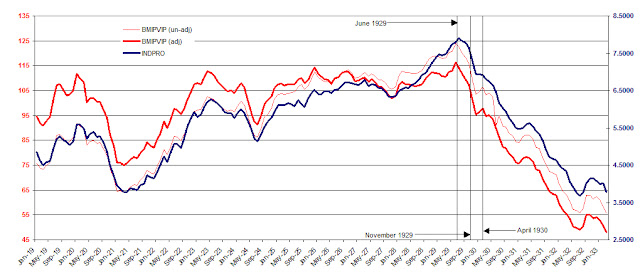
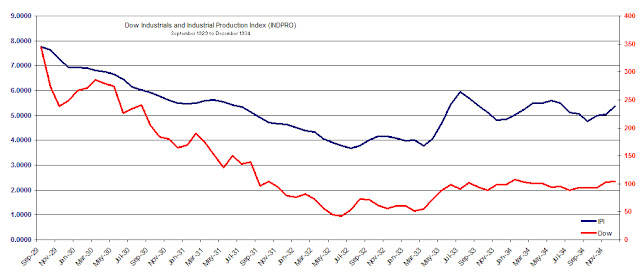
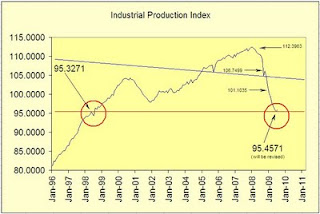
Generally speaking, Dow Theory acts as a leading indicator of the direction of the overall economy, with the Industrial Production Index following behind as confirmation.  In this case, this is the first month that the Industrial Production Index (IPI) has declined after the Dow Theory bear market indication of August 2, 2011.

Industrial Production Index

Historically, the Industrial Production Index has “averaged” a decline of 1.44 consecutive months in periods of an economic growth period.  This suggests that if the Industrial Production Index declines for two full months in a row, it would be enough to give us the all clear as to whether we can consider the economy as having reverted back into a recession after the rise from the June 2009 bottom.  This interpretation relies on Dow Theory also having a bear market indication.  In order for this to be the case, The Dow Industrials and Dow Transports would need to remain below their respective 2012/2011 peaks.

Month IPI data
August 2011 94.1845
September 2011 94.3800
October 2011 94.9389
November 2011 95.0939
December 2011 95.9095
January 2012 96.5705
February 2012 96.5731
March 2012 96.5685
Source: St. Louis Fed

What would the Market Impact Be?

So far, we expect that the recessionary period would have at least four consecutive months of declines in the Industrial Production Index (IPI) and a total of at least  7 non-consecutive months of declines within the period considered a recession.  This would be on par with the recession from July 1990 to March 1991.  At the time of the 1990 to 1991 recession, the S&P 500 (SPY) declined -19.61% and the Nasdaq Composite Index declined –29.90%.

However, The stock market typically leads the call of a recession by topping out first.  this suggests that potentially, the April 2, 2012 high for the Dow Industrials was the top and we're now in a declining trend at least until August/September 2012 to 10,611.59.

Again, our preliminary prediction is that if we see a second month of declines in the Industrial Production Index while the Dow Theory bear market indication is in place, we’ll have what will be considered a recession by the NBER which would be announced from 9 months to a year after the fact.

As a sidebar to the discussion of the possibility of a recession, the long-term gold stock positions that we've recently recommended which includes Agnico-Eagle (AEM),  Gold Fields Ltd. (GFI) and Newmont Mining (NEM) will require reduced exposure or sold off since gold and silver stocks tend to perform worse than the general stock market during a recession.

Note: Industrial Production Index data is subject to constant revisions by the Federal Reserve Bank.  We hope to reassess the Industrial Production Index based on the most updated information that is provided by the Federal Reserve.

Dow Theory: Bear Market Remains as INDPRO Surges

On Tuesday August 16th, it was reported that the current unadjusted Industrial Production Index (INDPRO) rose to 94.1525 for the month of July from the June level of 93.3075 which exceeded the March 2011 unadjusted high of 93.0943 (adj. 93.0770).  We'll have to watch closely in the coming months to determine if the INDPRO tops out with the July or August figures.
In our recent Dow Theory analysis of August 2, 2011, we indicated that we'd be surprised at an INDPRO figure that was above the March 2011 level.  As new information has come in (i.e. government revisions of the data) it appears that we have to allow for some time to pass before the stats are "finalized." We'll definitely provide updates as the revised data presents solid indications on the direction of the economy or confirmation of Dow Theory.
So far, the market still retains the Dow Theory bear market indication.  Additionally, there continues to be resistance, on the part of the Dow Jones Industrial Average, to convincingly close above the  first bear market rally target of 11,416.80.  We don't believe that it is advisable to take on new positions unless they are considered speculative in nature, which means that you're willing to accept all losses.
With a new cyclical bull market initiated when the Dow Jones Industrial Average and Dow Jones Transportation Average go above their respective highs for 2011, the missed opportunity for investment gains on new purchases between now and then are worthwhile.  When the next bull market indication is provided, our Dividend and Nasdaq 100 watch lists will point you to ideal investment candidates at reasonable values.  
Please consider donating to the New Low Observer. Thank you.

Richard Russell Review: Wrong About the Industrial Production Index

On June 6th, Richard Russell wrote an article on the Financial Sense website titled “Are We Fated to Live 1929-1930 All Over Again?” In that article, Russell discussed the Barron’s Monthly Index of Physical Volume of Industrial Production [BMIPVIP] reflecting on the movements of the index as compared to the Dow Jones Industrial Average in the period from the peak of the stock market in 1929 to the bottom in 1932.

Richard Russell pointed out that from November 1929 Barron’s Monthly Index of Physical Volume of Industrial Production [BMIPVIP] gave ample warning that the direction of the U.S. economy was still headed lower despite the rebound of the Dow Jones Industrial Average from November 1929 to April 1930 as depicted in the chart below.

Source: Persons, Warren. Barron's. May 15, 1933; pg. 18
Because the BMIPVIP was discontinued in 1938, we’ve used the closest approximation which is the Federal Reserve’s Industrial Production Index (INDPRO) found at the St. Louis Federal Reserve website.  In order to make a comparison to the two indexes, we checked the performance of the INDPRO to the BMIPVIP.  Below is the chart of the Barron’s adjusted and unadjusted BMIPVIP index and the Federal Reserve’s INDPRO from 1919 to 1933.

 It can clearly be seen that the Federal Reserve’s index (INDPRO), which is still in use today, can be used to measure against the Dow Jones Industrial Average.  Whenever the Barron’s index zigged the Fed’s index zigged, whenever the Barron’s index zagged so too did the Fed’s index.  We believe that using the Fed’s Industrial Production Index is the best and most consistent approximation to compare to 1929 to 1934 (shown below) as well as today’s market.

source: Person, Warren. Barron's. May 15, 1933. pg. 18.


According to Russell, the BMIPVIP hit its high in the month of June 1929.  This was a full 3 months before the peak in the Dow Industrials in September 1929.  The Federal Reserve index actually peak in July 1929 however, this was still ample enough time to gain inferences from the index’s movement.

Russell correctly observed that the BMIPVIP was critical in the evaluation of whether or not the economy and the stock market were on a rebound.  The great Dow Theorist Robert Rhea first introduced the use of Barron’s Industrial Production Index in his book Dow’s Theory Applied to Business and Banking.  Rhea used BMIPVIP as a means to confirm the signal provided by Dow Theory which contributed to his accurate call of a market bottom in July 1932.

Richard Russell’s point was that even though the stock market rallied strongly after the initial crash from the September 1929 high to the November 1929 low, the subsequent rebound was unsustainable when viewed from the perspective of the BMIPVIP or the INDPRO.  Unfortunately for Russell, his analysis of the BMIPVIP index and the Dow Jones Industrial Average comes to the wrong conclusion when attempting to bring actions of the past to market activity of the present.

Russell closes his article with the following thoughts:

“After April 1930, the post-crash rally ended, and a great bear market began. As the market turned down again, the US economy crumbled. By July 1930, Barron's Index of Industrial Activity had fallen to 85.5. The Great Depression was on.

“And I'm wondering about the comparison with today's action. Recently, we've seen the Dow climbing steadily from its March 2009 low, all the while with the economy neutral to weak. Then we see the Dow hitting a high last month in May with business today sluggish and even weaker than it was in January.

“And I'm wondering, ‘Are we fated to live 1929-1930 all over again?’ Is the stock market rally of March 2009 to May 2011 a repeat of the stock market rally of November 1929 to April 1930? In both instances, business weakened as the market climbed higher.

“But the scary part is that in 1930 when the Dow broke support, the Great Depression began and Barron's Business Index continued to plunge. Let's keep an eye on the March 2011 lows -- Dow......11613.30 and Transports ....4950.17.”

We’re disappointed that Russell’s remarks are uninformed and misleading with the intent of creating fear. First, Russell withholds the data necessary to test whether his assessment is accurate. Next, Russell implies that the Dow Industrials of today may be rising in spite of the Industrial Production Index falling. However, the Fed’s INDPRO has been in perfect alignment with the rise of the Industrial Average since 2007 as shown in the chart below.

Finally, Russell closes his article with an attempt at drawing the events of the past to the present.  Russell's effort lacks all substance when he speaks of targets for the Dow Industrials to watch for but doesn't introduce the Industrial Production Index nor it's relationship to 1929 and today. 

While the true test may come when the Dow Industrials and Industrial Production Index (INDPRO) attempt to exceed the prior high of 2007, there is little indication that Russell’s assessment is correct.

Please consider donating to the New Low Observer. Thank you.

Industrial Production Index

In my previous discussion of the Industrial Production Index (IPI), I clearly made a mistake in my interpretation of the “price” action of the index. On March 16, 2009, I said that if the IPI fell below 97.8399 then we would face the equivalent of economic “dark ages.”

In looking at the movement of the index, I dismissed the peak of 95.3271 on May 1998 and the trough of July 1998 as a significant technical support/resistance level for the index. This appears to be a critical oversight since the June 2009 low in the IPI at 95.4571 appears to have created a temporary support level. Even though the difference between 97.8399 and 95.4571 is only 2.32%, I feel it is necessary to identify this issue in my analysis as a potential learning opportunity.


Now for the shameless self-promotion, in my January 27, 2009 analysis of the IPI index, I said, "Based on this most recent move the IPI is expected to decline at least to the December 2001 level of 97.8399." This observation was about as accurate as you could get. Additionally, I said, “…we're in for at least another six months of declines in the IPI.” This assessment was off by 1 month which isn't bad. As mentioned before, the IPI hit a temporary bottom in June 2009. Some folks who snicker at the thought of technical analysis being applied to an economic indicator that isn’t even a critical component of the U.S. economy have every right to question the method. However, the fruitless effort, in this instance, “seems” to have been useful.

Finally, let’s look at where I think the IPI index is possibly going from here. In the 90-year history of the reporting of the IPI, there has been only one declining period in which the index had temporarily gone up and then down more than once (fake out.) We’ve already had one fake out of the index when it sharply rose in October of 2008 and then continued downward. I don’t see (revealing my limitations) this index falling below the current trough of 95.4571 until it does a Dow Theory retrace of at least one, and possibly all three, of the following upside targets:

  • 101.1035
  • 106.7499
  • 112.3963

Implicit in my discussion of the IPI is that we are at a turning point for the economy. Based on the combination of the Dow Theory confirmation of July 23, 2009 and the IPI turning up from the June low, I will have to guess that the National Bureau of Economic Research (NBER) is going to proclaim June 2009 as the official end to the recession. The end to this recession will be lackluster and questioned from all corners. Additionally, the stock market will only follow the pattern of a cyclical bull market (bear market rally) within a secular (long term) bear market. I doubt that the general public will agree that the recession is over since jobs will not be as plentiful as the past. However, from the standpoint of an economist the recession is over provided the IPI June low is sustained over an extended period of time.

Again, the IPI index generally lags the stock market by 6 to 9 months. Therefore, the index could continue to rise while the stock market has reversed to the downside. We’ll have to see just how much the most recent trough remains in place.Touc.

Monday's Article:

Dow Theory

Please revisit Dividend Inc. for editing and revisions to this post.