Category Archives: Homestake Mining

Richard Russell Review: July 5, 1974

This from Dow Theory Letters on July 5, 1974.

"What’s happening, what’s gone wrong? The answer: there's a giant squeeze in world liquidity, and it is scaring the devil out of investors, large and small, from one end of the globe to the other. Last week two German banks declared bankruptcy, while it was revealed (WSJ, June 26) that an oil-drilling "tax write-off" situation has turned into what may be the biggest swindle in US history. On June 27 trading in Westinghouse was halted at 12 1/8 (“you can be short if it’s Westinghouse”), and an hour later the President of the company announced that the outfit was solvent (all this while WX broke its 1962 low) (page 1)."

Those two German banks were Bankhaus I.D. Herstatt of Cologne and Bass & Herz Bankhaus.  This was a situation where the failure of Herstatt led to the failure of Bass & Herz and a host of other substantial losses. 

Chase Manhattan Bank was in possession of $156 million in Herstatt deposits.  This meant that U.S. creditors (namely Citibank’s British banking unit of Hill, Samuel & Co.) were seeking claims on these funds even though Chase Manhattan had no authority to recognize the claims. 

Seattle First National Bank (SeaFirst) was caught in a bind when they performed a $22.5 million transaction at their Swiss subsidiary and the funds were not transferred to the parent company hours before Herstatt was forced into bankruptcy.

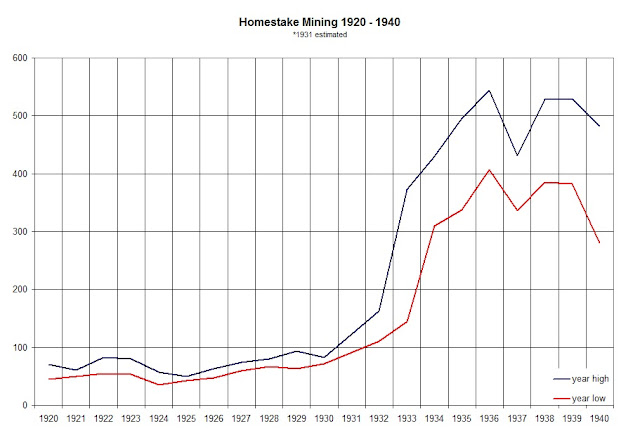
In classic scam fashion, the oil-drilling "tax write-off" scheme was named Home-stake Production Company of Tulsa Oklahoma.  Using the name “Homestake” tied the swindler with the success and stability of Homestake Mining while not having achieved anything of note. 

What made this swindle exceptional is the fact that people like Liza Minelli, Candice Bergen, and Buddy Hackett (as well as Congressmen) were involved in the money losing fraud.  The motivation for getting into these “tax write-off” schemes might have been inspired, at the peak, by articles like the following from Barron’s in March 1974.

image

“Bank shares at 10% yields mean that investor are scared of the banks (page 2).”

It was not long before this comment was published on banks that banks were on a mad dash to lure investors and analysts.  In a Barron’s article titled “Beautiful Balloon?” it was indicated that the 1970  amendment to the Bank Holding Company Act of 1956 led banks “…into related (and some not-so-related) financial areas.

image

It was those related financial areas that banks had “…been heavily engaged in financing real estate activities, and, despite the debacle among REITs, thus far have escaped essentially unscathed.”  It wasn’t long before those banks almost paid the price for their foray into REITs, until the government intervened.  This article from Barron’s should have been titled “Beautiful Bubble” as the collapse was in the early stages at this time and by July 5, 1974, there was more pain until December 1974, to the tune of –27.04% in the Dow Jones Industrial Average.

image

see also: Homestake Mining: The Exception that Proves the Rule

Homestake Mining from 1918 to 1968

Below is the price chart of Homestake Mining (HM) from 1918 to 1968. Continue reading

Barrick Gold or Newmont Mining?: Edson Gould’s Altimeter Makes the Call

There are few times that we’ll actually recommend individual gold stocks because much of the available statistical data supports the view that gold stocks are inferior investments when compared to products like SPDR Gold Trust (GLD) or the iShares Silver Trust (SLV), let alone the peace of mind with ownership of the physical metals. The following are the three most prominent examples of when gold stocks didn’t make the grade.

First,  in the period from 1925 to 1932, a basket of gold stocks declined as much as  -64.81% when Homestake Mining is included in the index.  In a article titled “The Lessons of Homestake Mining in Gold Bull and Bear Markets,” we’ve outlined a majority of the reasons why Homestake did so well when other gold stocks didn’t. If we exclude Homestake Mining from the 1925-1932 period, gold stocks declined –76.47% in an equal-weighted gold stock index as reflected below.

image

Second, in the period from 1940 to 1960, although interest rates on the 10-year Treasury bond doubled from 2% to 4% and the 3-month Treasury bill increased nearly 800%, Barron’s Gold Stock Index was virtually unchanged in the same period of time.  Additionally, investors who feared “the coming inflation” and stayed out of general equities missed an inflation adjusted gain of  nearly 400% in the Dow Jones Industrial Average (DIA).

Third, in the middle of the raging gold bull market from 1971 to 1980, gold stocks routinely underperformed the price of gold.  In our articles on Seeking Alpha titled “A Strategy Is Needed for Lagging Gold Stocks” and “Why Gold Will Decline More Than the Markets,” we reviewed the instances where gold stocks routinely underperformed the price of gold or the stock market in general.  Worse still, Barron’s Gold Stock Index peaked in 1974 and declined -66% only to return to breakeven five years later, just before the blow-off stage in the gold bull market.  We can now add the selloff from July 2011 to April 2012 to the long list of severe underperformance of gold stocks, during a bull market in gold.

image

With the above facts in mind, it isn’t taken lightly that we would recommend gold stocks at this point.  However, a strategy is needed in order to outmaneuver the gold stock gremlins. In a recent Seeking Alpha instablog, we outlined the short and long-term gold stock price activity using our Gold Stock Indicator (found here) which is nearing a dual “buy” indication.

In our last article on gold stocks to consider, we used Edson Gould’s Altimeter highlighting Agnico-Eagle (AEM) and Gold Fields (GFI).  In this article we’re going to apply Gould’s Altimeter to Newmont Mining (NEM) and Barrick Gold Corp. (ABX). Gould’s Altimeter reflects the relative value of a stock based on the current dividend that is being paid.  Although Newmont Mining and Barrick Gold Corp. are near one year lows and have consistent dividend policies, Gould’s Altimeter sheds a completely different light on matters, leaving only one company a compelling investment opportunity after additional due diligence.

According to Yahoo!Finance, Newmont Mining engages “in the acquisition, exploration, and production of gold and copper properties. The company’s assets or operations are located in the United States, Australia, Peru, Indonesia, Ghana, New Zealand, and Mexico.”  There are a couple of fundamental attributes that are less than redeeming for Newmont Mining.  First, Newmont has a price to earnings ratio of 67.  This exceeds the norm for anyone who would buy a stock only if it had a p/e ratio of 20 or less.  The next issue is Newmont’s dividend which exceeds the trailing twelve months earnings by 91%.  This could be an issue down the road if earnings and the price of gold do not increase fast enough.

Considering these issues, Edson Gould’s Altimeter below suggests that, although the price of Newmont Mining (NEM) could decline from the current level, a purchase of the stock at or below $55 is considered a reasonable value.

image

The most impressive aspect of Edson Gould’s Altimeter for Newmont Mining is the period from 1996 to 2000 when the stock was in a clear downtrend during the entire time.  Despite this fact, the Altimeter gave clear indications of when Newmont was relatively “undervalued” (lowest trend line) and also overvalued (highest trend line).

The next stock is Barrick Gold Corp. (ABX).  According to Yahoo!Finance, Barrick Gold is involved in “…the production and sale of gold and copper. The company has a portfolio of 26 operating mines, and exploration and development projects located in North America, South America, the Australia Pacific region, and Africa.”  With Barrick’s earnings at $4.48 and a dividend of $0.60, the dividend payout ratio sits at a paltry 13.39% of earnings.

image 

However, the reduction of the dividend near the middle of 2010 has had a major impact on how the Altimeter reflects Barrick’s relative value, which has played out in the movement in the stock price.  Had the dividend not been cut, Barrick would be characterized as though it were undervalued at the current price.  However, based on the Altimeter, Barrick is considered to be on a declining trend until the Altimeter falls below the 119 level.

In this instance, Newmont has the redeeming attributes that should carry the price much further than Barrick Gold Corp. based on the Altimeters above.

Note: As a word of warning, anyone compelled to invest in Newmont Mining should be mindful of the periods when the Altimeter declines by a wide margin from the lowest trend line (green).  This suggest that, in the short term, there is considerable downside risk.  However, the data in the chart for each period assumes that an investor were to buy at the moment the Altimeter first crosses below the lowest declining trend line.

Homestake Mining: The Exception that Proves the Rule

In order to better understand the relationship of precious metals and precious metal stocks it is critical that investors get familiar with the periods of peaks and troughs of the gold and silver markets. Without this knowledge hardened gold and silver investors will succumb to forces that will result in major losses of capital.
In a prior article on gold we gave an example of how gold stocks in general suffered their biggest percentage loss from 1924 to 1932. However, in that same period, one gold stock, Homestake Mining [HM], managed to not only defy the declining trend but increased in value beyond all expectation. In the period from 1891 to 1987, Homestake Mining increased in value from $9 over $5000 per share. Because it is our assertion that gold and gold stocks rise and fall with the general market (either leading or slightly lagging), we will demonstrate that Homestake Mining is the exception that proves the rule.
Homestake Stock Splits:
  • 8 for 1 1937
  • 2 for 1 1968
  • 2 for 1 1974
  • 3 for 2 1980
  • 2 for 1 1983
  • 2 for 1 1987
This article will address several specific reasons why Homestake Mining [HM] was able to increase in value from $71 to $528 in the period from 1920 to 1940. It is important to note that of the reasons that we provide, no one factor could answer for the rise of Homestake Mining. However, the extent of the combined characteristics far outweighed the concerns gold investors had about the alternative gold stocks during the same period, especially from 1924 to 1933.
There are two kinds of factors that affected the price of Homestake Mining [HM]. One set are those that Homestake Mining cannot control while the second set are those that can be controlled. Those matters not in the control of the management of Homestake Mining [HM] helped to provide a support for the price of the stock. At the same time, those actions taken by the management of Homestake helped to significantly boost the price of Homestake Mining. The combination of the two elements allowed Homestake to emerge as the best performing gold stock in the worst possible markets.
We’ll first address the issues that were not in the control of Homestake Mining [HM]. The most important matter not in the control of Homestake management was the fixing of the gold price. With the price of gold being fixed, the share price and earnings of gold stocks were considered to be stable. This was especially true when the price of other commodities were falling. Few gold bugs will take on the seemingly tabooed topic of the price of gold being fixed as the reason gold and gold stocks were a refuge to investors. However, this alone, being fixed, is the basis by which all myths of gold being a safe haven are built upon.
In more recent times, without a guaranteed price for gold, the commodity has fallen precipitously while gold stocks have been decimated. Some eternal gold bulls would say that during the market decline of 2007 to 2009 with the price of gold “only” falling 25%, in contrast to the Dow Industrials falling 40%, then it was an appropriate hedge. However, using the Philadelphia Gold and Silver Stock index (XAU), (a comparison of equity index to equity index) the decline was nearly 70% in a span of less than 1 year from March 2008 to November 2008. Gold was far from a source of stability during market panics of centuries past.
The next issue not in Homestake’s control was the limiting of the ability of the public to actually own (hoard) gold through the use of Executive Order 6102 issued by Franklin D. Roosevelt on April 5, 1933. This forced investors and savers in the U.S. to seek out the only alternative that existed which was gold equities. When markets seem to be falling apart, investors will seek out whatever happens to be the most stable option. Since owning gold wasn’t available the next best alternative was publicly traded gold stocks.
Also in 1933, President Franklin D. Roosevelt, through Executive Order 6260, authorized the U.S. Treasury to purchase gold at the highest traded world price allowing gold mining companies to increase their earnings by almost 50%. The purpose of this was to incentivize domestic producers to increase their output to shore up the U.S. government’s large outflow of gold that took place from 1929 to 1933.
Factors that were in the control of the management of Homestake Mining [HM] were many and especially effective in getting the stock price to increase in value. The cornerstone of Homestake’s success was their dividend policy. 53 years of continuous dividend payments helped Homestake grow to become the default choice for gold stock investments. The only year that Homestake didn’t pay a dividend was in 1920 which was a reflection of the state of the market for that year.
During times of crisis or when it was felt that the monetary situation was weakening, the management of Homestake Mining would increase the dividend or they would pay an extra dividend. This kind of proactive behavior boosted demand for the stock from institutions and the public even when the dividend exceeded the actual earnings. As an example, after Great Britain abandoned the gold standard, Homestake increased the dividend from $6 to $7.80 in 1931.
On other occasions, Homestake would routinely declare an extra dividend of $1. This dividend would typically come each September, which was in addition to the previously declared payments. While not guaranteed, the $1 extra dividend was paid almost every year and sometimes two or three times within a single year.
Inevitably the payments of dividends would only go so far. Without a profitable business, Homestake would be broke. To resolve this issue, Homestake Mining management was aggressive at increasing efficiencies. In the span of a five-year period, Homestake management was able to nearly double the gold recovery from $3.77 in 1925 to $6.17 in 1930.
The final piece that was essential to the incredible increase of Homestake Mining was the fact that the stock was thinly traded. This critical element, along with the others mentioned before, ensured that a gold mine in the Dakota territory, initially started by George Hearst (father of William Randolph Hearst), Lloyd Tevis and J.B. Haggin, would increase from $9 in 1891 to well over $5000 (unadjusted) by 1987.
The lessons of Homestake Mining may simply be a matter of circumstance, unfair labor practices, below market wages and the acquisition of land in the most unscrupulous fashion. However, some lessons about how Homestake management operated are likely to prove useful to the understanding the reasons why Homestake’s stock price continued to go up in value when others didn’t but should have.


Source Citations:

  • “Abreast of the Market.” Wall Street Journal. December 16, 1931. page 8.
  • “Abreast of the Market.” Wall Street Journal. May 6, 1932. page 8.
  • Rice, Claude T. “Premium Paid for Homestake.” Wall Street Journal. May 4, 1933. page 10.
  • “Gold Ruling Adds to Miners’ Income.” Wall Street Journal. August 30, 1933. page 1.
  • Poor’s High and Low Prices 1920-1930. Poor’s Publishing Company. 1931.
  • Poor’s High and Low Prices 1924-1933. Poor’s Publishing Company. 1934.
  • Poor’s High and Low Prices 1932-1940. Poor’s Publishing Company. 1941.